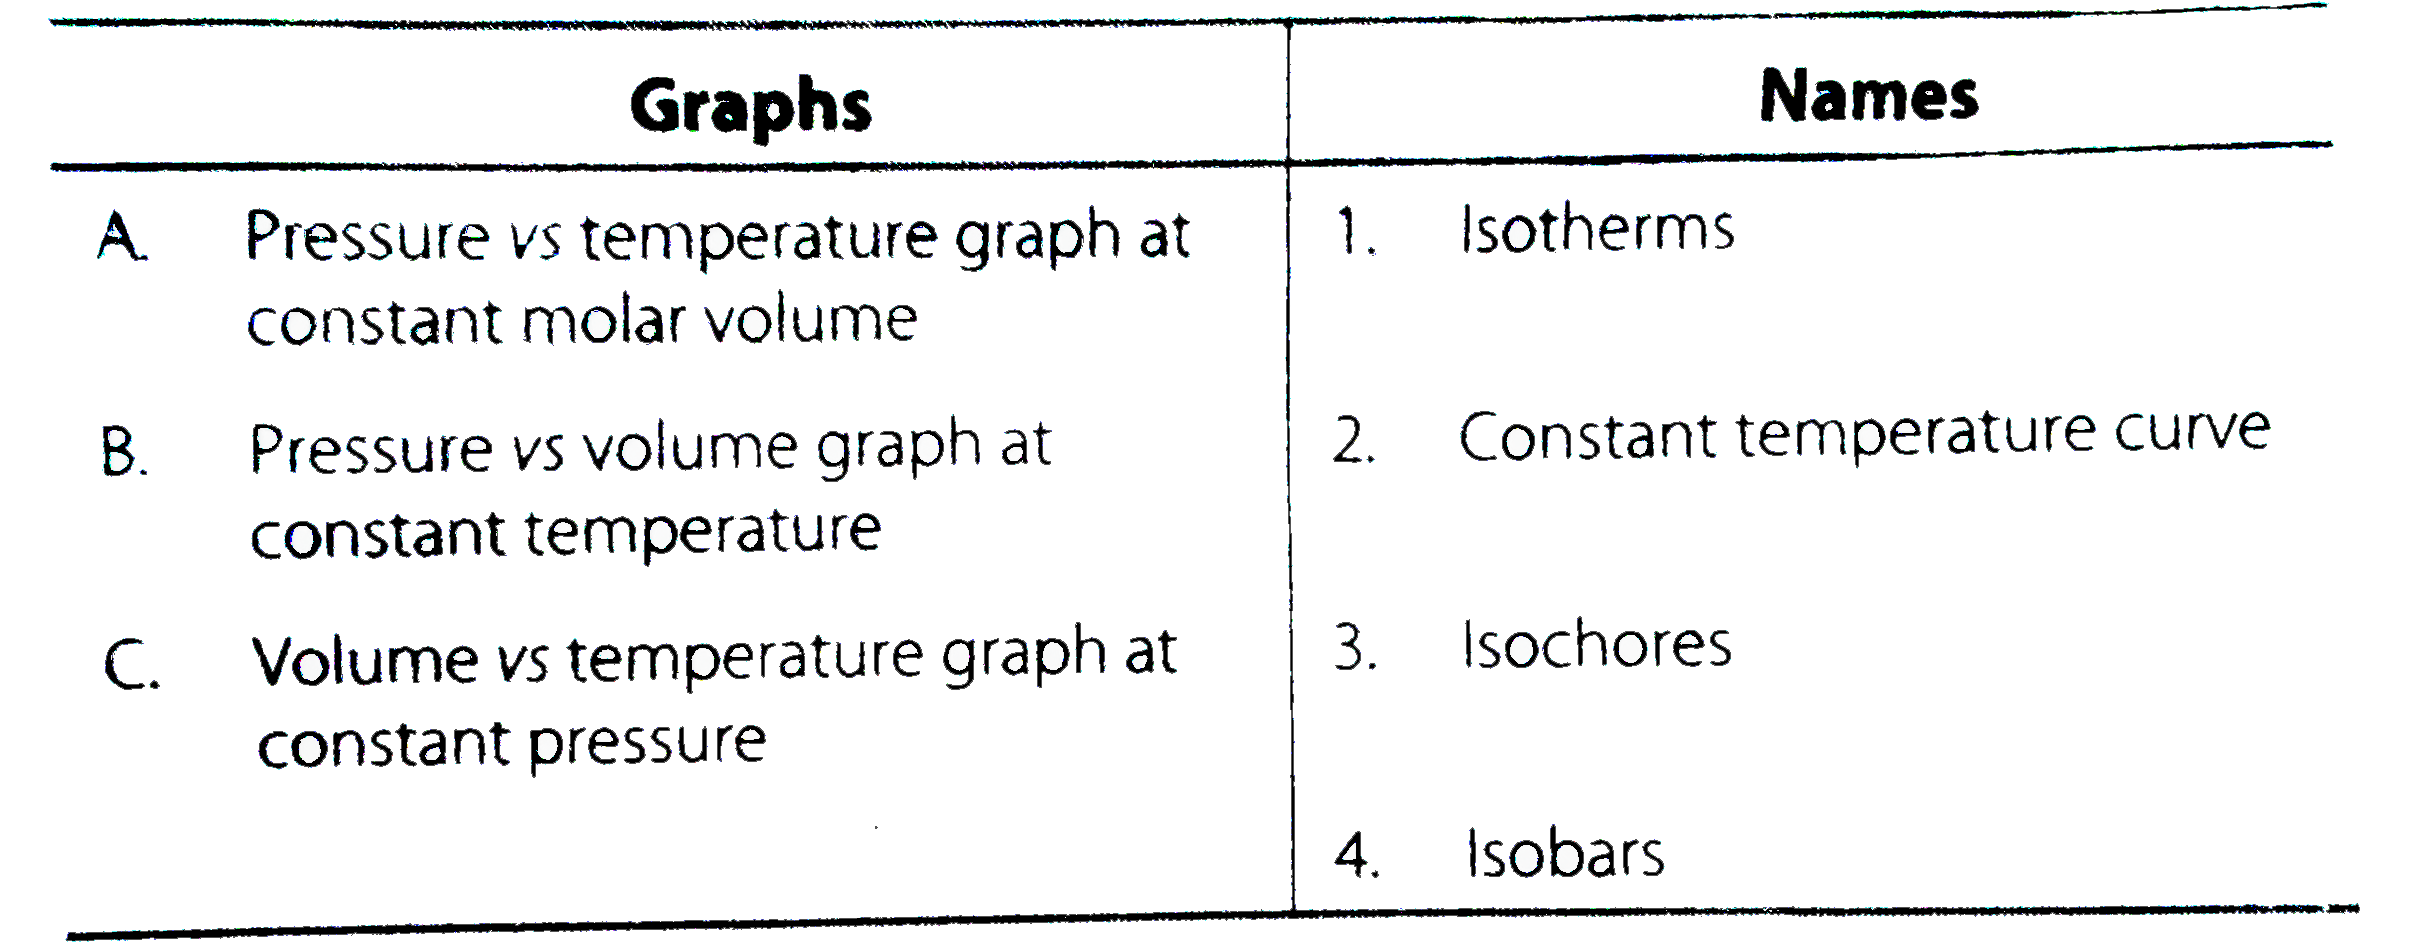
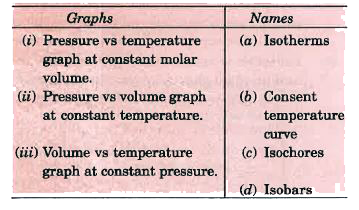
Match the following graphs of ideal gas with their coordinates.
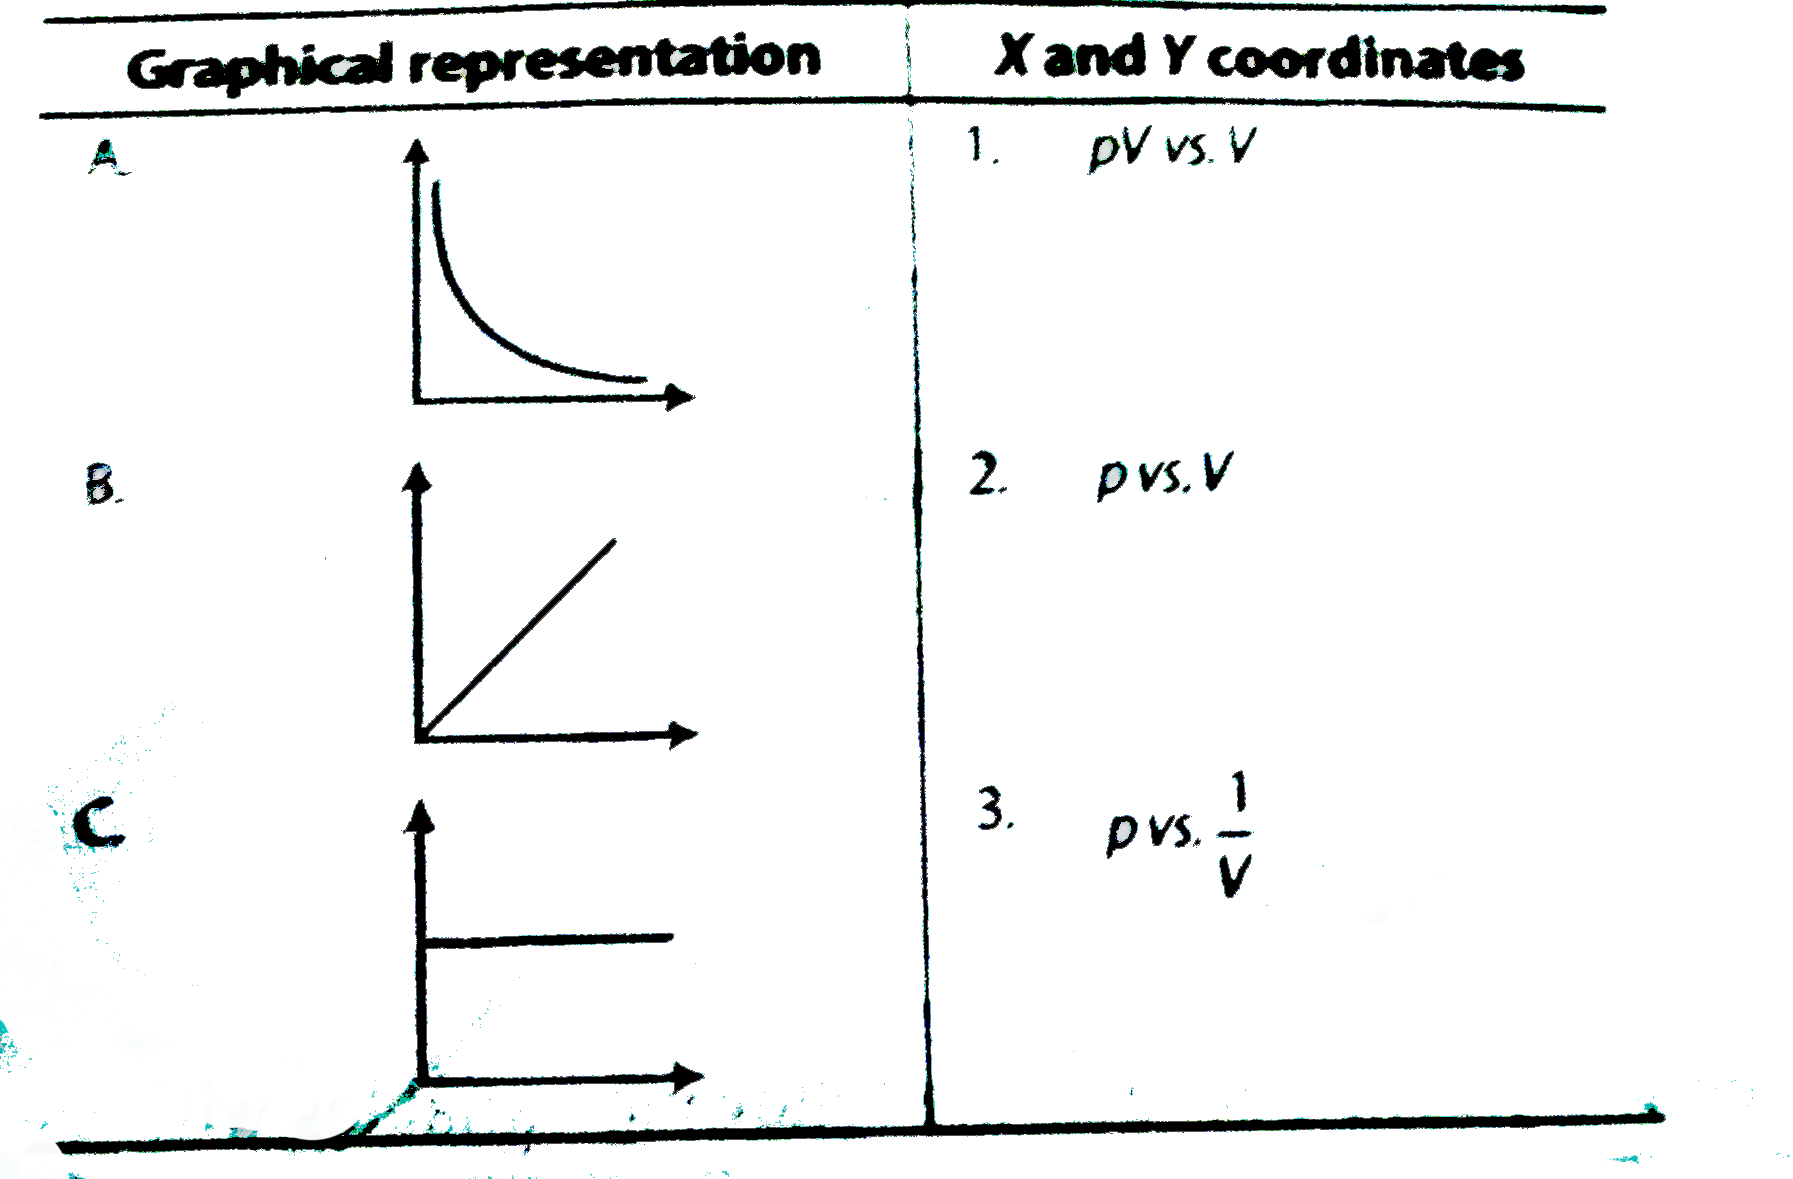
The correct Answer is:A, B, C
Step by step video, text & image solution for Match the following graphs of ideal gas with their coordinates. by Chemistry experts to help you in doubts & scoring excellent marks in Class 11 exams.
Topper's Solved these Questions
- BOOK - DINESH PUBLICATIONCHAPTER - STATES OF MATTER : GASES AND LIQUIDSEXERCISE - Multiple Choice Question (Select the correct Answer)13videos
STATES OF MATTER : GASES AND LIQUIDS
- BOOK - DINESH PUBLICATIONCHAPTER - STATES OF MATTER : GASES AND LIQUIDSEXERCISE - Assignment (Very Short Answer Question)24videos
STATES OF MATTER : GASES AND LIQUIDS
- BOOK - DINESH PUBLICATIONCHAPTER - STATES OF MATTER : GASES AND LIQUIDSEXERCISE - Practice40videos
STATES OF MATTER : GASES AND LIQUIDS
- BOOK - DINESH PUBLICATIONCHAPTER - STATES OF MATTER (SOLID STATE CHEMISTRY)EXERCISE - ULTIMATE PREPARATORY PACKAGE21videos
STATES OF MATTER (SOLID STATE CHEMISTRY)
- BOOK - DINESH PUBLICATIONCHAPTER - STRUCTURE OF ATOMEXERCISE - Reason Type Questions1videos
STRUCTURE OF ATOM
Similar Questions
Knowledge Check
- Question 1 - Select One
Which of the following graphs correctly represents the variation of β=−(dV/dP)/V with P for an ideal gas at constant temperature?
A B
B C
C D
D
- Question 2 - Select One
Which of the following graphs correctly represents the variation of β=−dV/dPV
with P for an ideal gas at constant temperature?A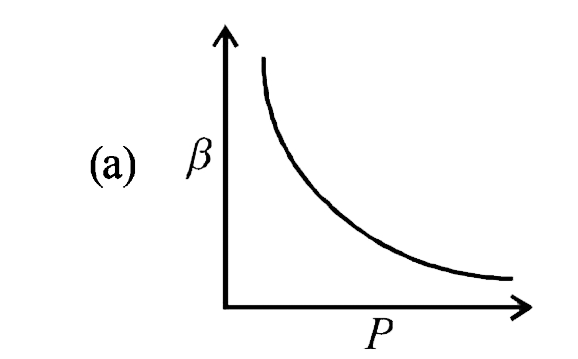 B
B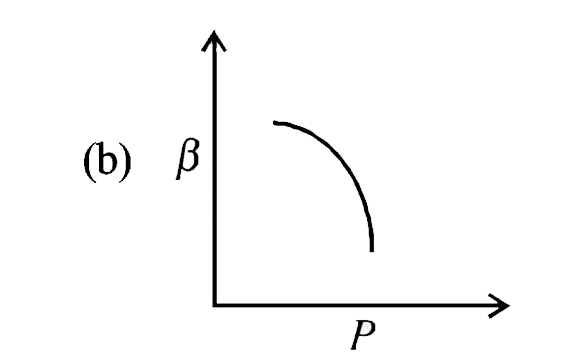 C
C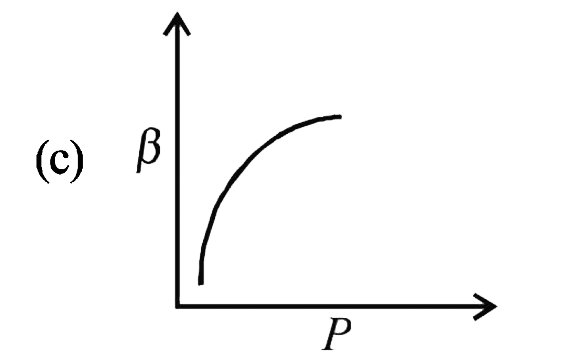 D
D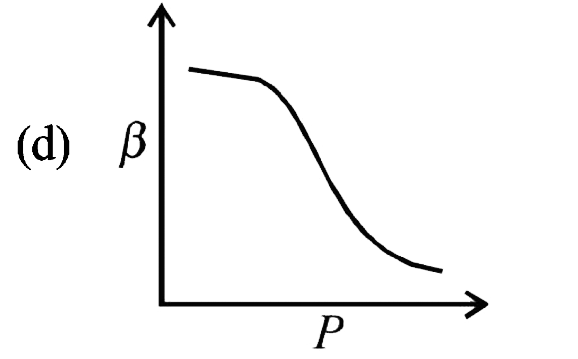
- Question 3 - Select One
Which of the following graphs correctly represents the variation of β=−(dVdP)/V with P for an ideal gas at constant temperature
A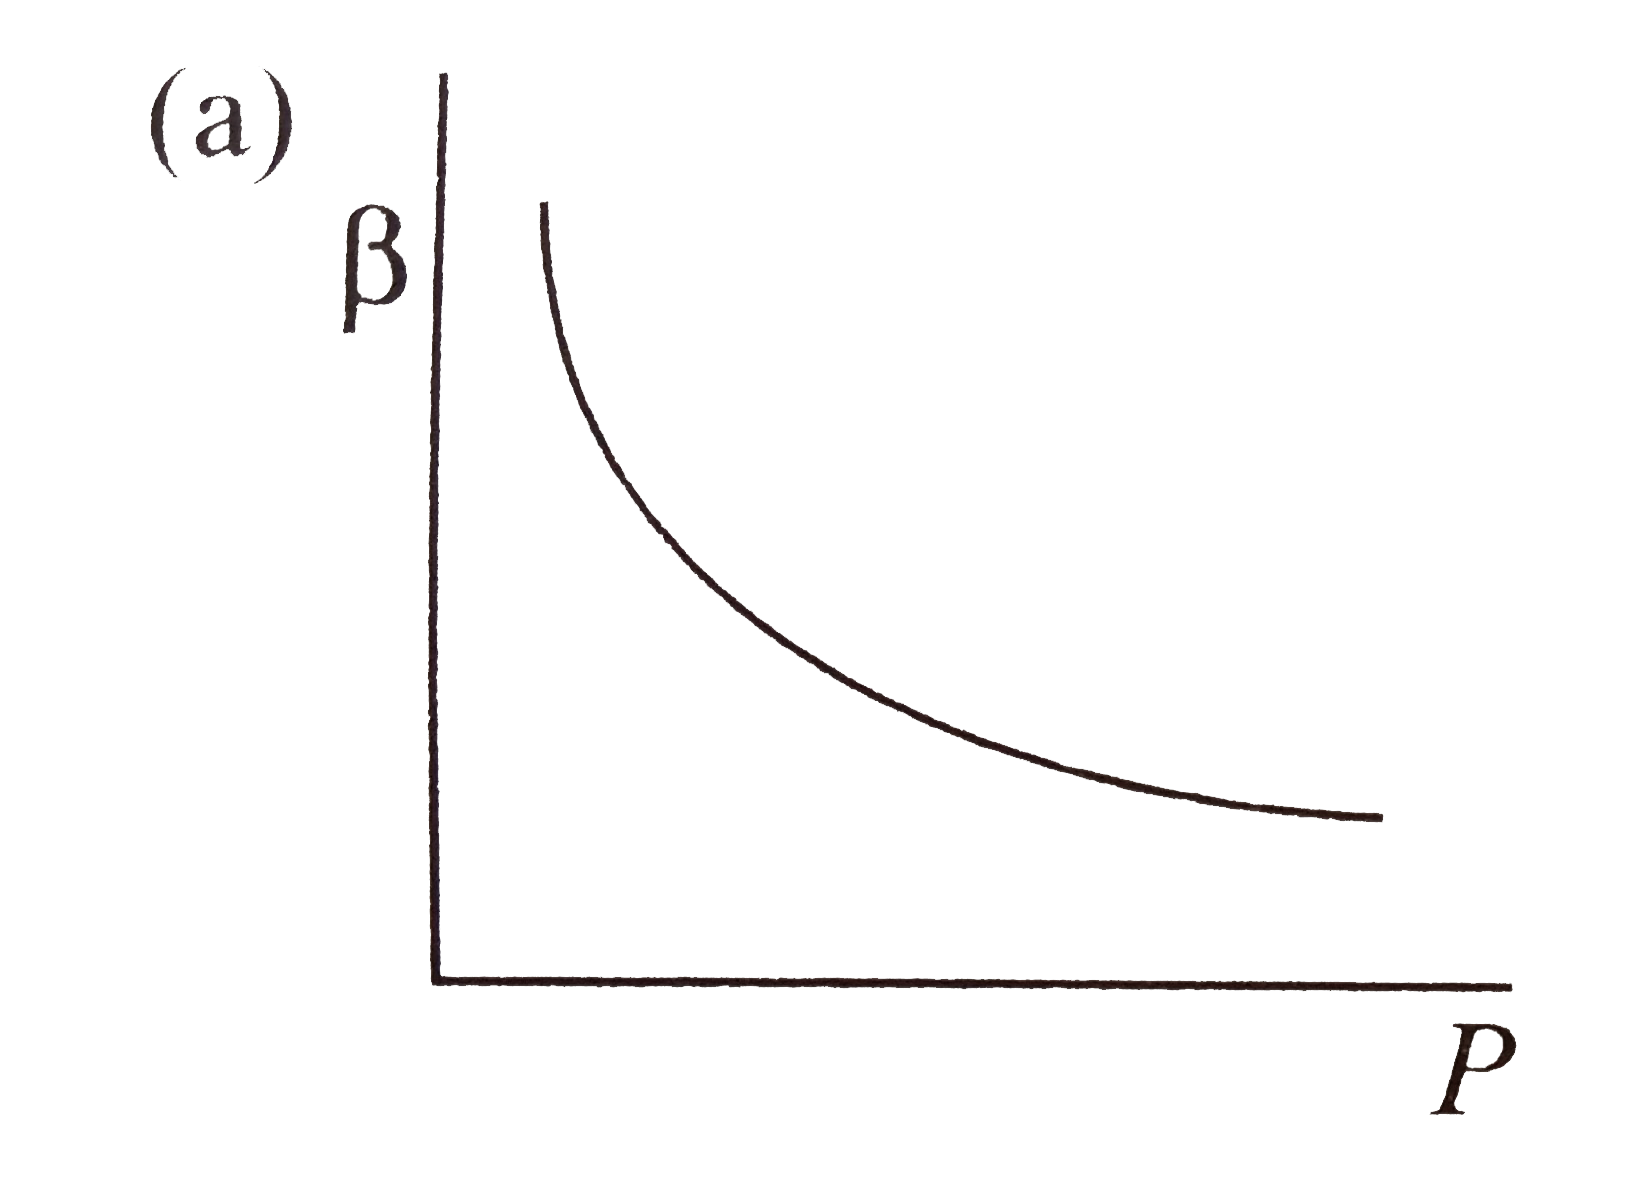 B
B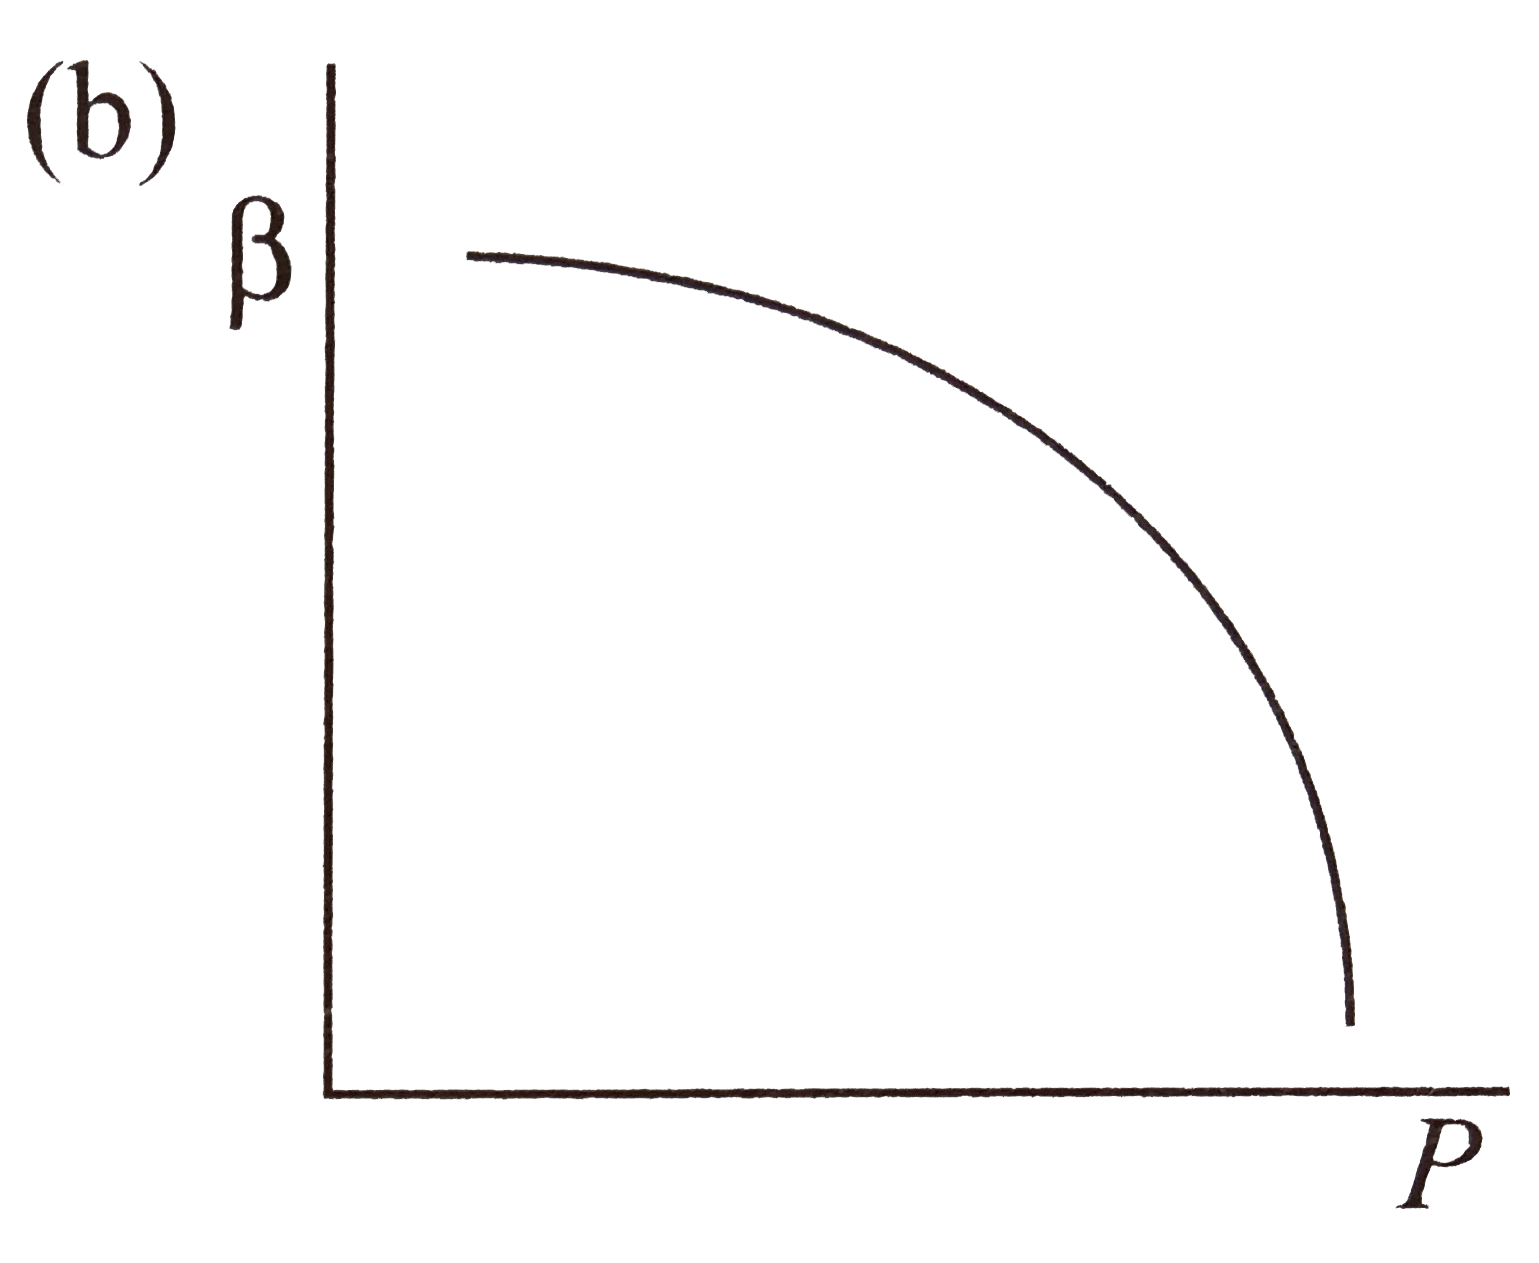 C
C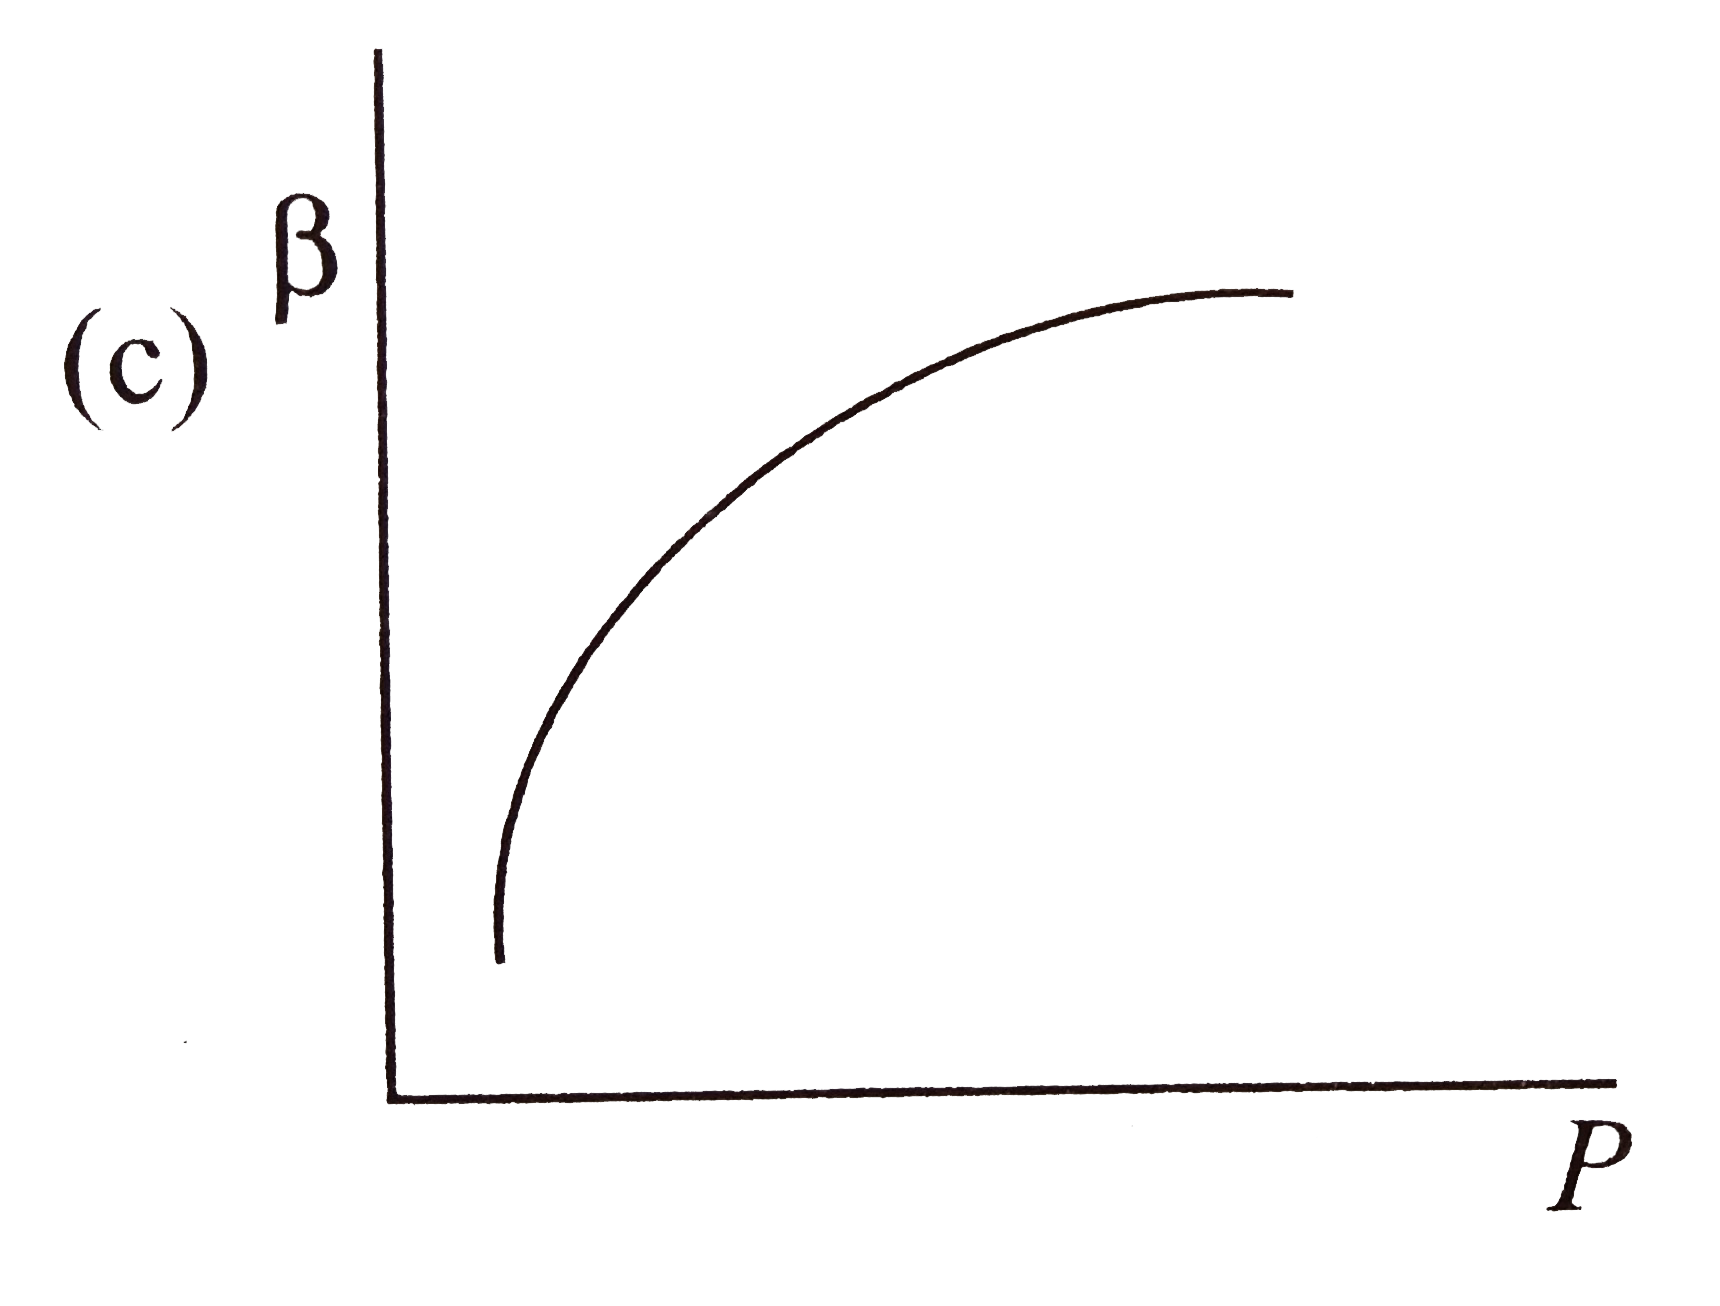 D
D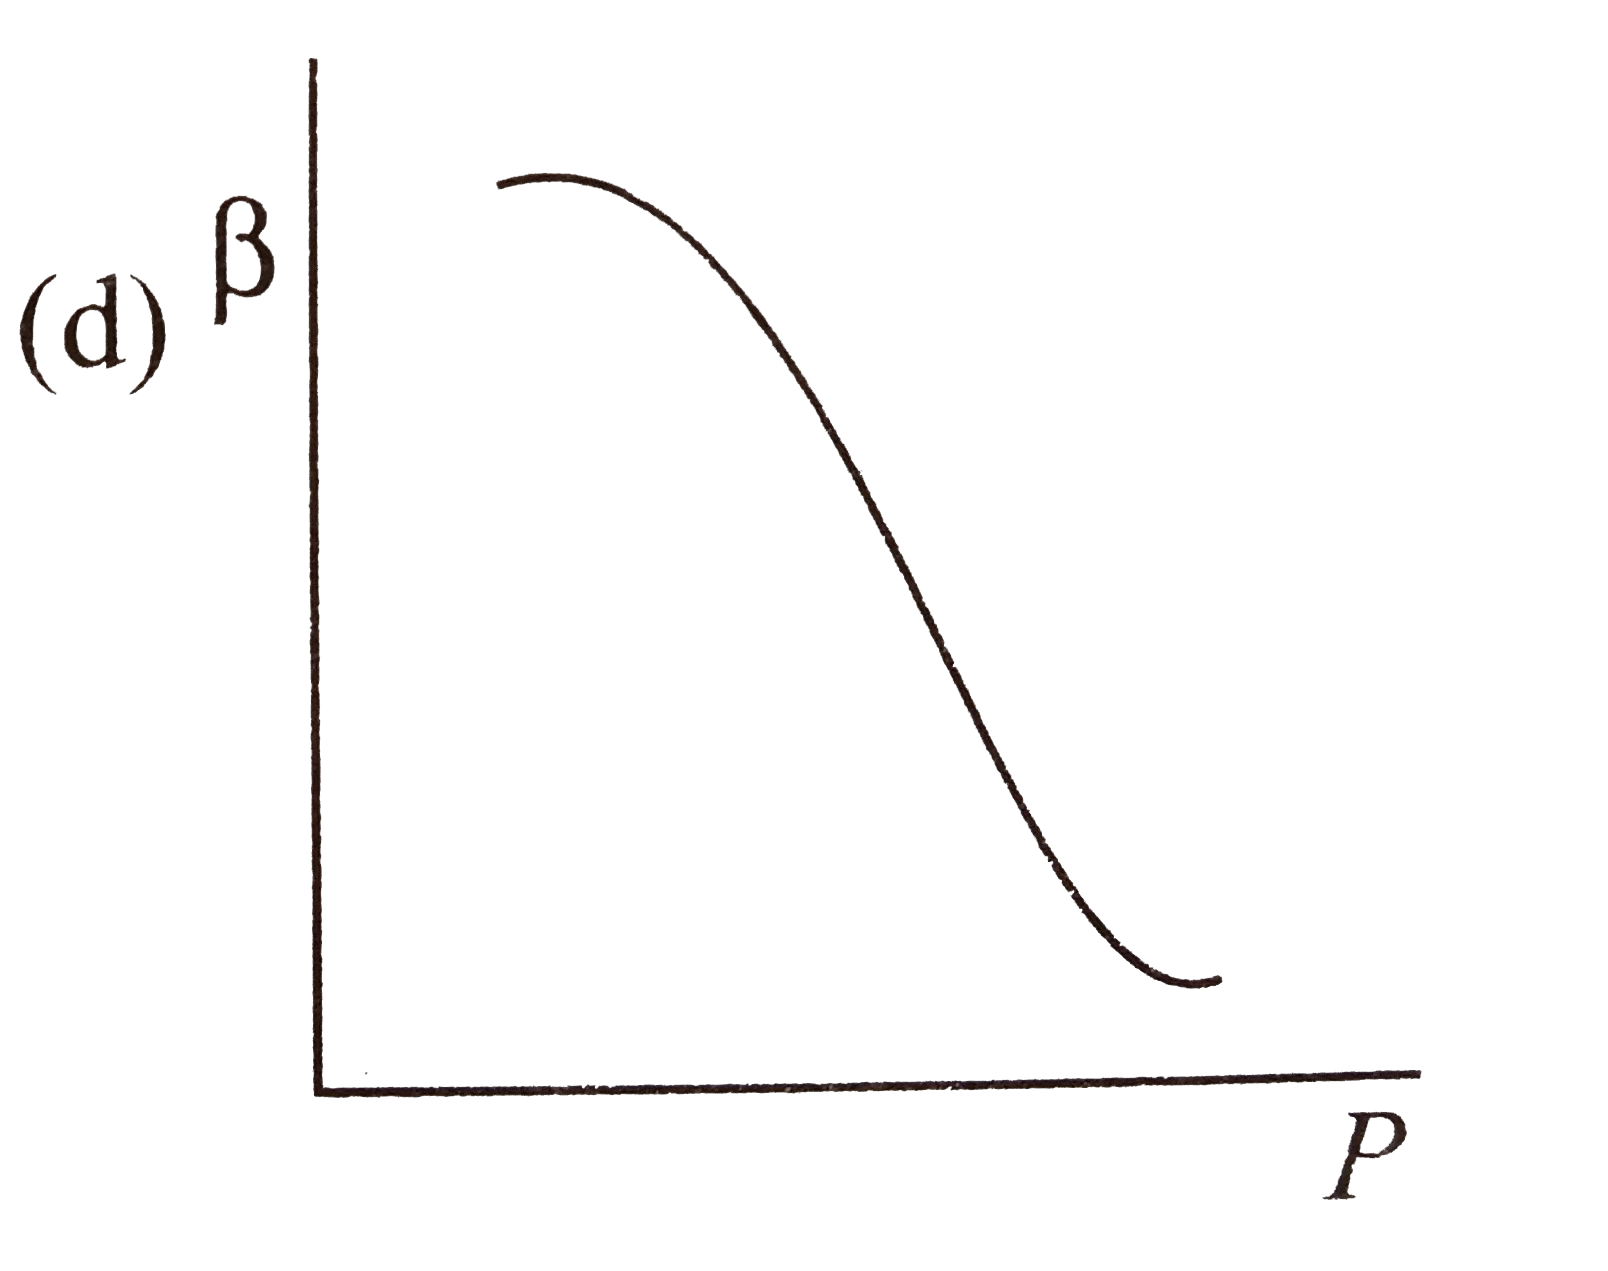
For a ideal monoatomic gas match the following graphs for constant mass in different processes (ρ = Density of gas)
_E01_156_Q01.png) View Solution
View SolutionWork done on a ideal gas in a cylinder when it is compressed by an external pressure in a single step is shown below :
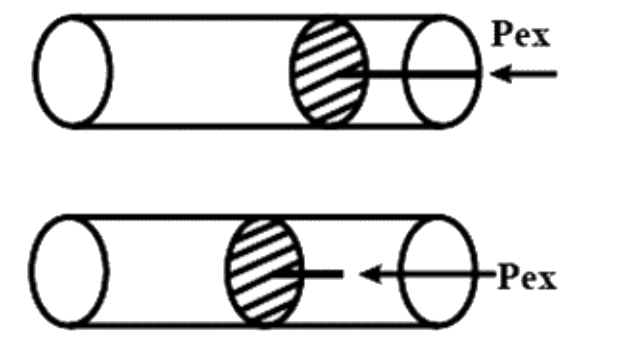
Which of the following graphs will show the work done on the gas?View SolutionMatch the graphs between the following variables with their names :
 View Solution
Which of the following graphs correctly represents the variation of β=−dV/dPV
with P for an ideal gas at constant temperature?View SolutionWhich of the following graphs correctly represents the variation of β=−(dVdP)1V with P for an ideal gas at constant temperature ?
View Solution


