Plot of Maxwell's distribution of velocities is given below :
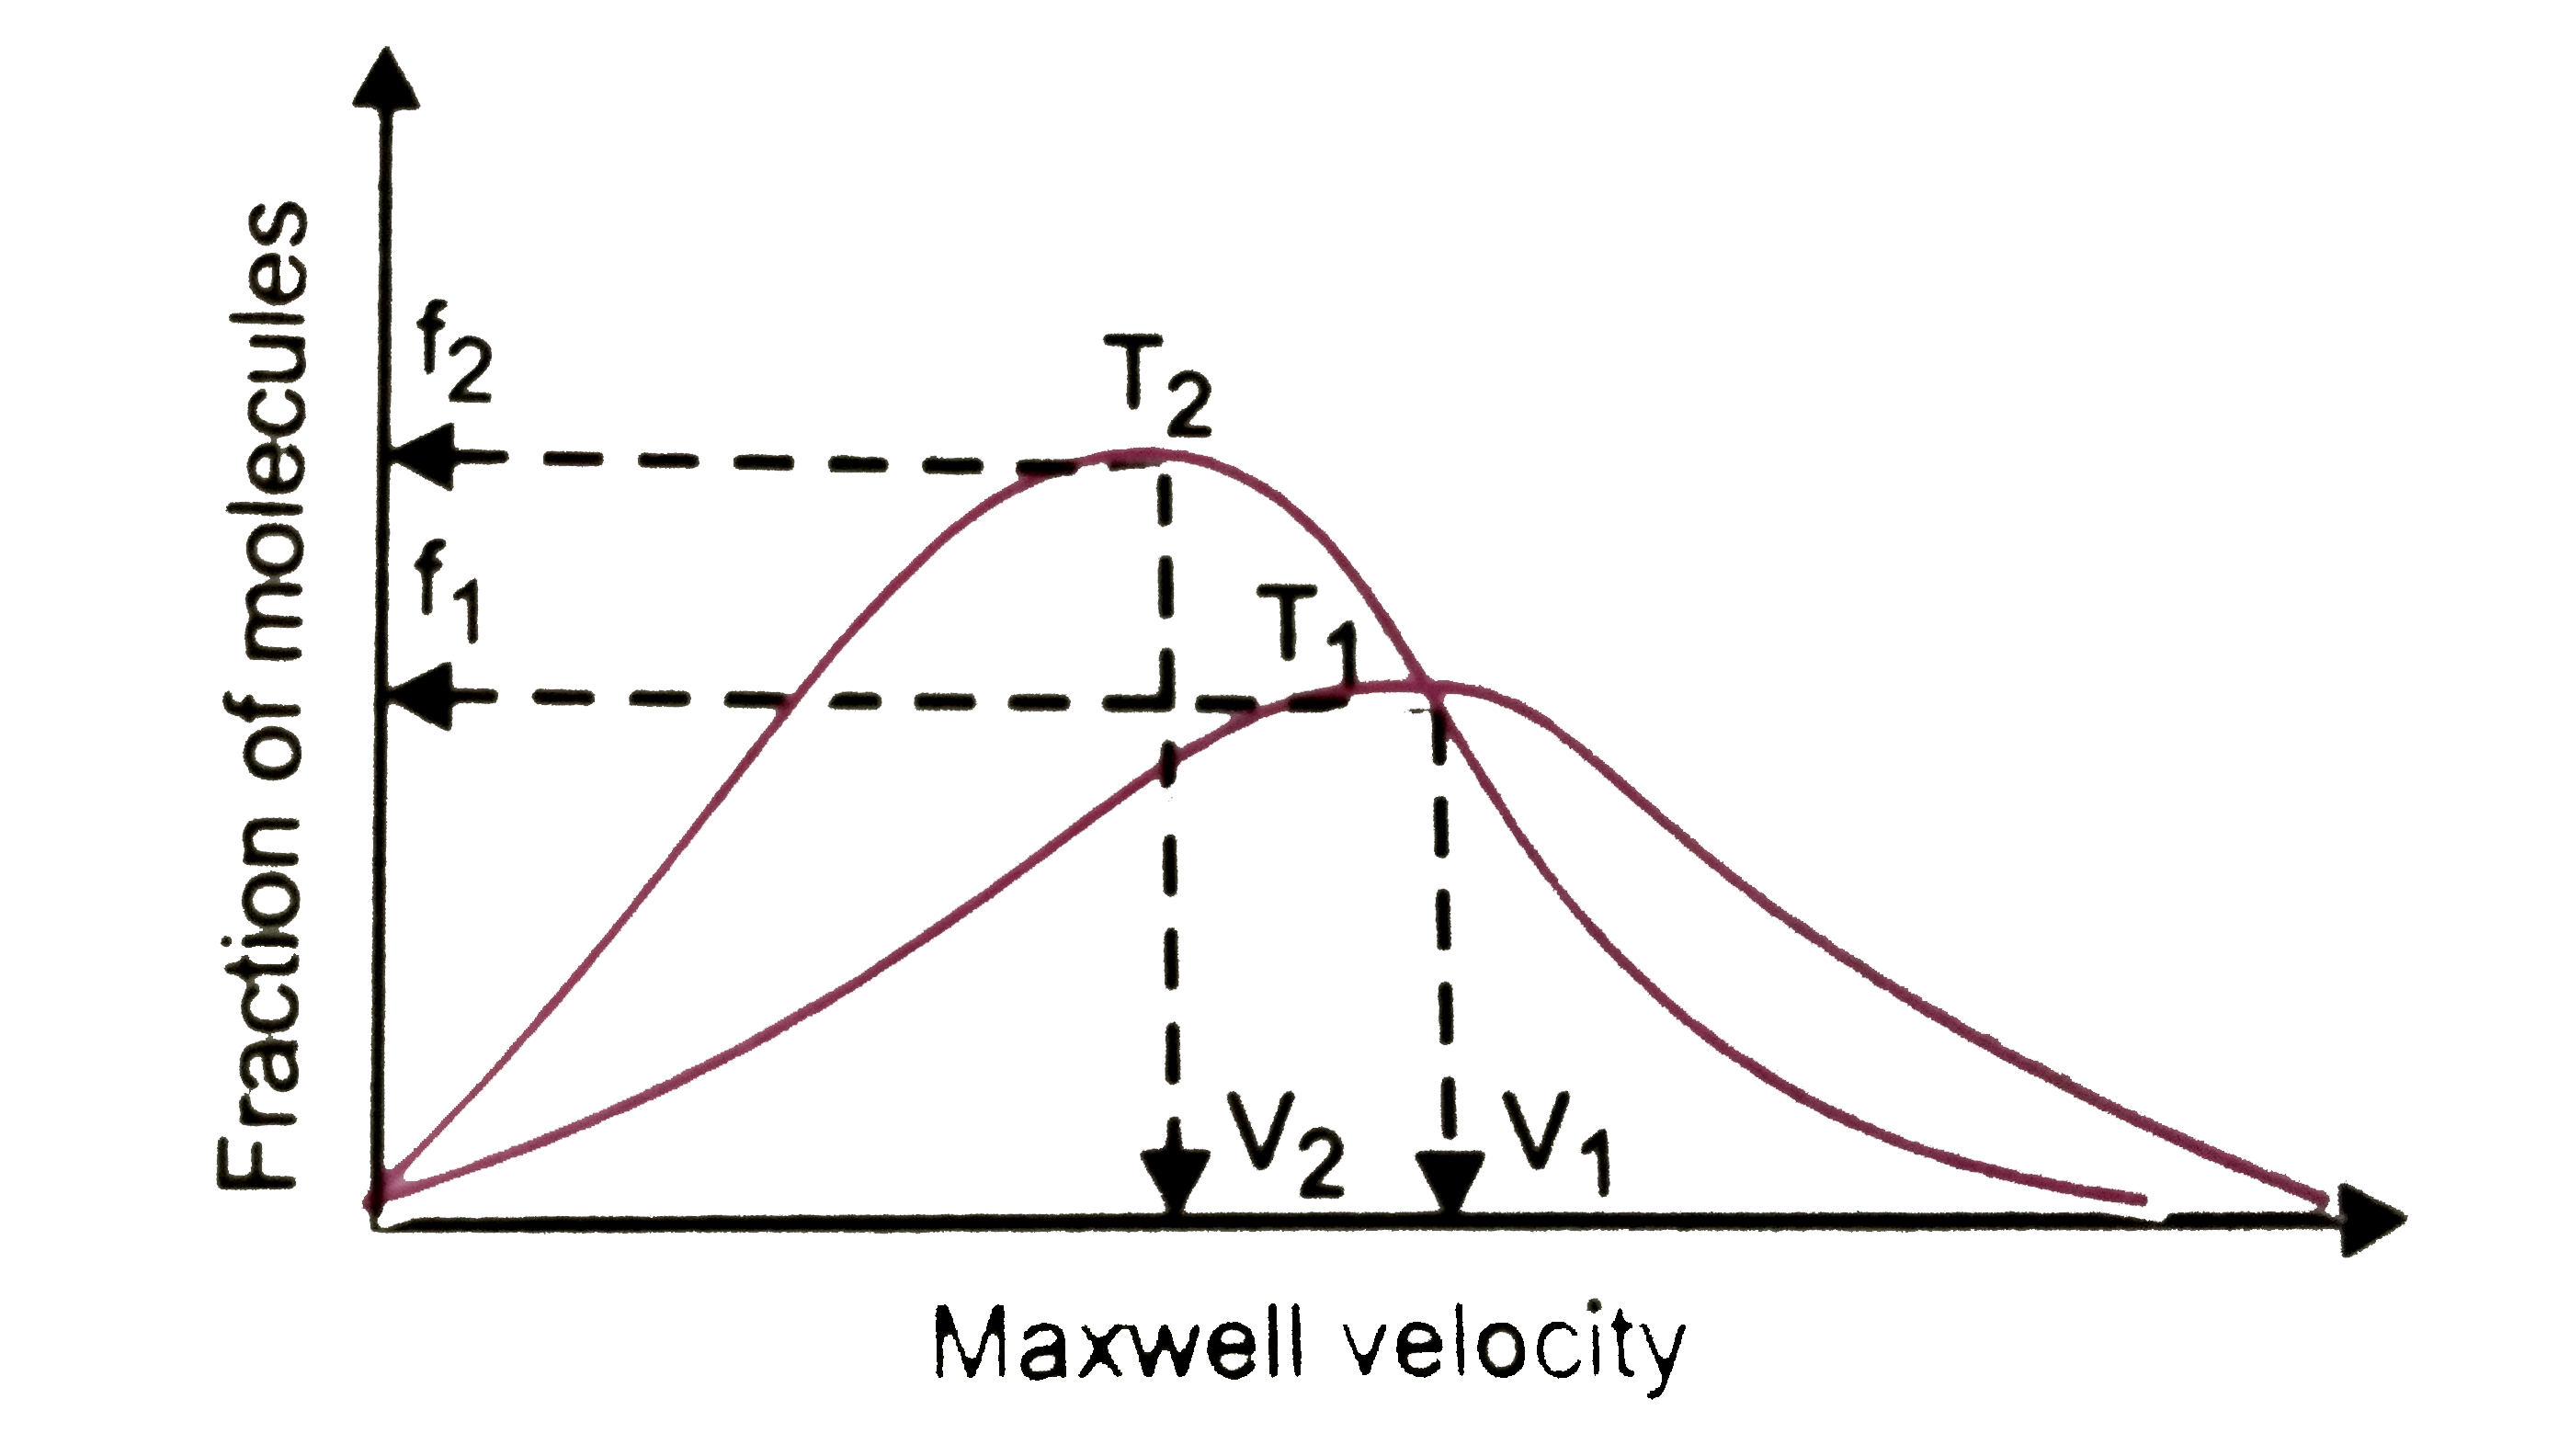
Which of the following is correct about this plot ?
A
f1>f2
B
V1<V2
C
T1<T2
D
T1>T2
Text Solution
The correct Answer is:D
In Maxwell's distribution of velocities, at higher temperature, the curve shifts forward and downward. Hence, T1>T2(f2>f1,V1>V2).
|
Topper's Solved these Questions
- STATES OF MATTER : GASES AND LIQUIDESBOOK - PRADEEPCHAPTER - STATES OF MATTER : GASES AND LIQUIDESEXERCISE - COMPETITION FOCUS (Behaviour of real gases and van der Waals equation)
12 Videos
- STATES OF MATTER : GASES AND LIQUIDESBOOK - PRADEEPCHAPTER - STATES OF MATTER : GASES AND LIQUIDESEXERCISE - COMPETITION FOCUS (Liquefaction of gases and critical temperature)
3 Videos
- STATES OF MATTER : GASES AND LIQUIDESBOOK - PRADEEPCHAPTER - STATES OF MATTER : GASES AND LIQUIDESEXERCISE - COMPETITION FOCUS (Measurement of mass, volume, temperature and pressure, gas laws and ideal gas equation
36 Videos
- SOME p-BLOCK ELEMENTSBOOK - PRADEEPCHAPTER - SOME p-BLOCK ELEMENTSEXERCISE - Competition Focus (JEE( Main and Advanced)/Medical Entrance) VIII. Assertion-Reason Type Questions (Type I)
23 Videos
- STATES OF MATTER: SOLID MATTERBOOK - PRADEEPCHAPTER - STATES OF MATTER: SOLID MATTEREXERCISE - COMPETITION FOCUS (ASSERTION-REASON)
17 Videos
Similar Questions
Knowledge Check
Plot of Maxwell's distribution of velocities is given below:
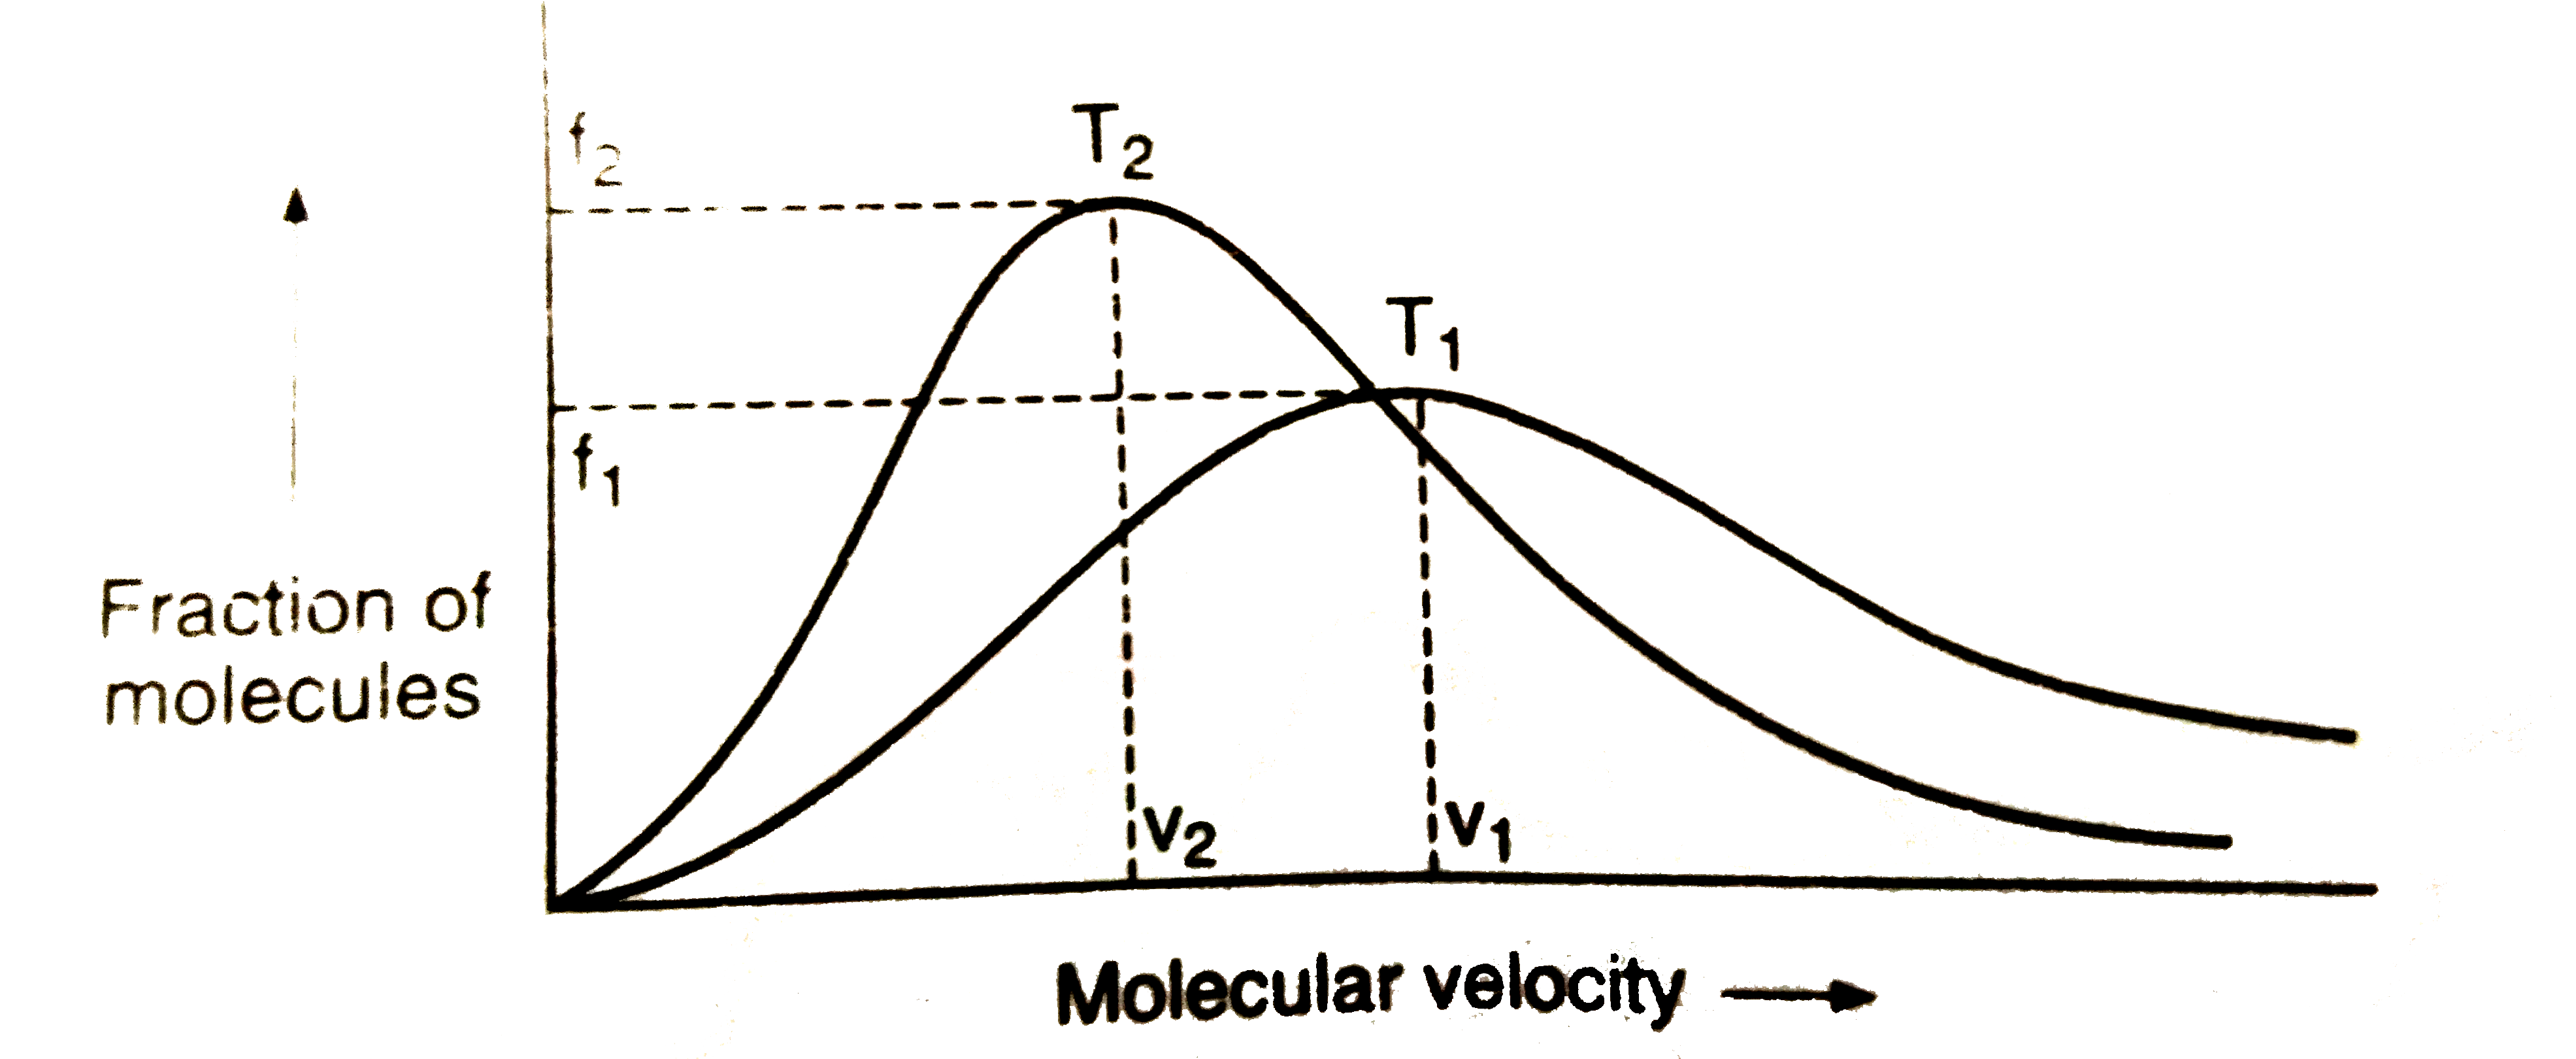
which of following is correct ?AT1>T2BT1<T2Cv1<v2Df1>f2Which of the following plots are correct ?
A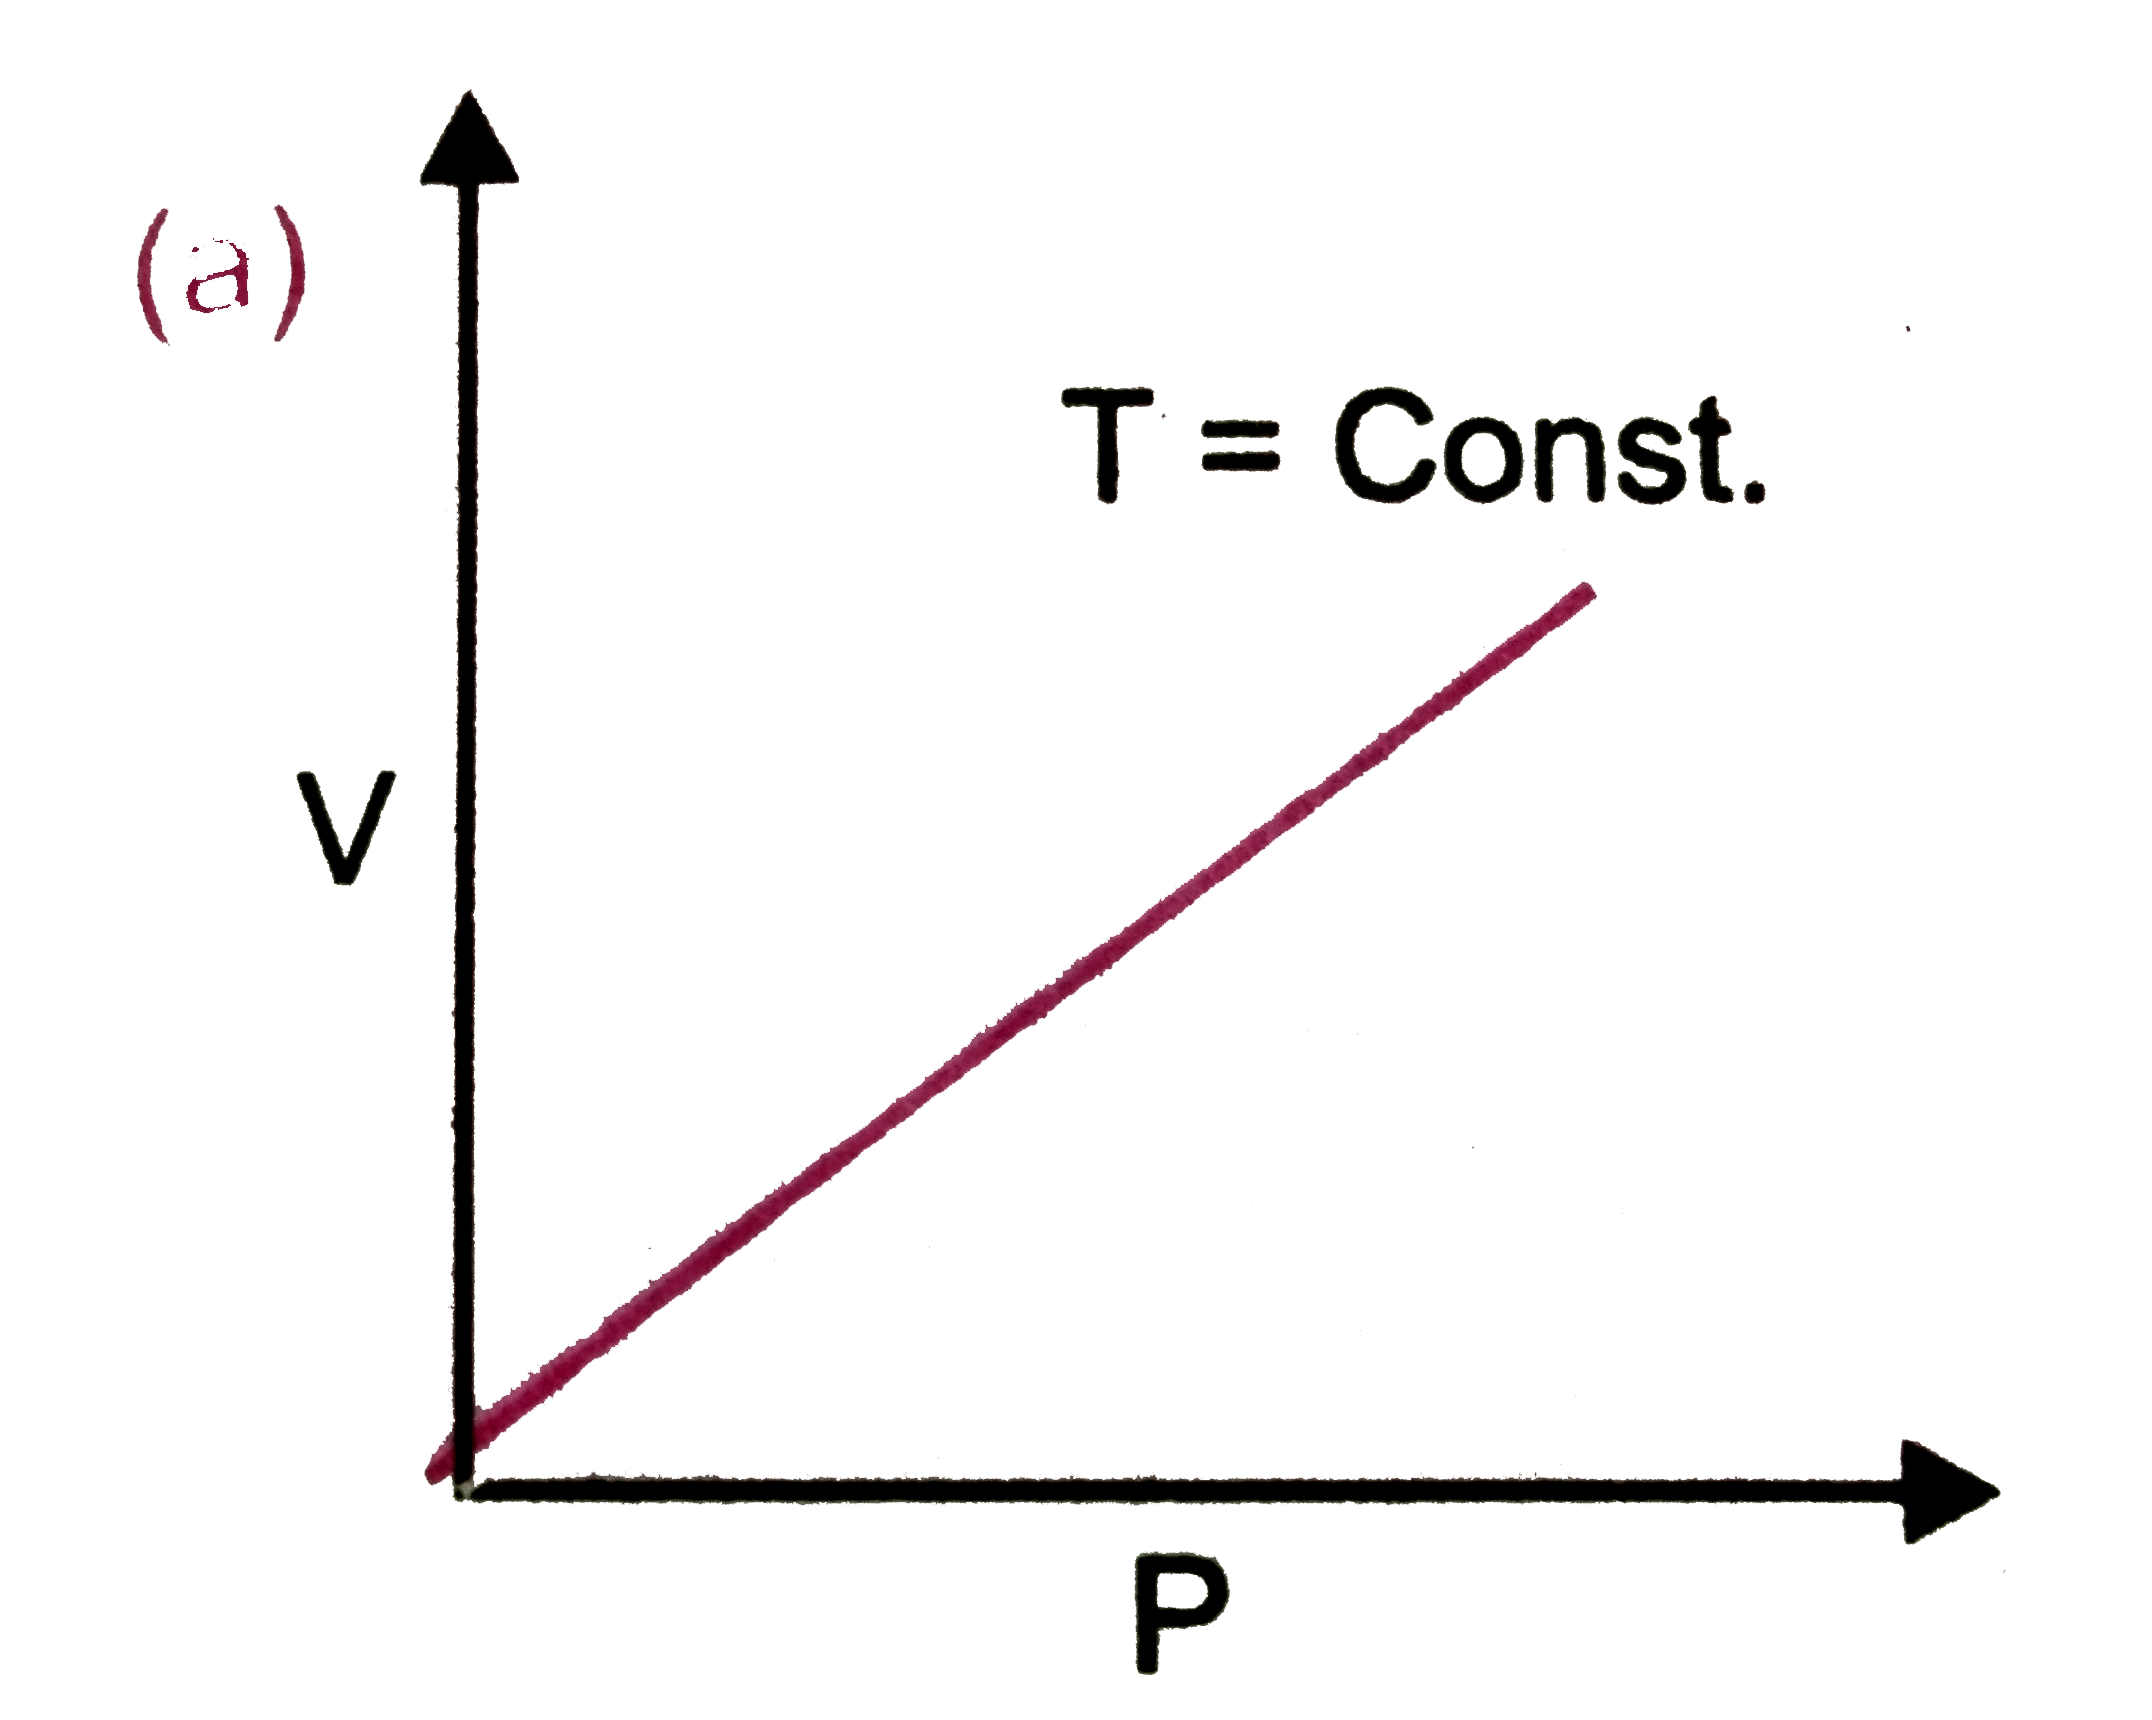 B
B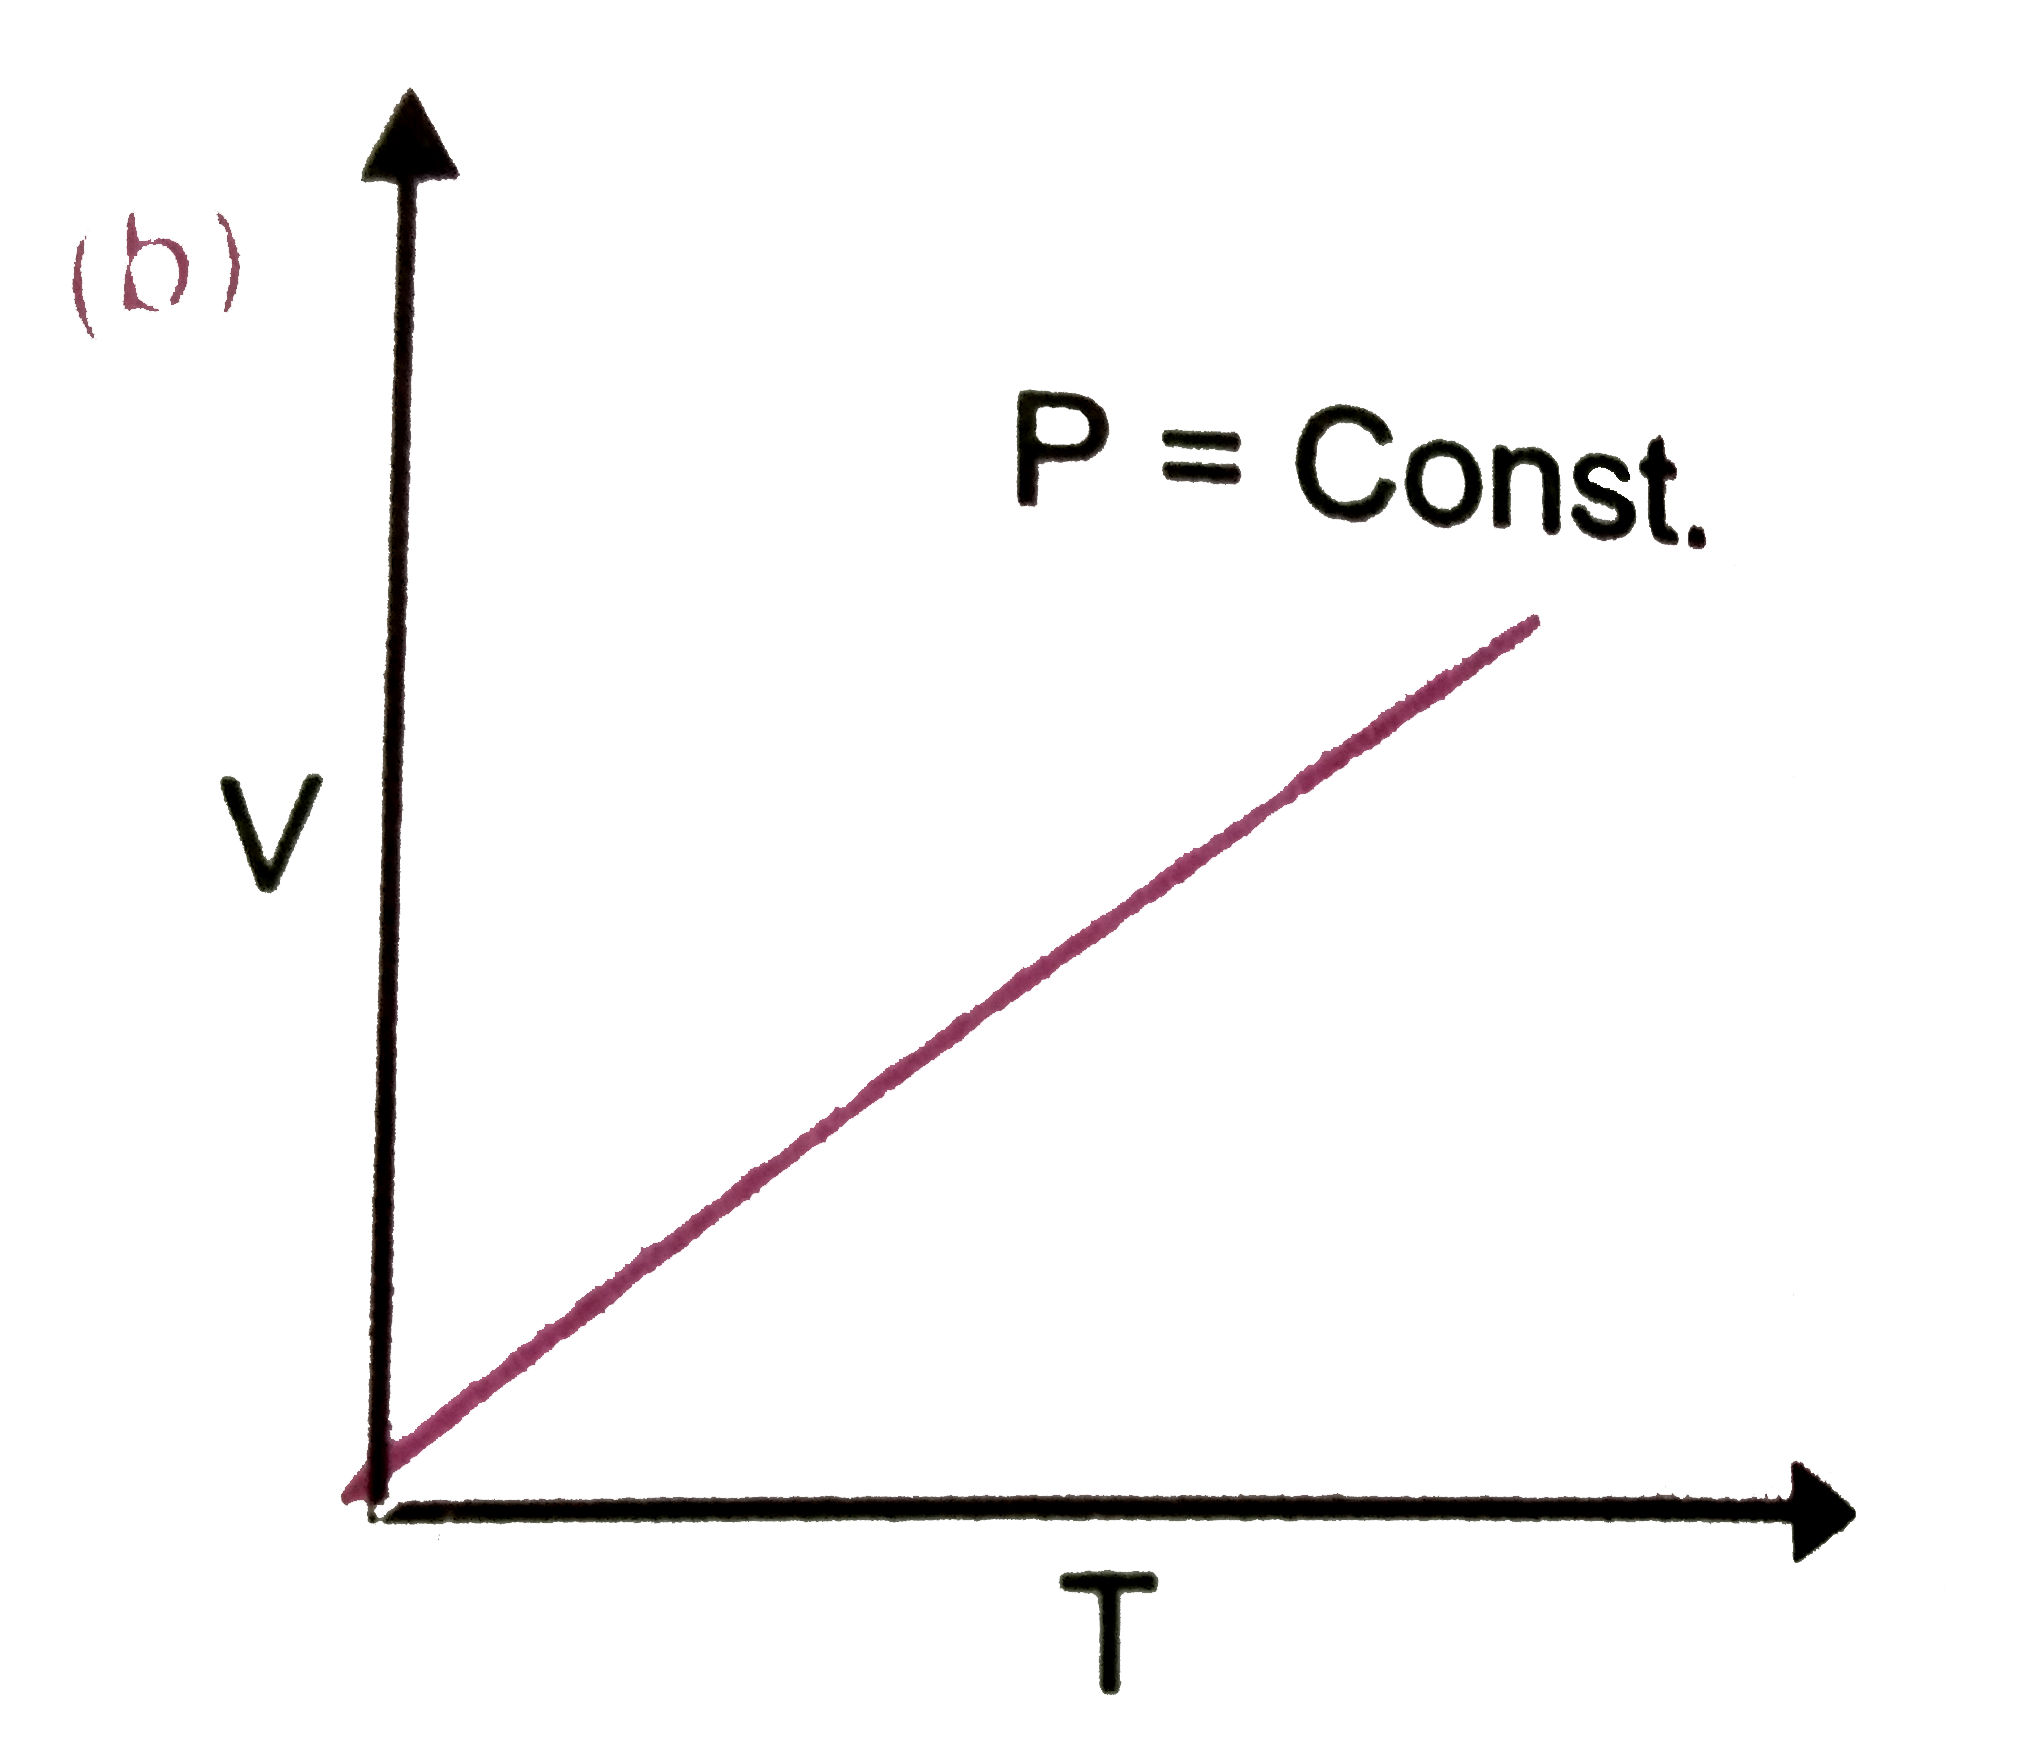 C
C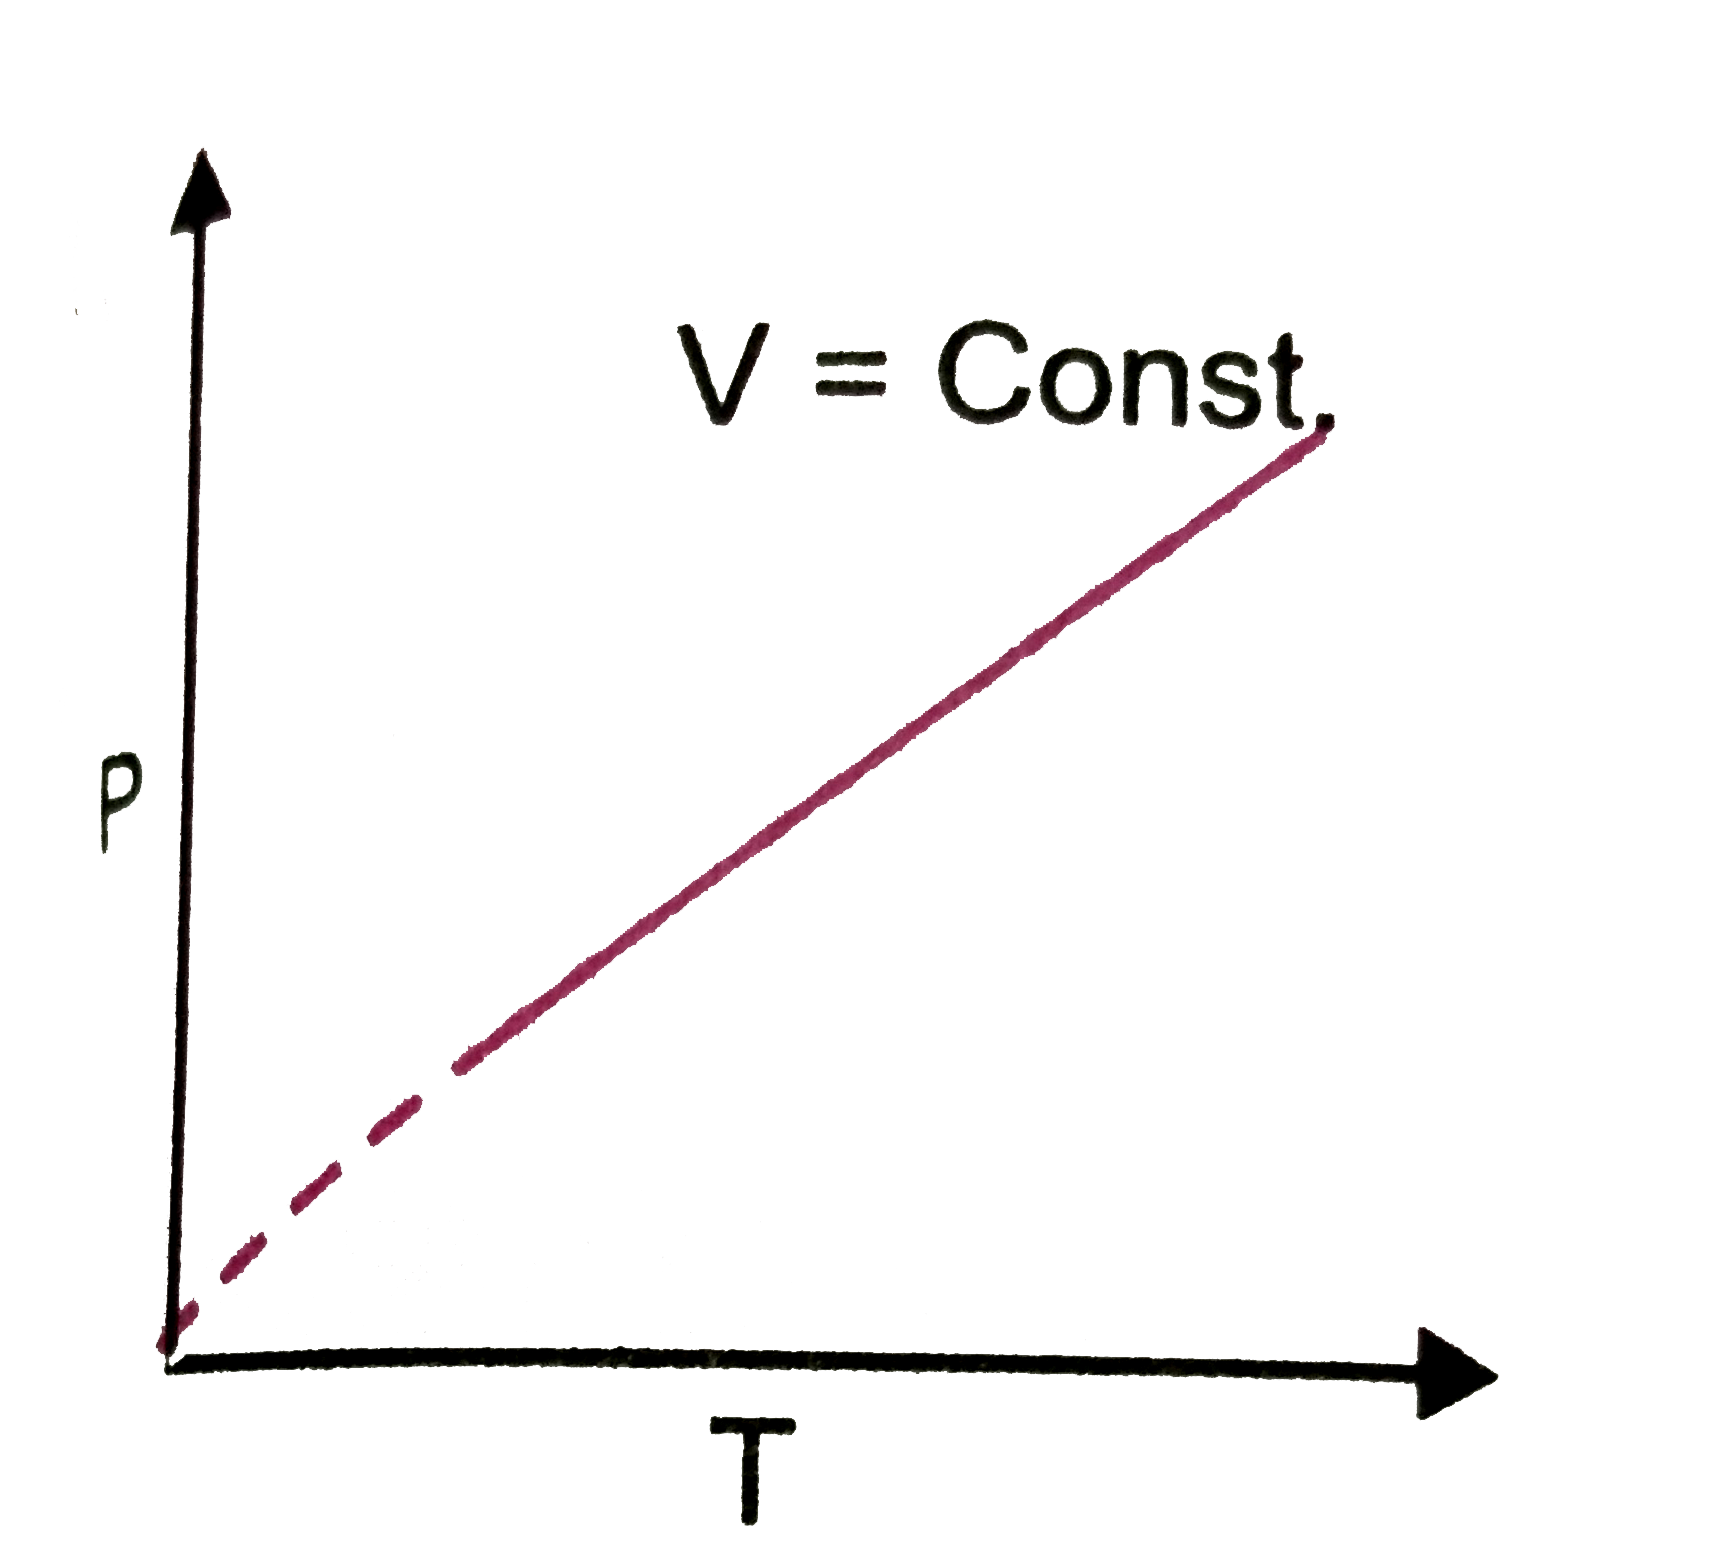 D
D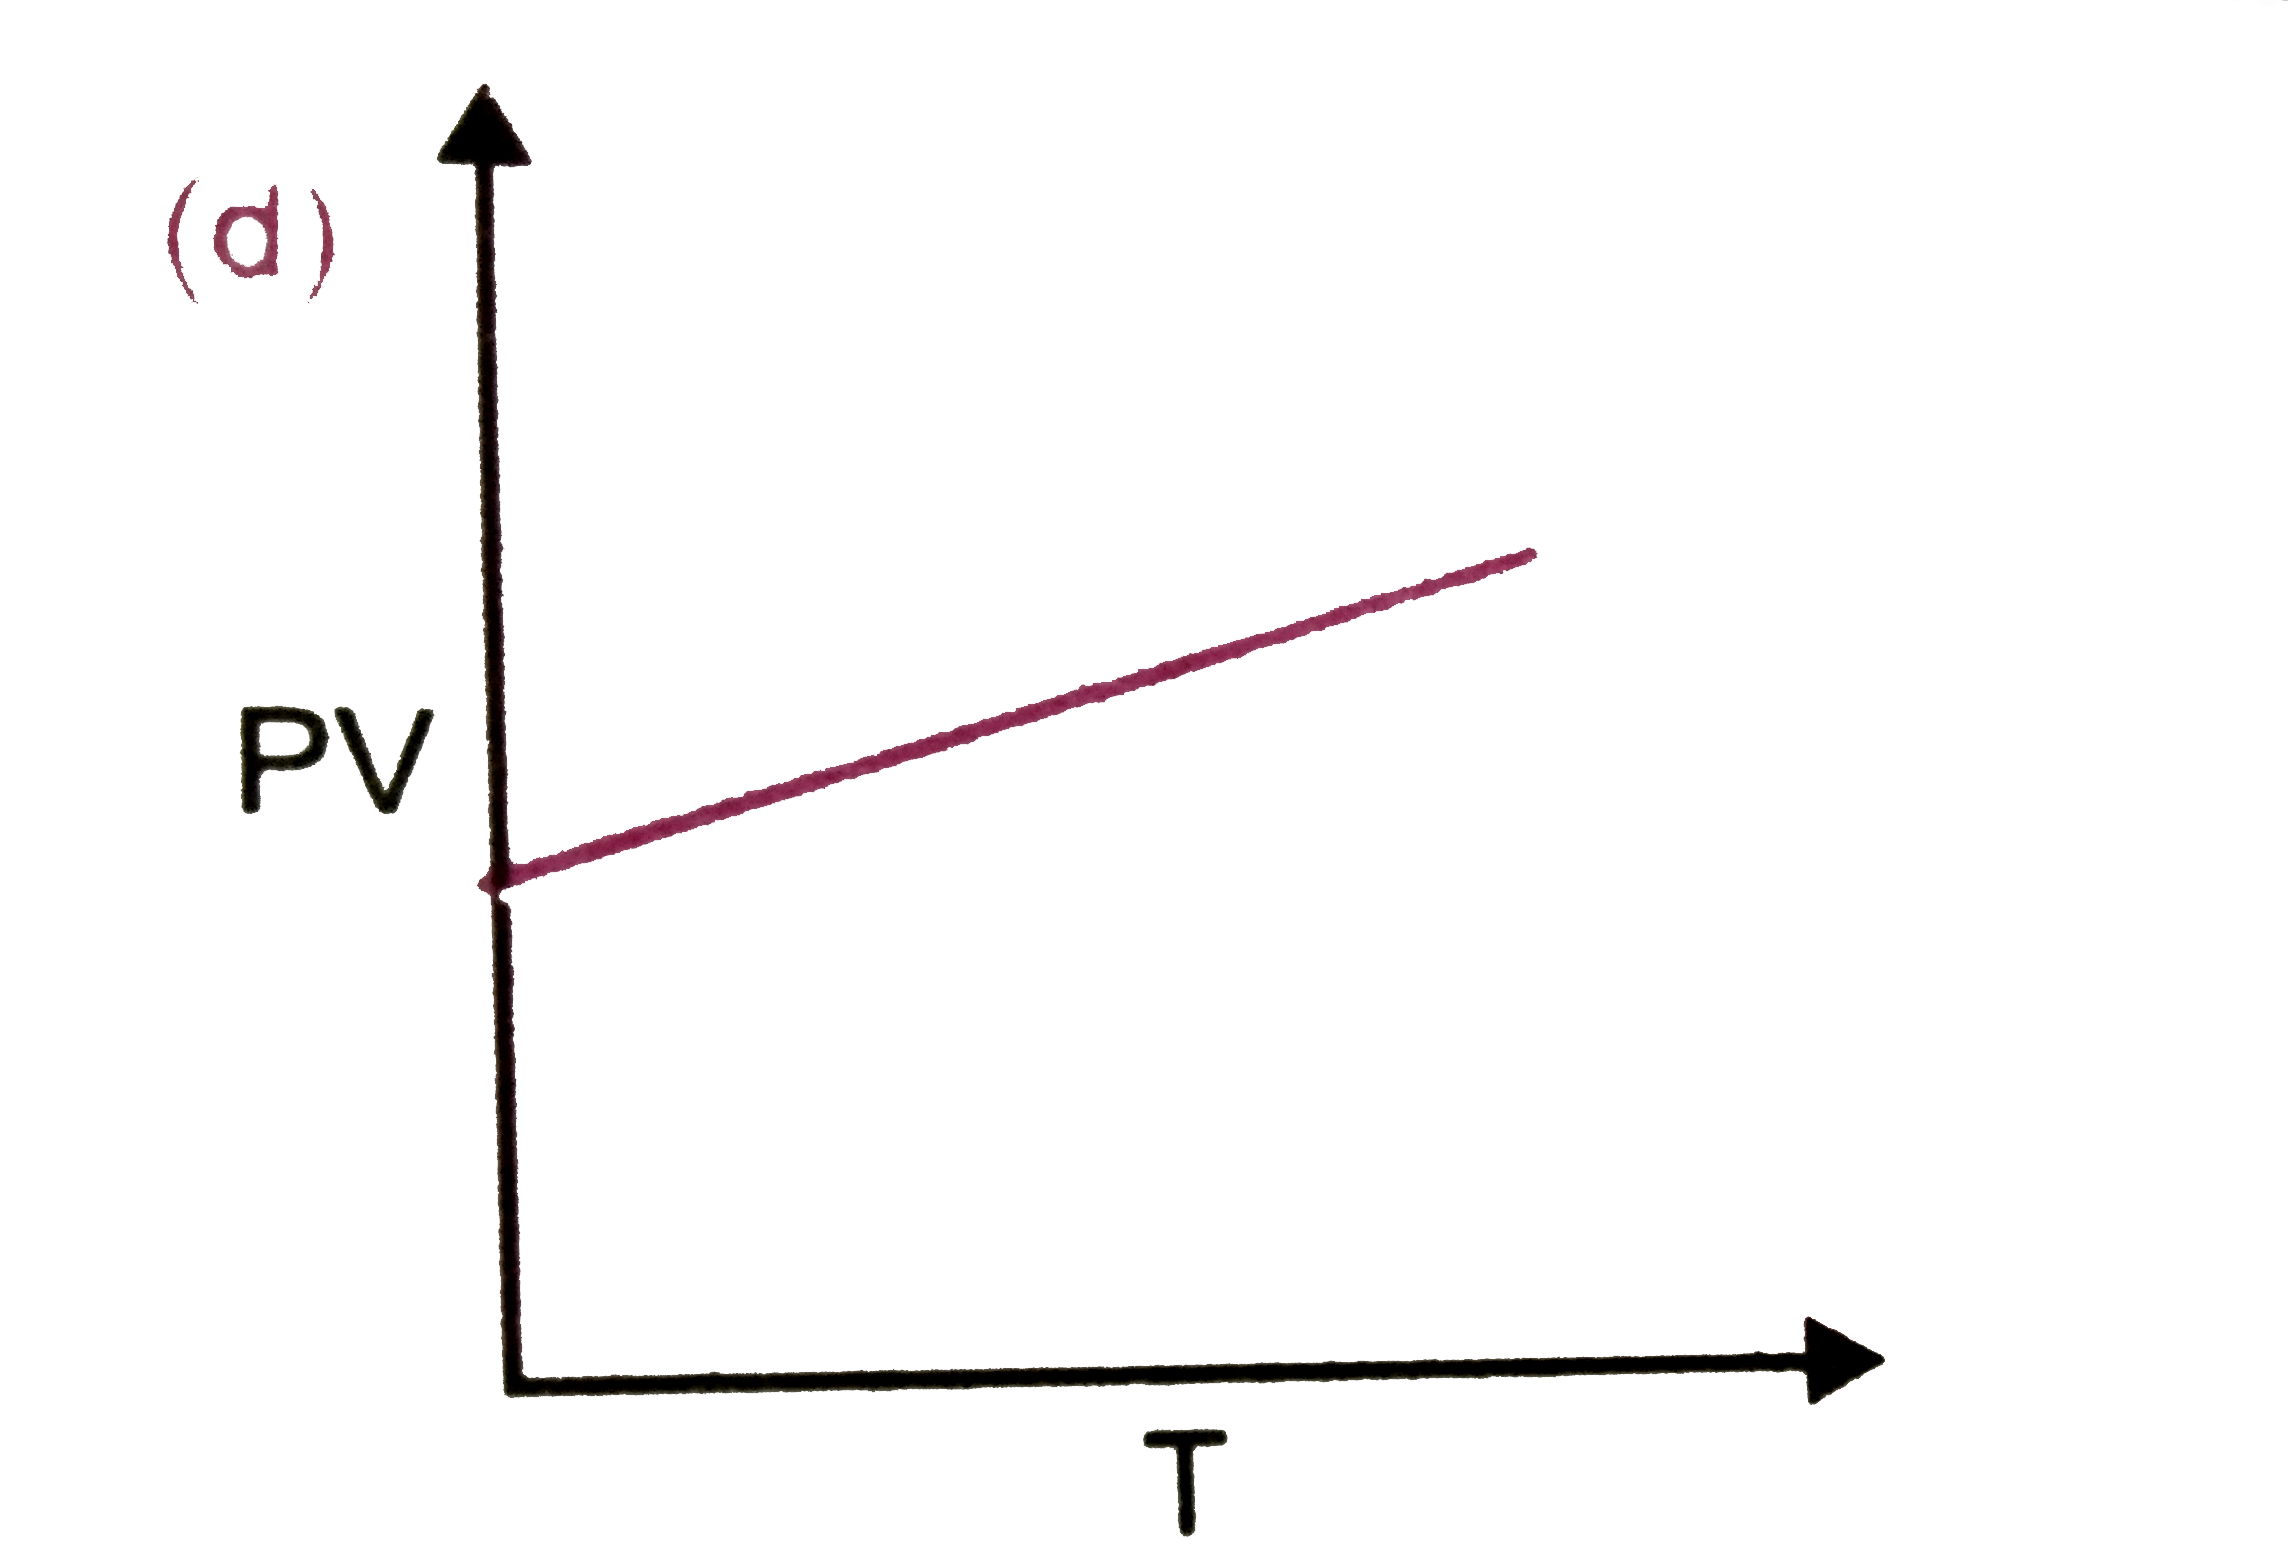
Which of the following plots is/are correctly labelled ?
A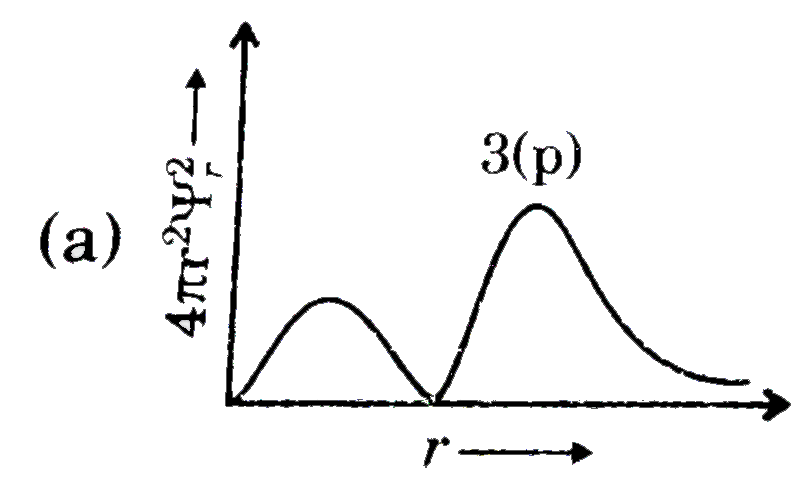 B
B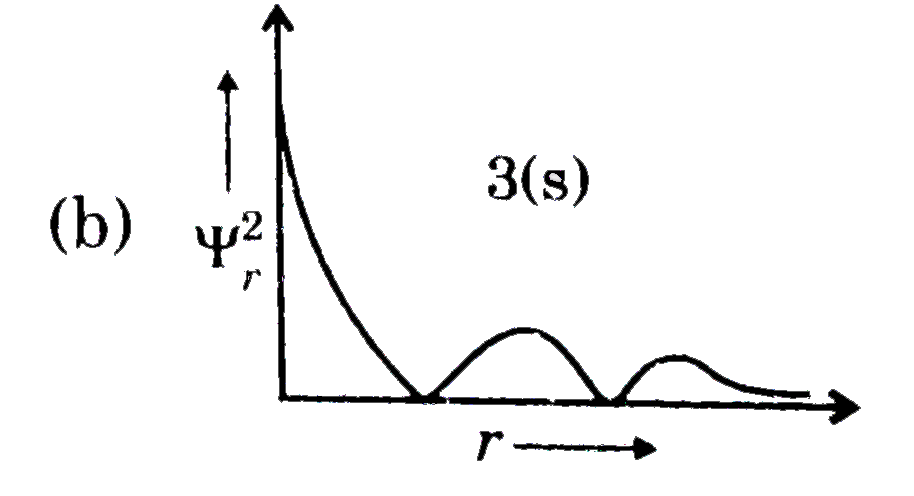 C
C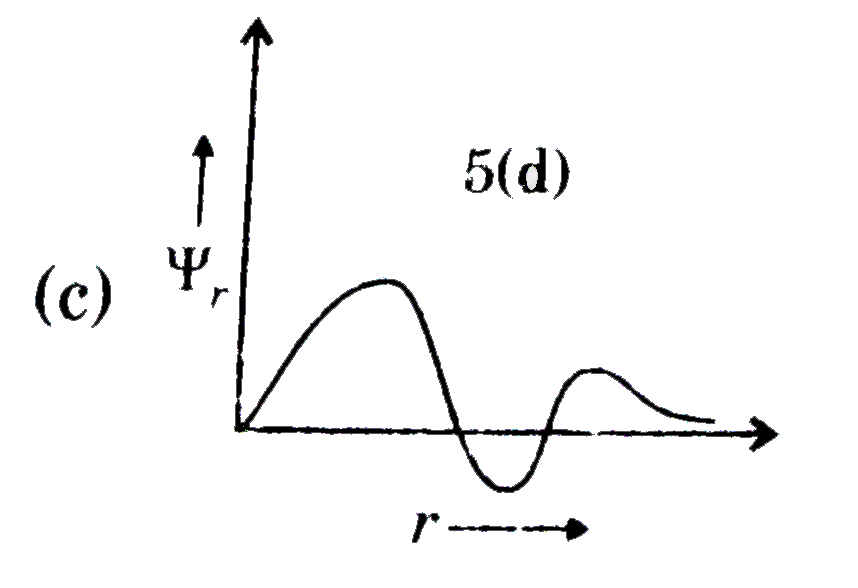 D
D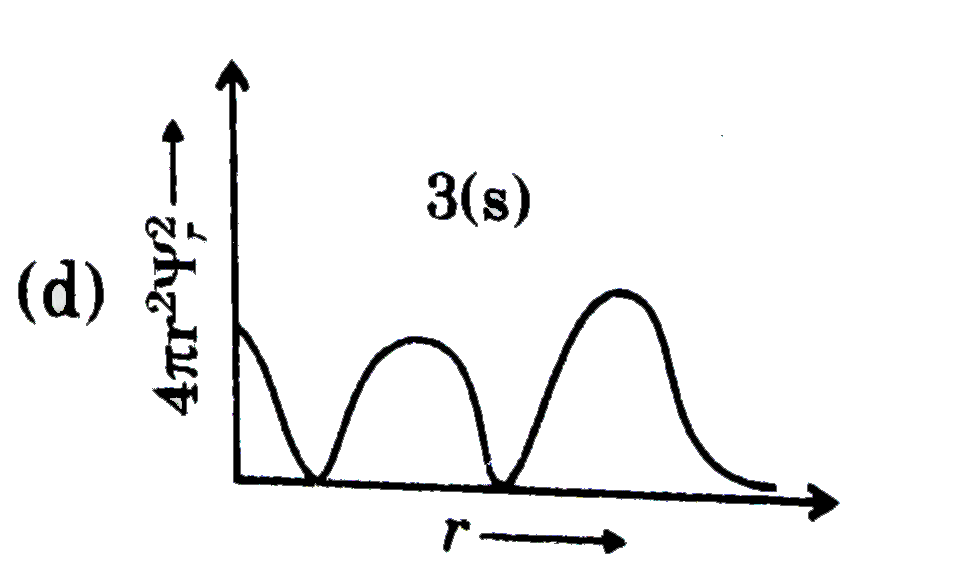
Which of the following plots is/are correct?
View SolutionWhich of the following plots is/are correct?
View SolutionIn the following graph of Maxwell - Boltzmann distribution of molecular velocities . Which of the following is the correct order of temperature ?
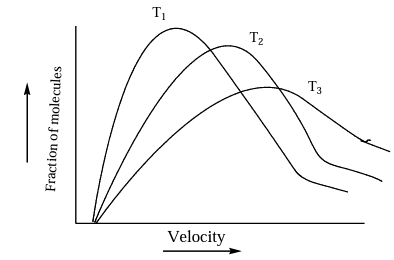
View SolutionIn the following graph of Maxwell - Boltzmann distribution of molecular velocities . Which of the following is the correct order of temperature ?

View SolutionWhich of the following will give linear plots ?
View Solution
