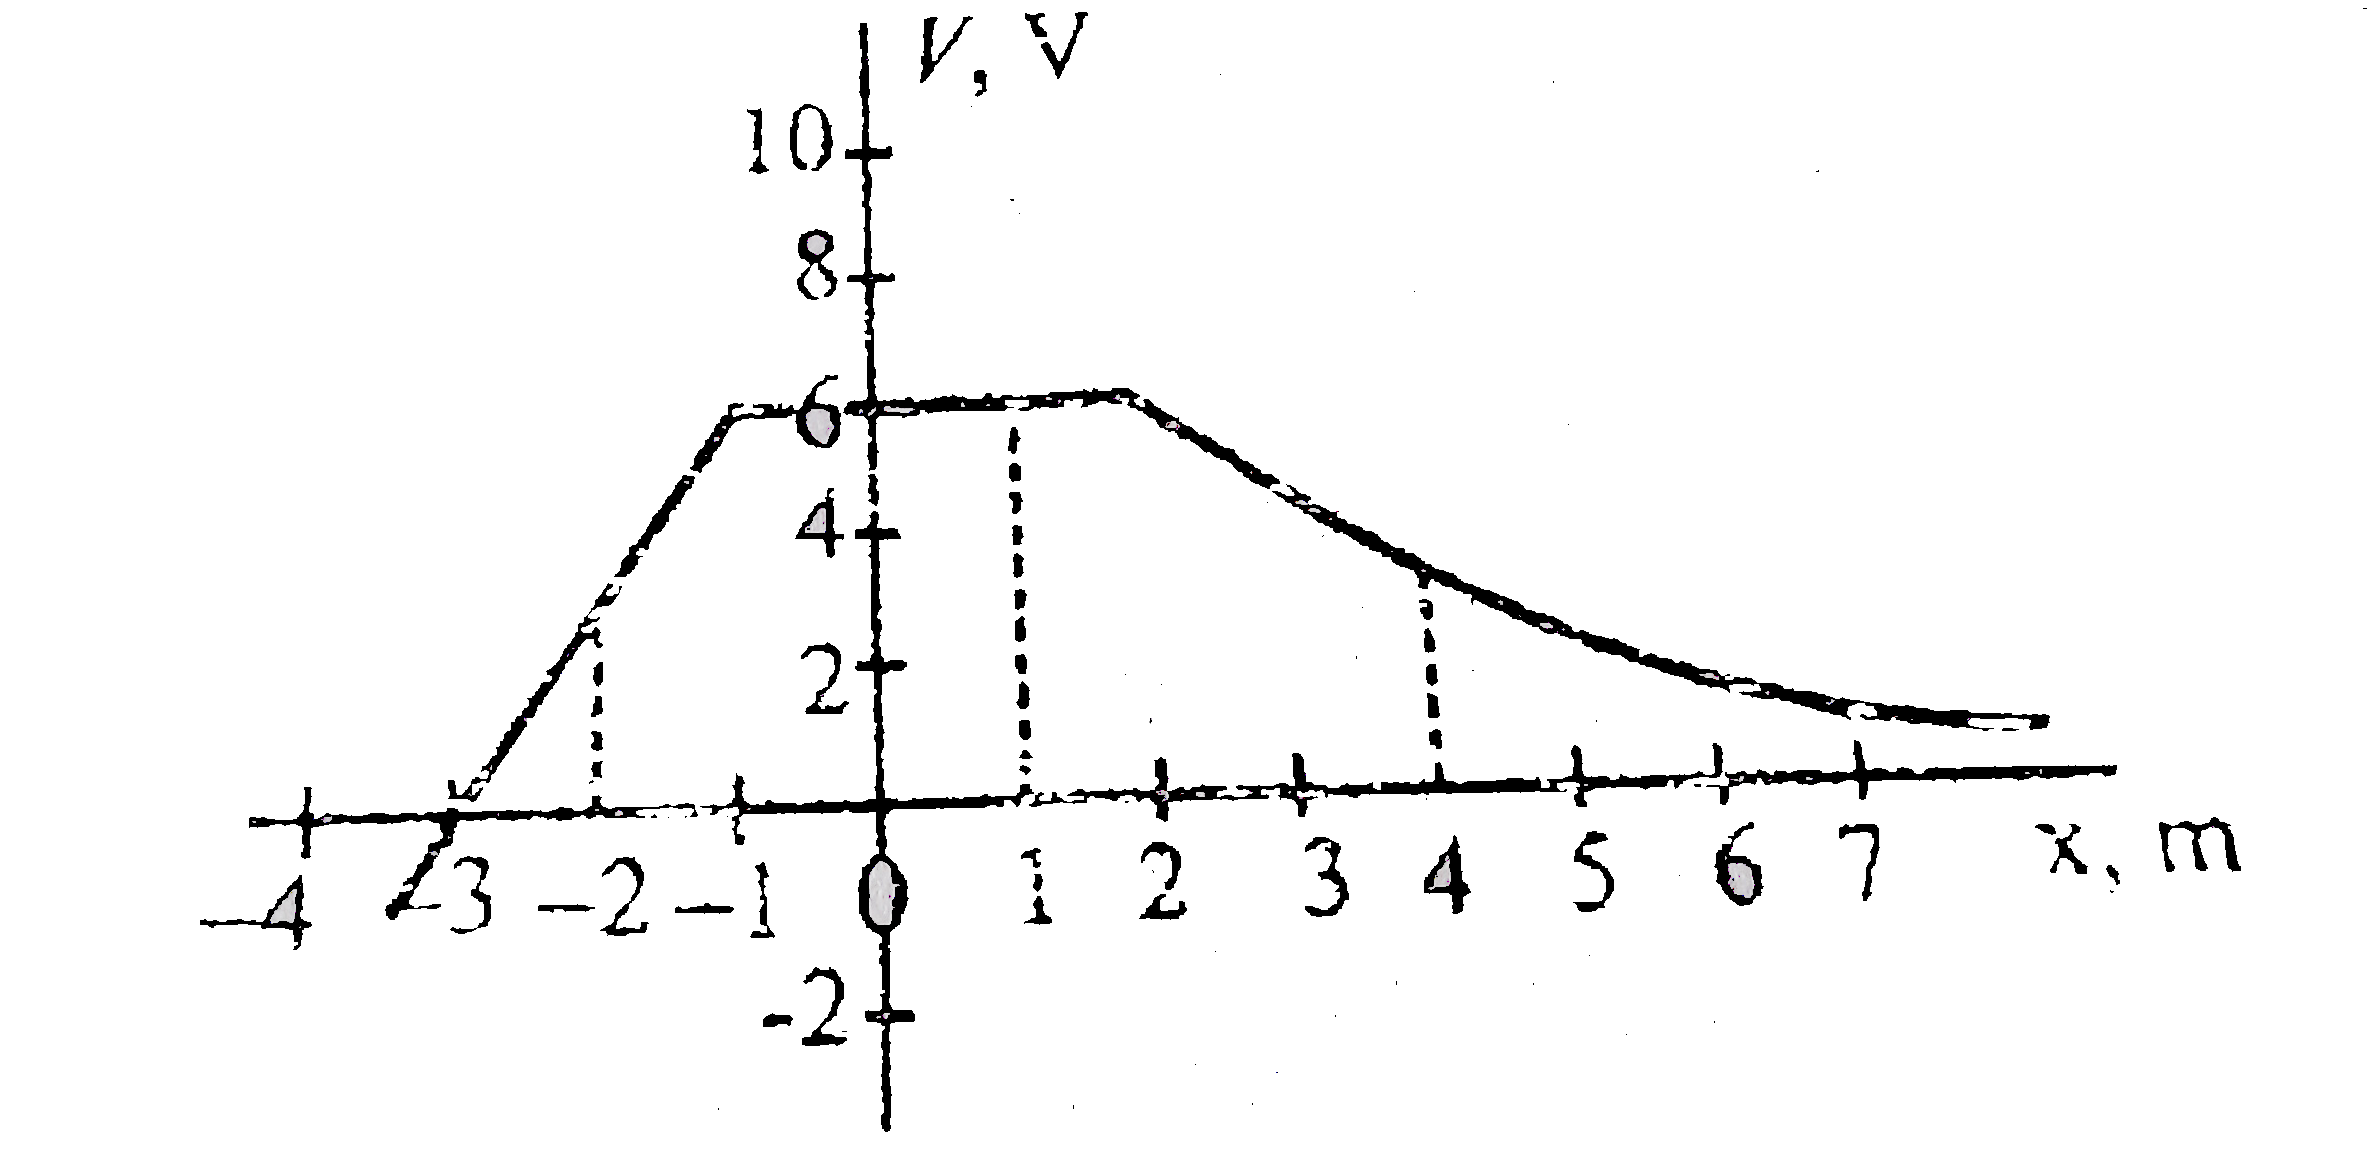
Which of the following plots is/are correct?
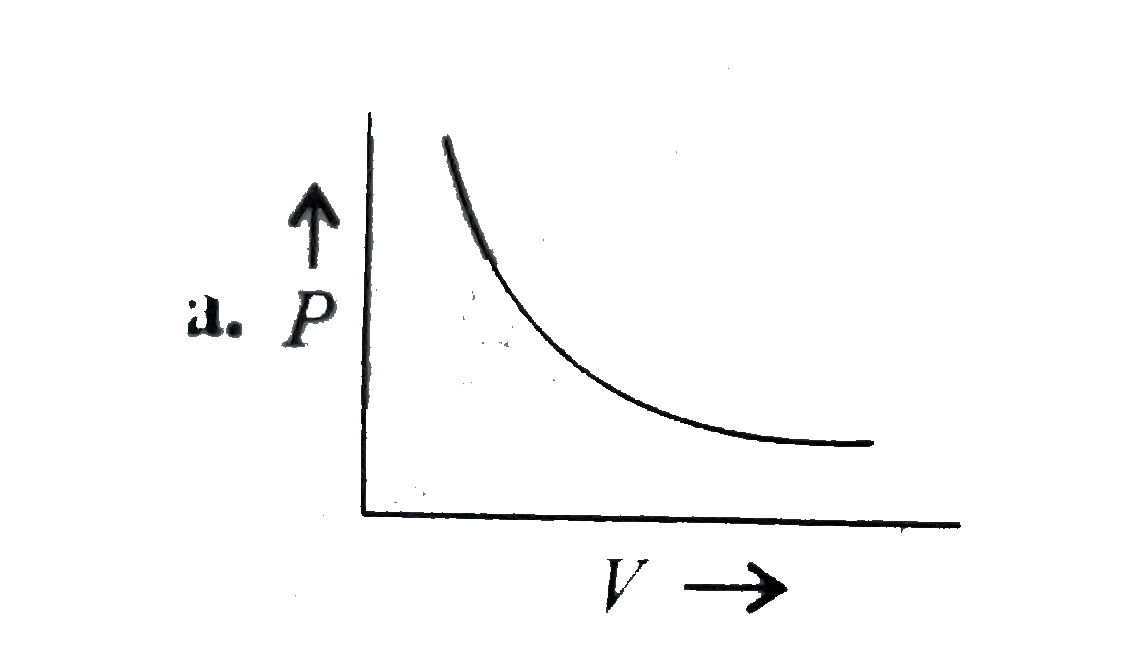
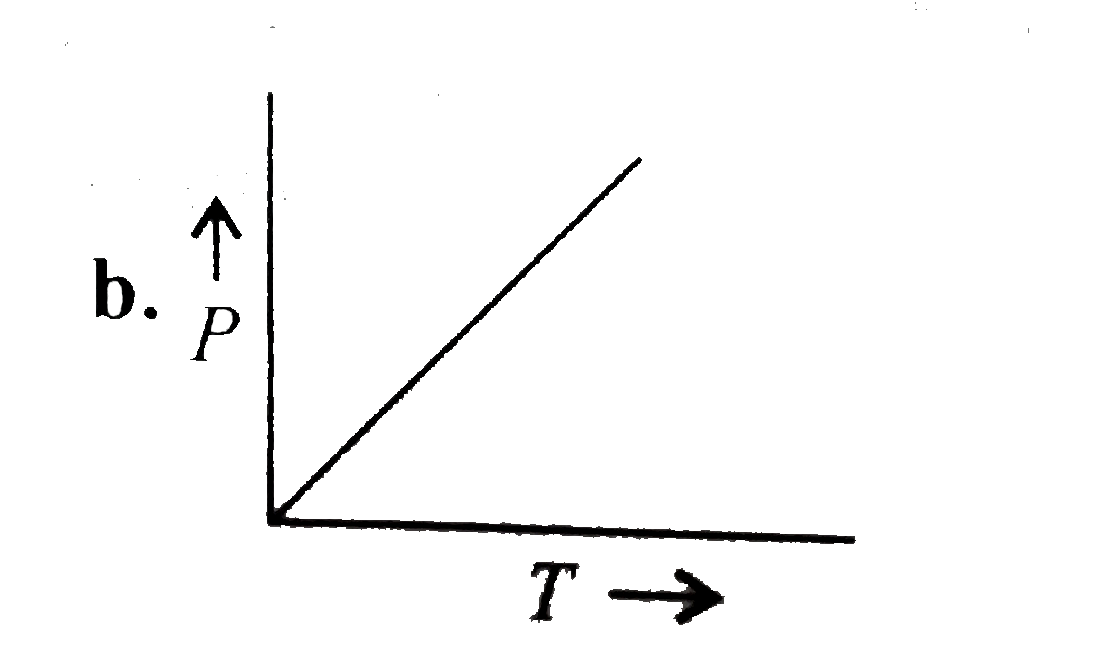
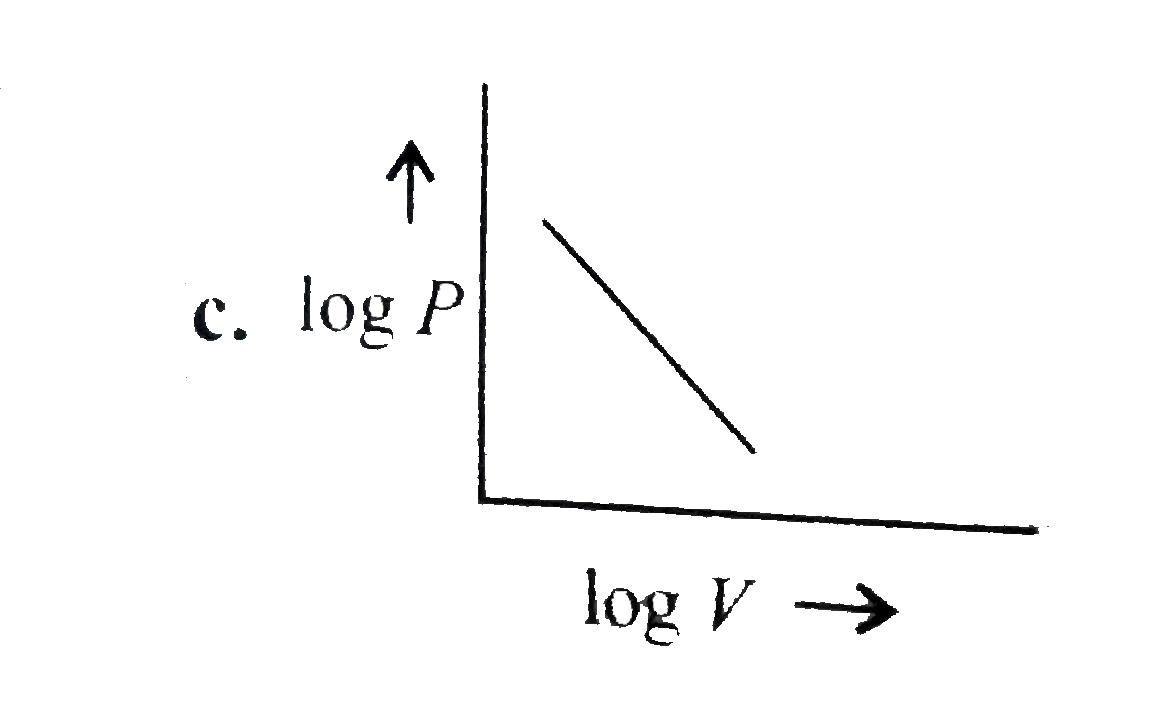
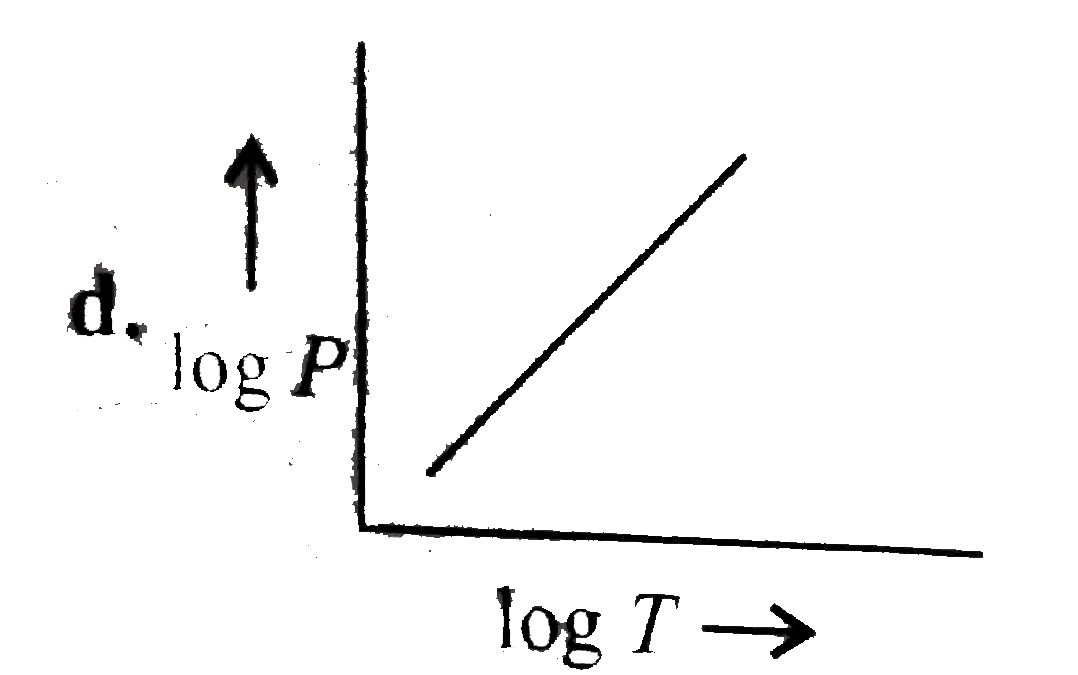
Step by step video & image solution for Which of the following plots is/are correct? by Chemistry experts to help you in doubts & scoring excellent marks in Class 11 exams.
Updated on:21/07/2023Topper's Solved these Questions
- STATES OF MATTERBOOK - CENGAGE CHEMISTRYCHAPTER - STATES OF MATTEREXERCISE - Exercises (Single Correct)
85 Videos
- STATES OF MATTERBOOK - CENGAGE CHEMISTRYCHAPTER - STATES OF MATTEREXERCISE - Exercises (Assertion-Reasoning)
24 Videos
- STATES OF MATTERBOOK - CENGAGE CHEMISTRYCHAPTER - STATES OF MATTEREXERCISE - Exercises (Linked Comprehensive)
48 Videos
- SOME BASIC CONCEPTS AND MOLE CONCEPTBOOK - CENGAGE CHEMISTRYCHAPTER - SOME BASIC CONCEPTS AND MOLE CONCEPTEXERCISE - Archives Subjective
11 Videos
- STOICHIOMETRYBOOK - CENGAGE CHEMISTRYCHAPTER - STOICHIOMETRYEXERCISE - Archives Subjective
33 Videos
Similar Questions
Knowledge Check
Show below are the black body radiation curves at temperature T1 and T2(T2>T1). Which of the following plots is correct?
A B
B C
C D
D
Shown below are the black body radiation curves at temperature T1 and T2(T2>T1). Which of the following plots is correct?
A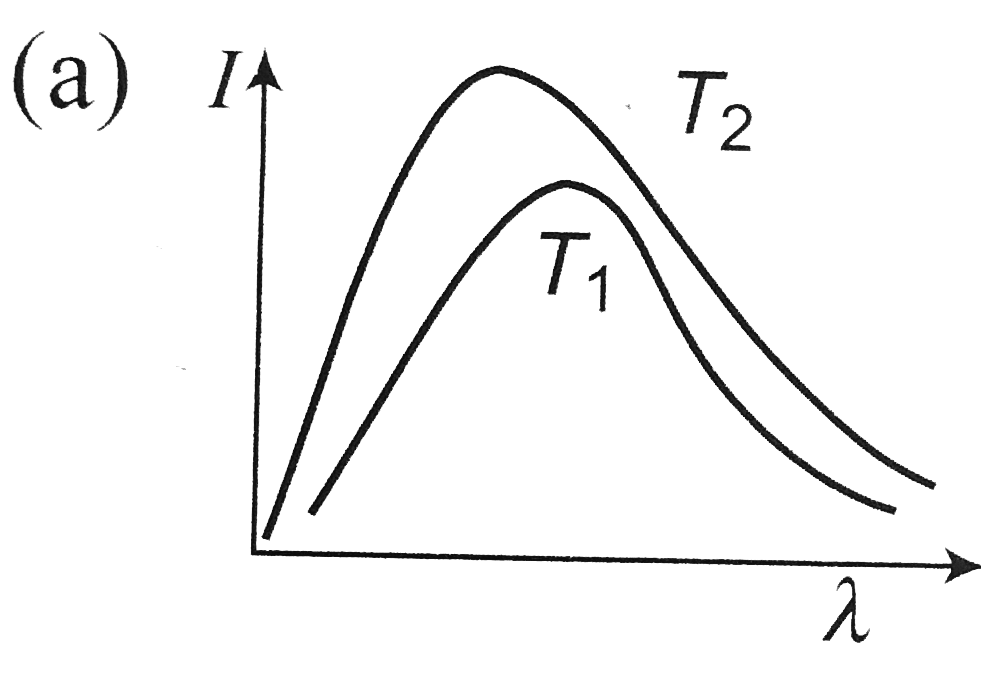 B
B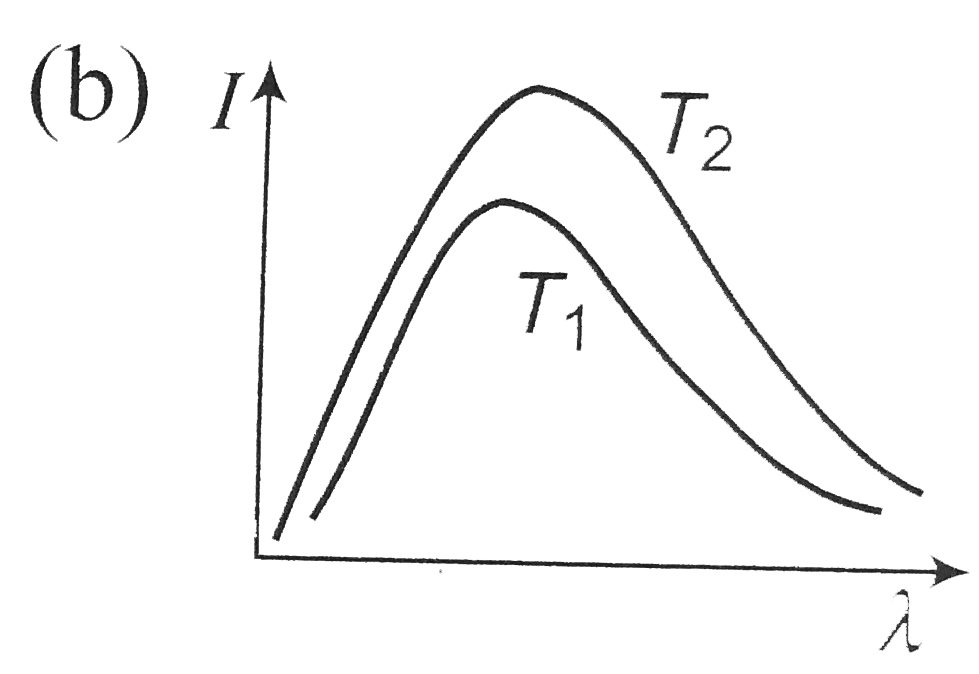 C
C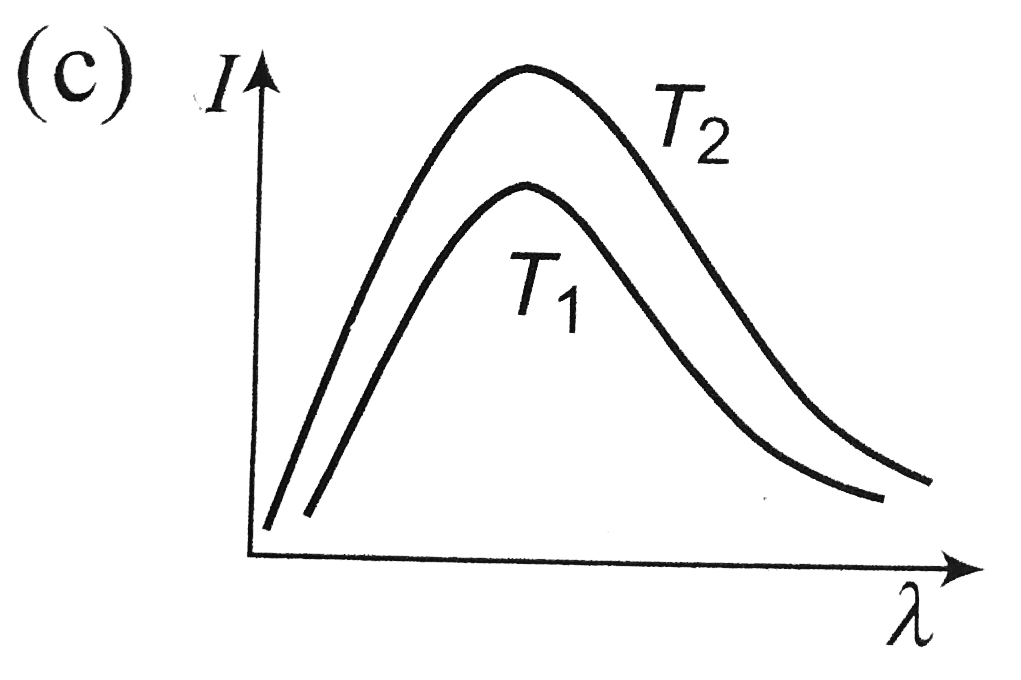 D
D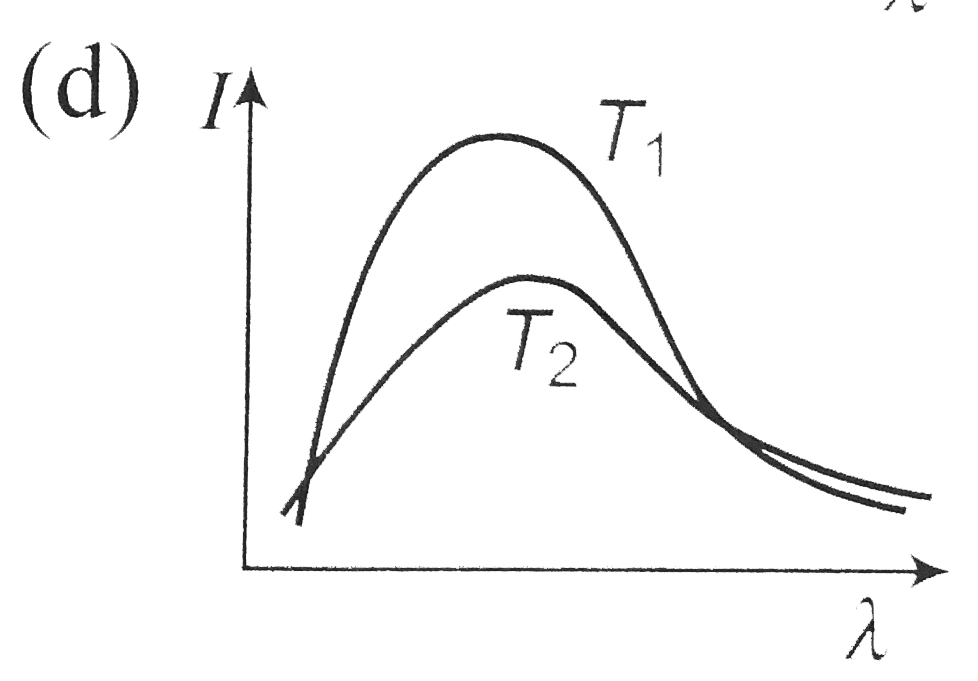
Which of the following plots are correct ?
A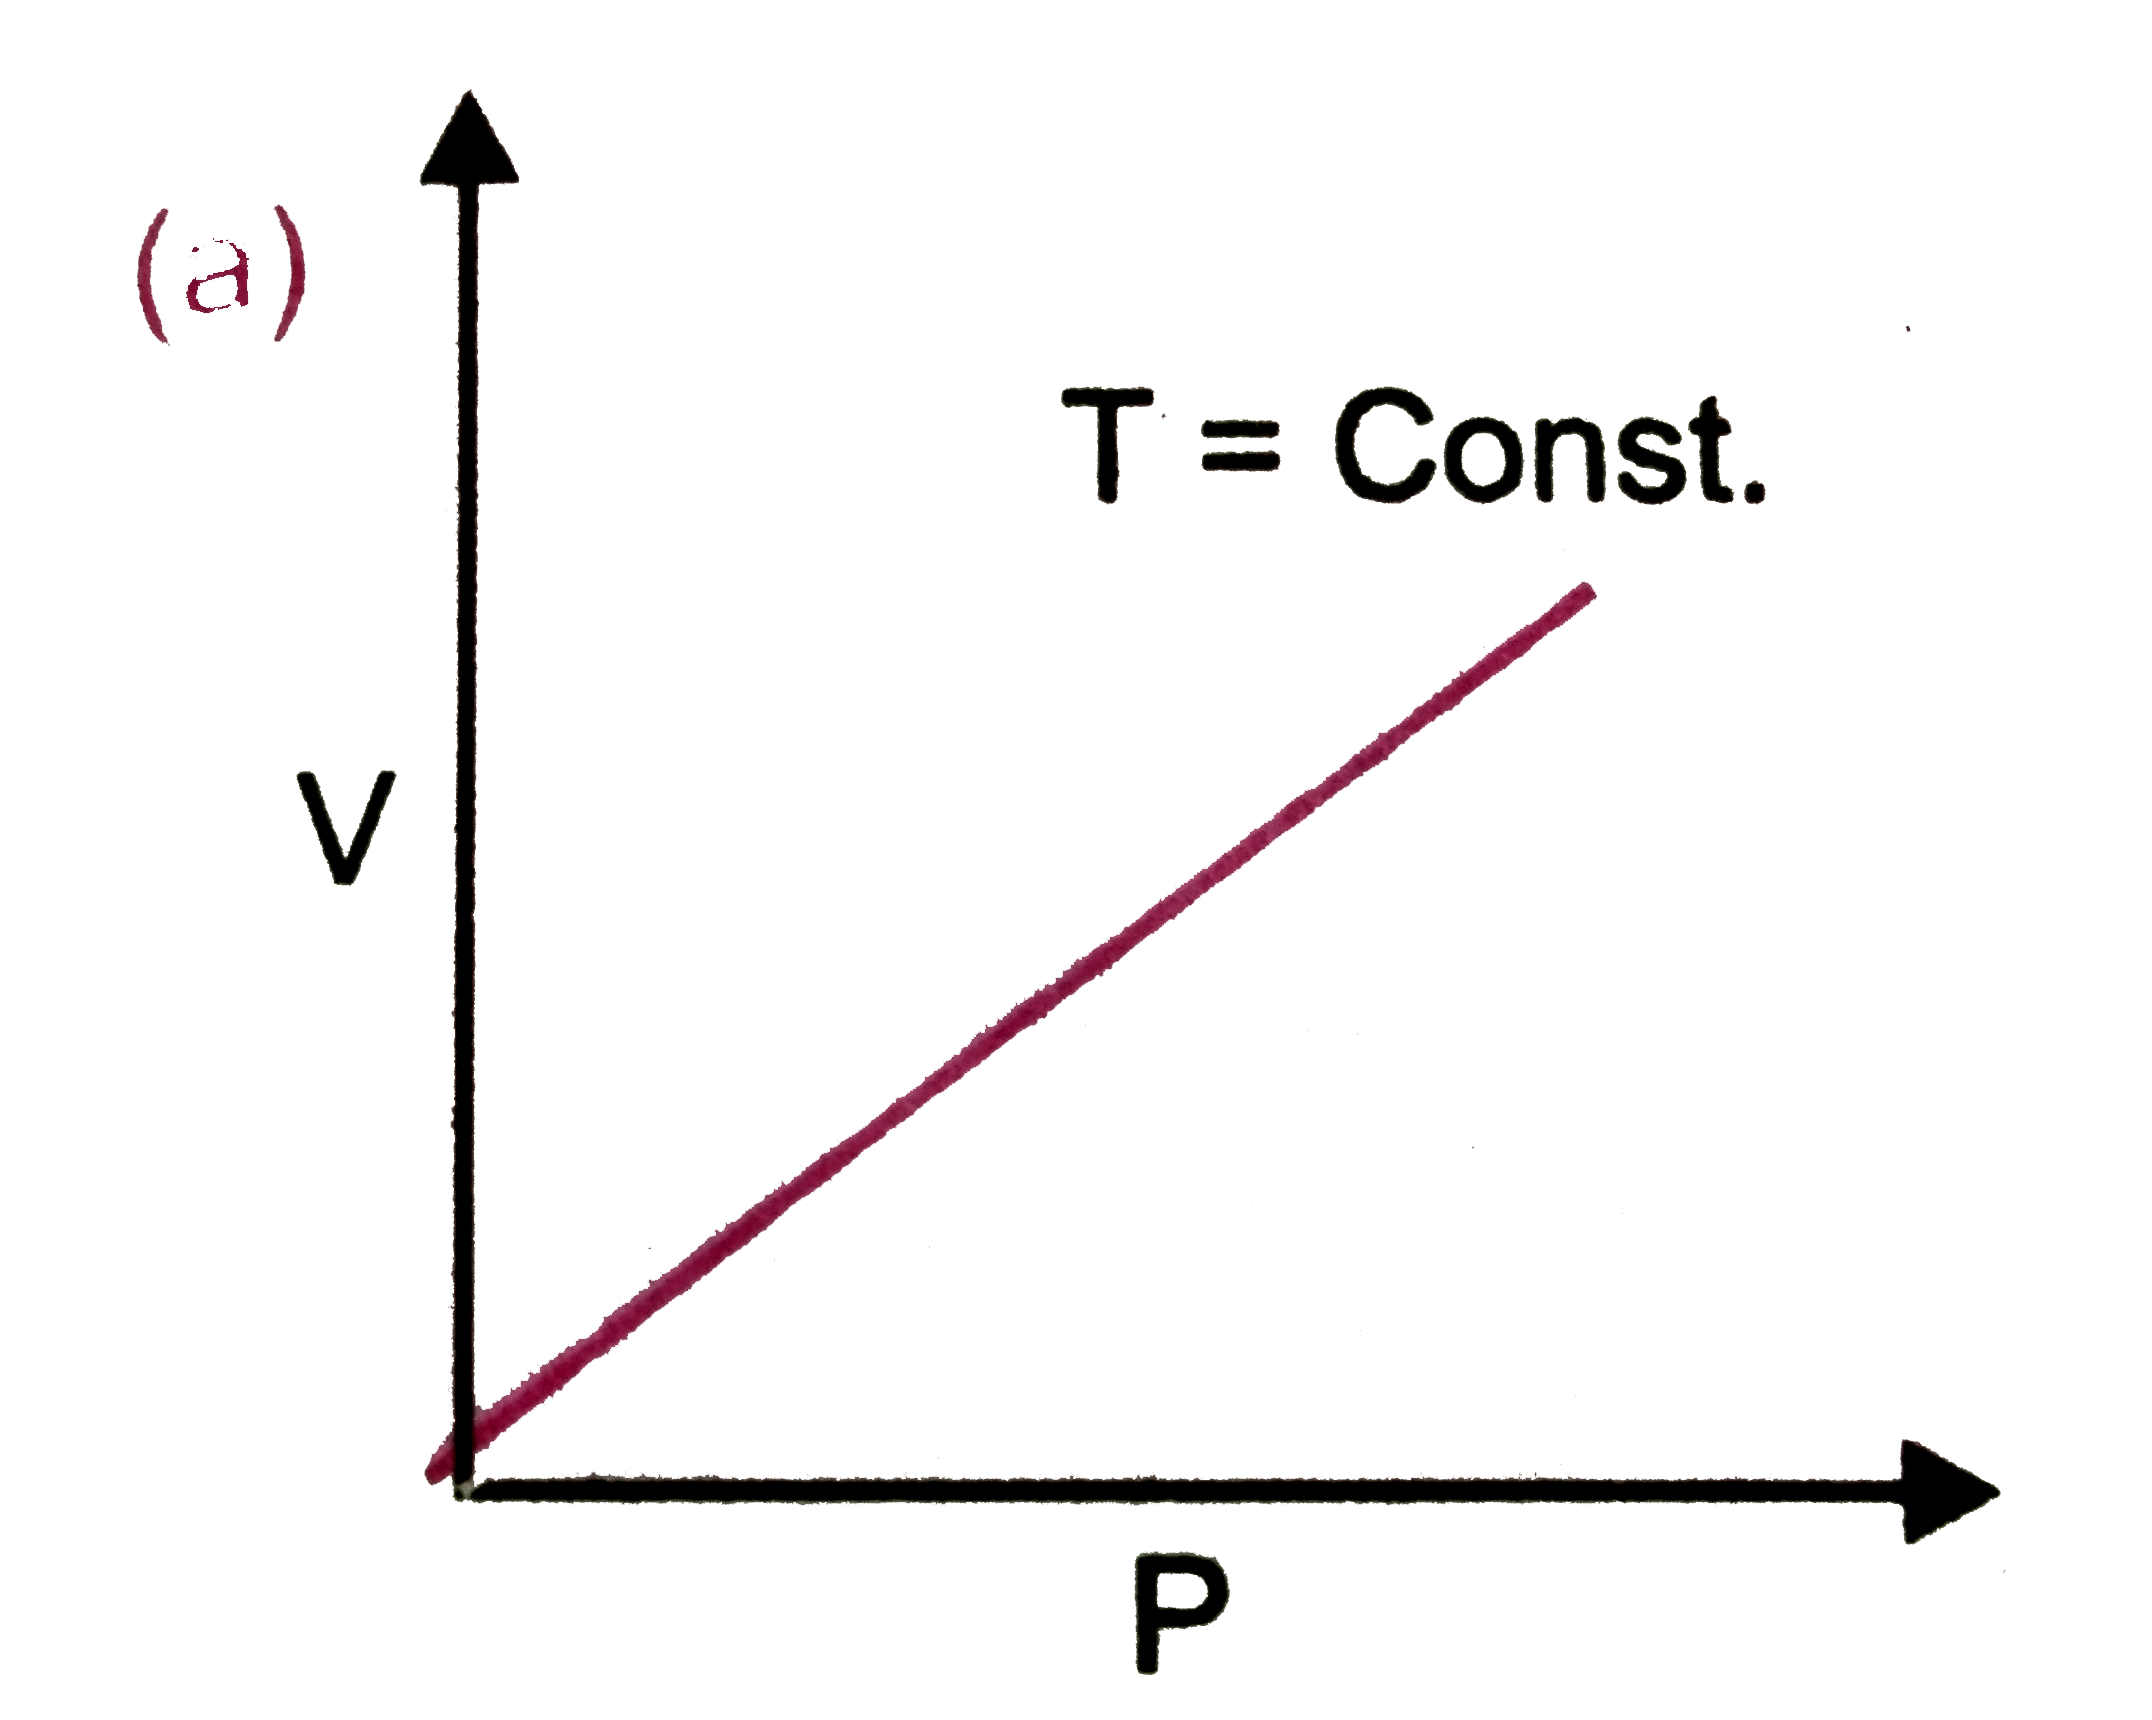 B
B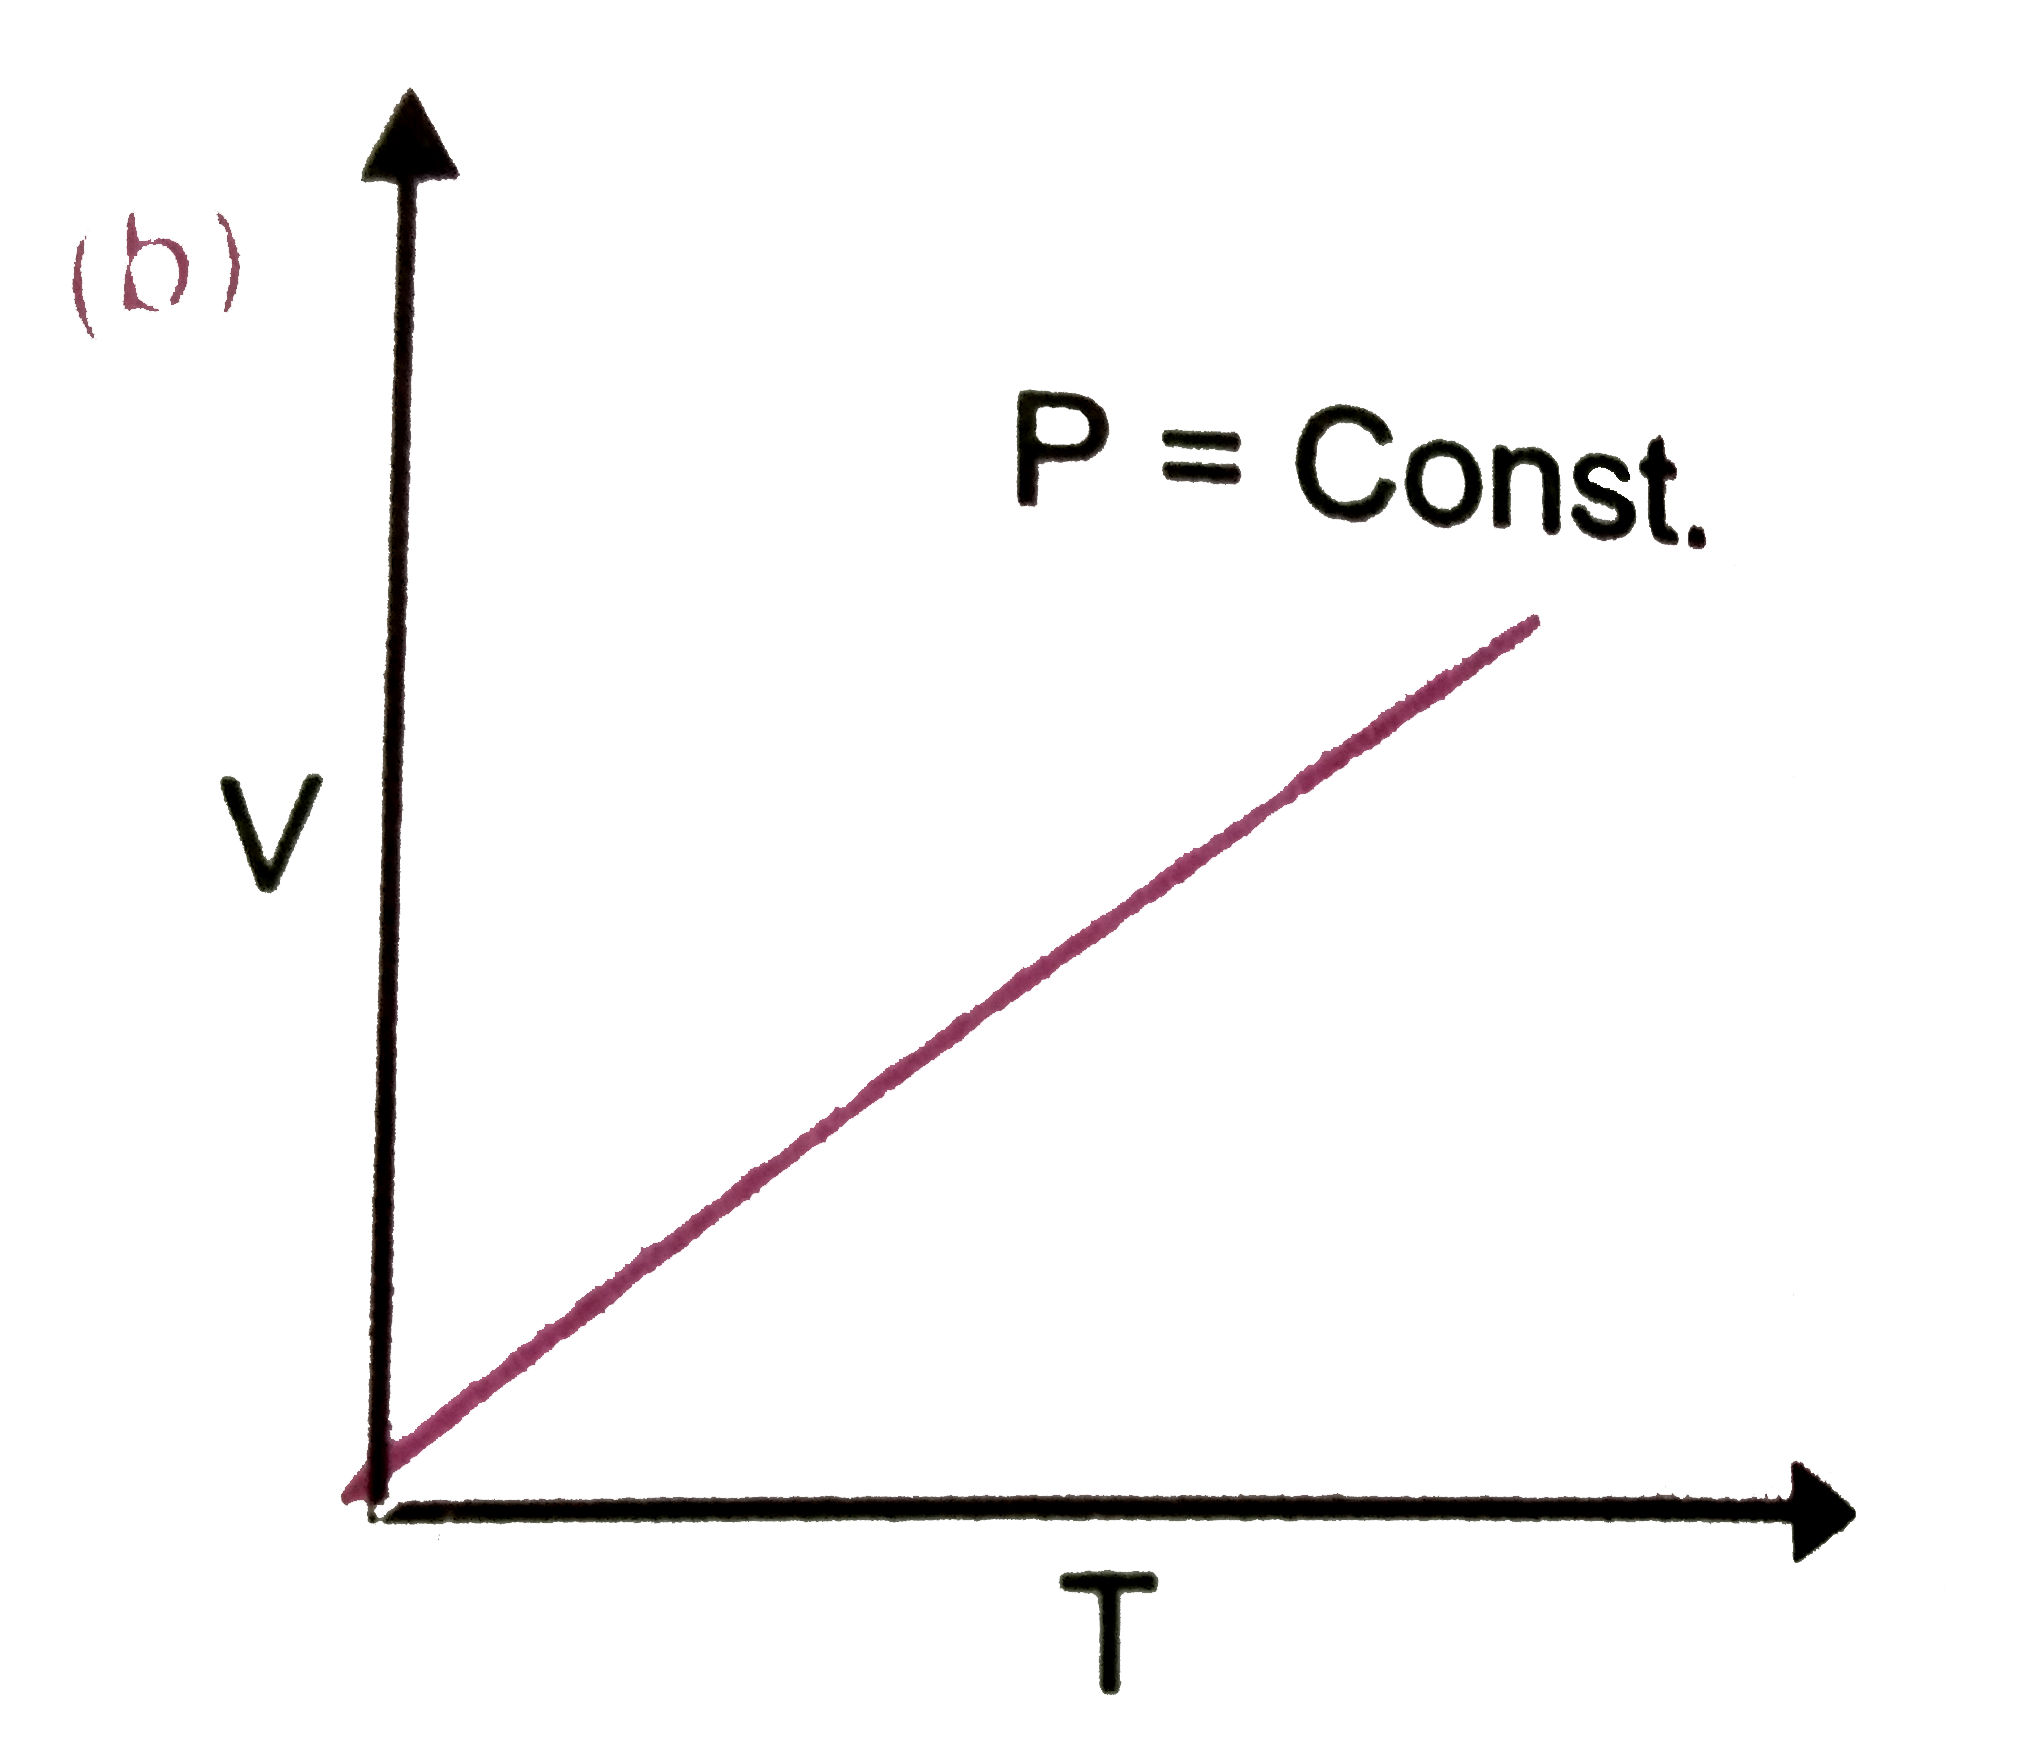 C
C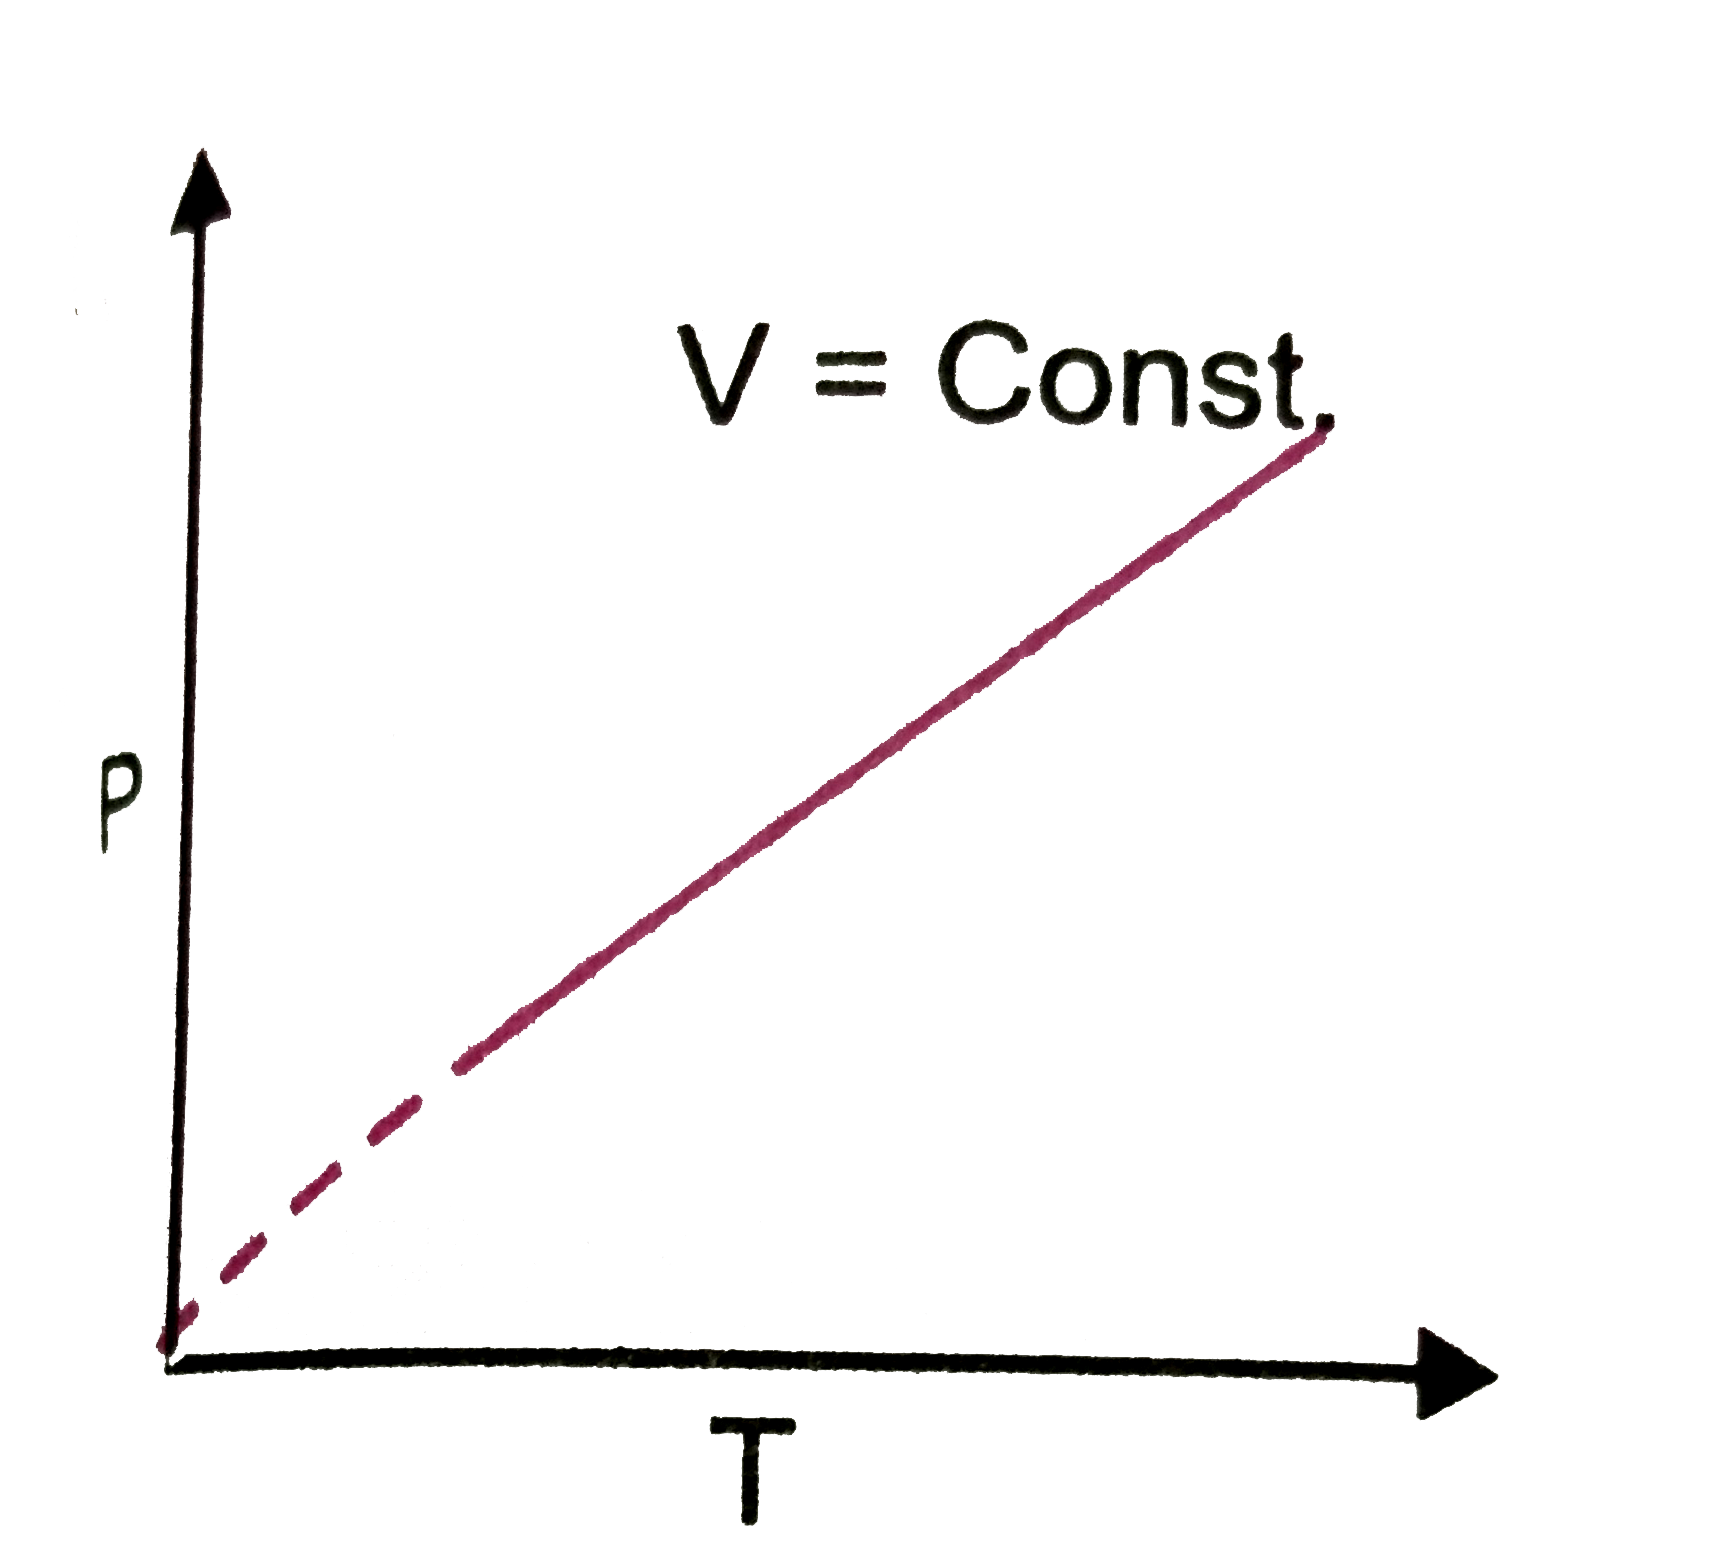 D
D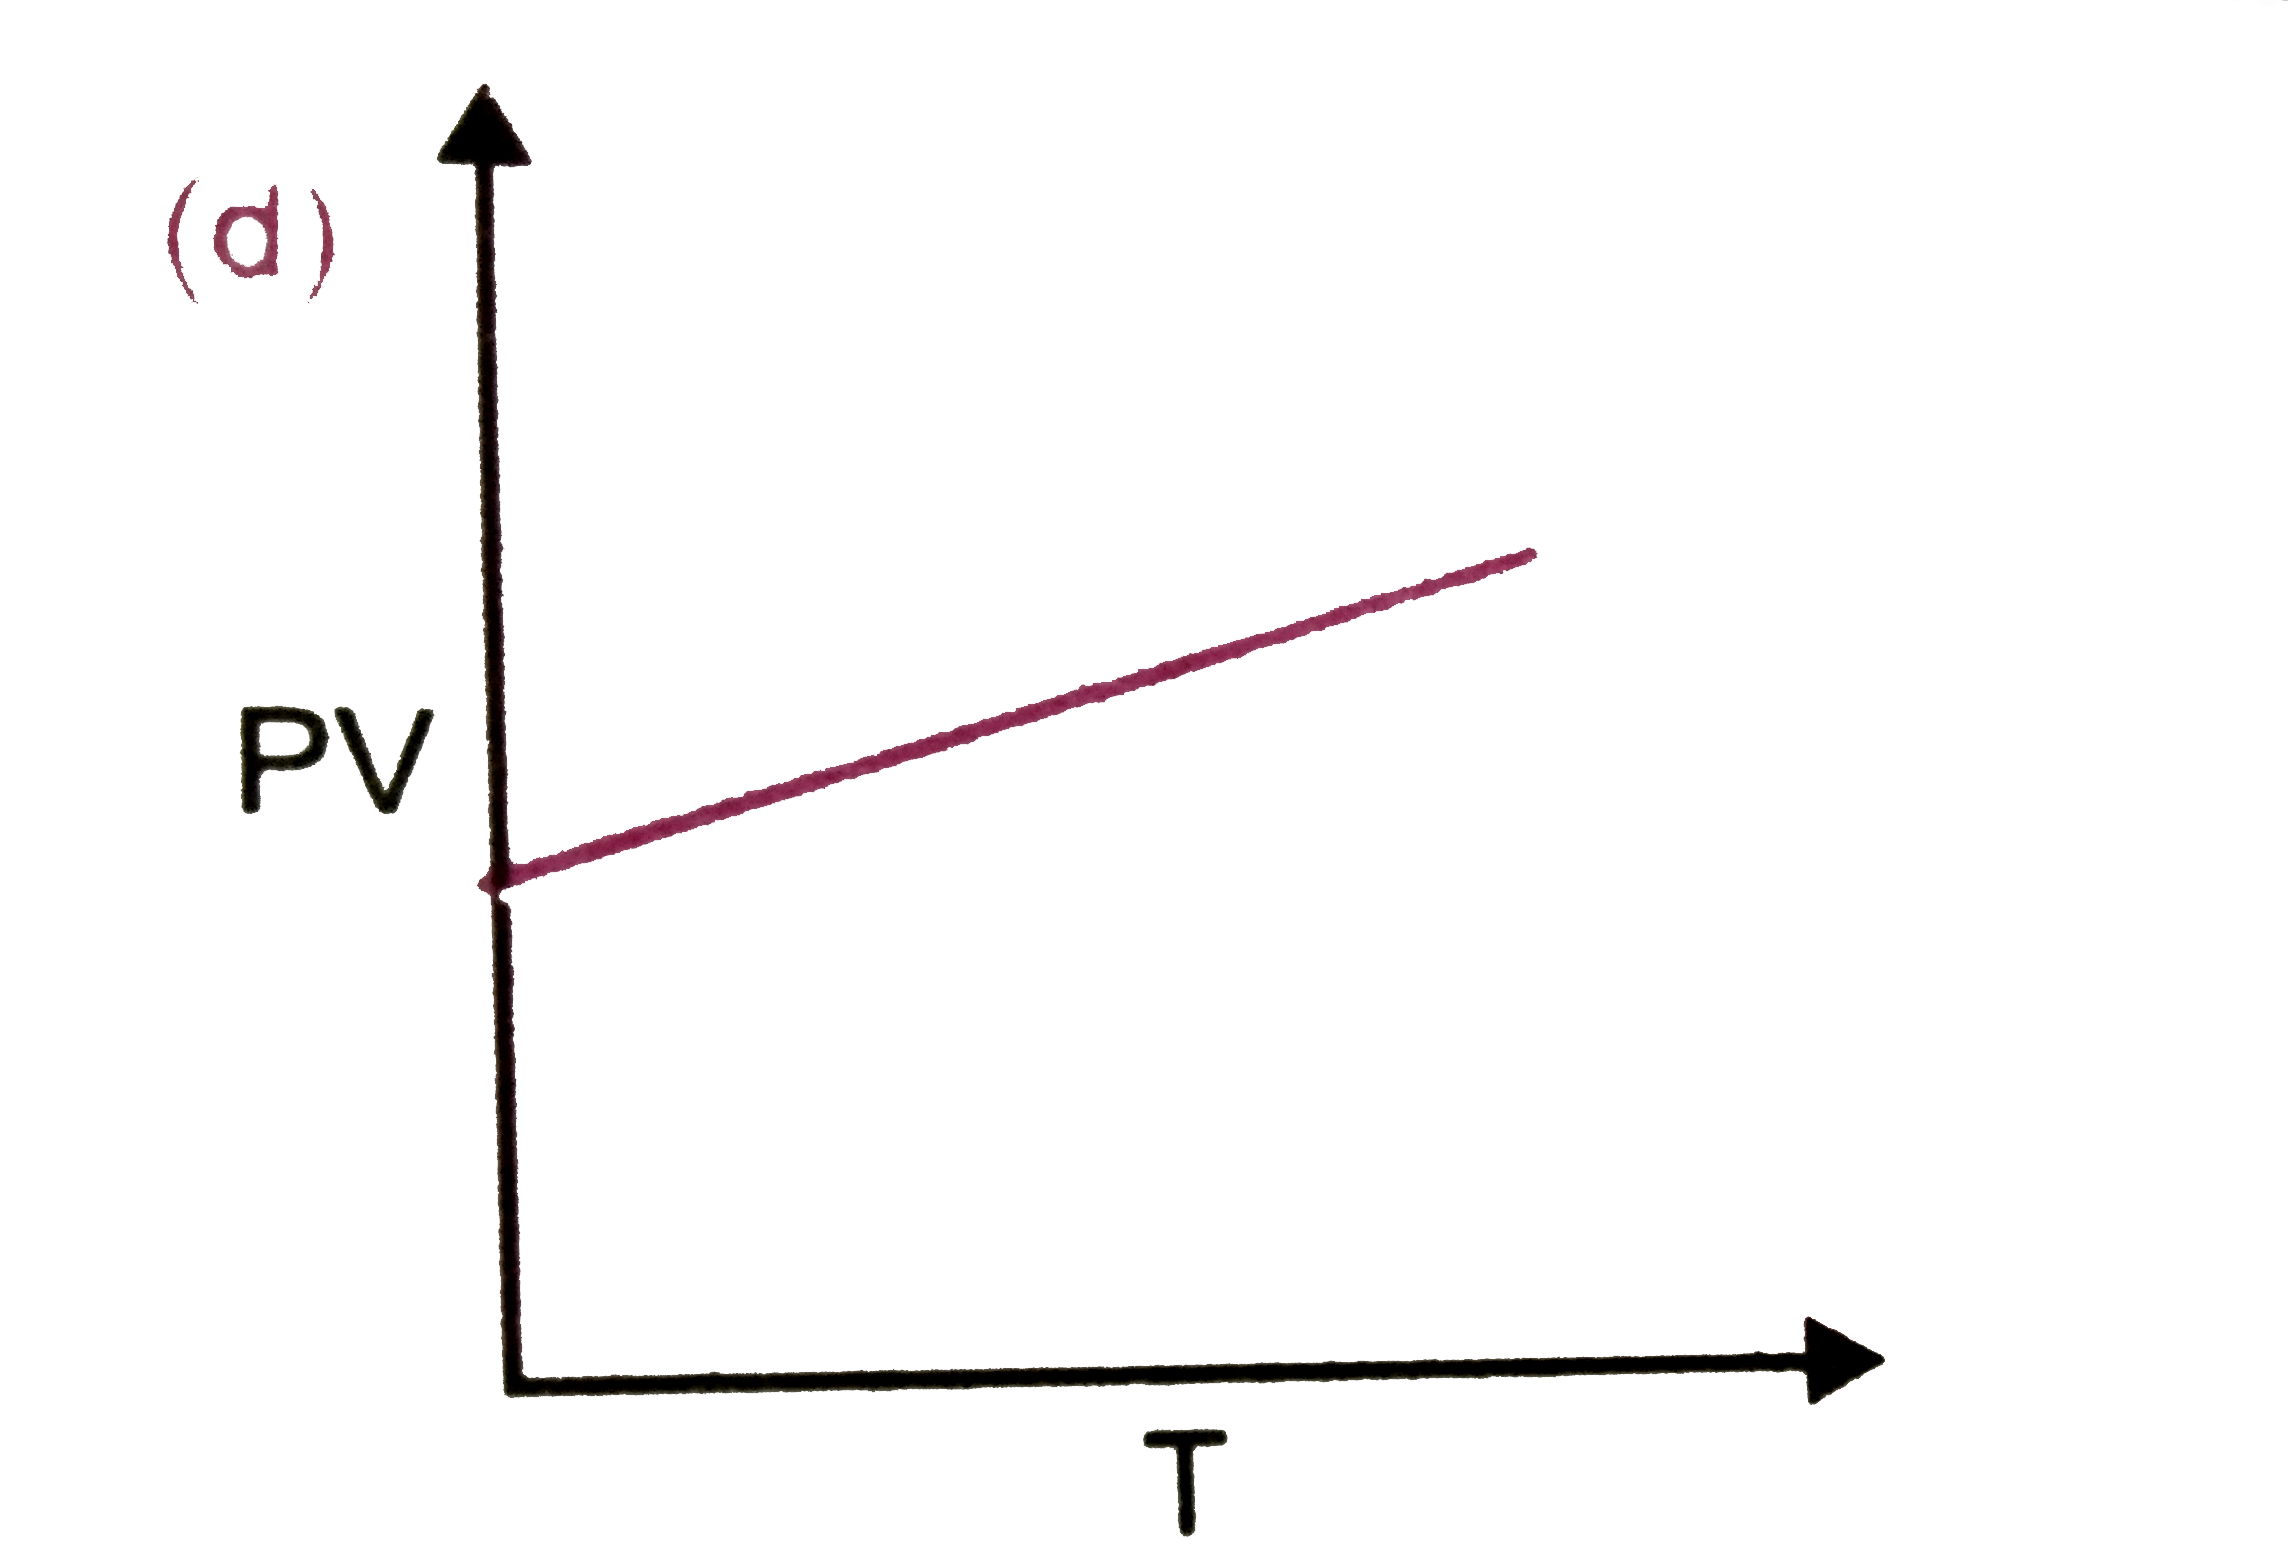
Which of the following plots are correct for an ideal gas ?
View SolutionWhich of the following plots are correct for potential energy of butane as a function about C2−C3 bond ?
View SolutionThe mass of argon adsorbed per unit mass of carbon surface is plotted against pressure. Which of the following plots is correct if x and m represent the masses of argon and carbon respectively ? (………. Represents extrapolated data)
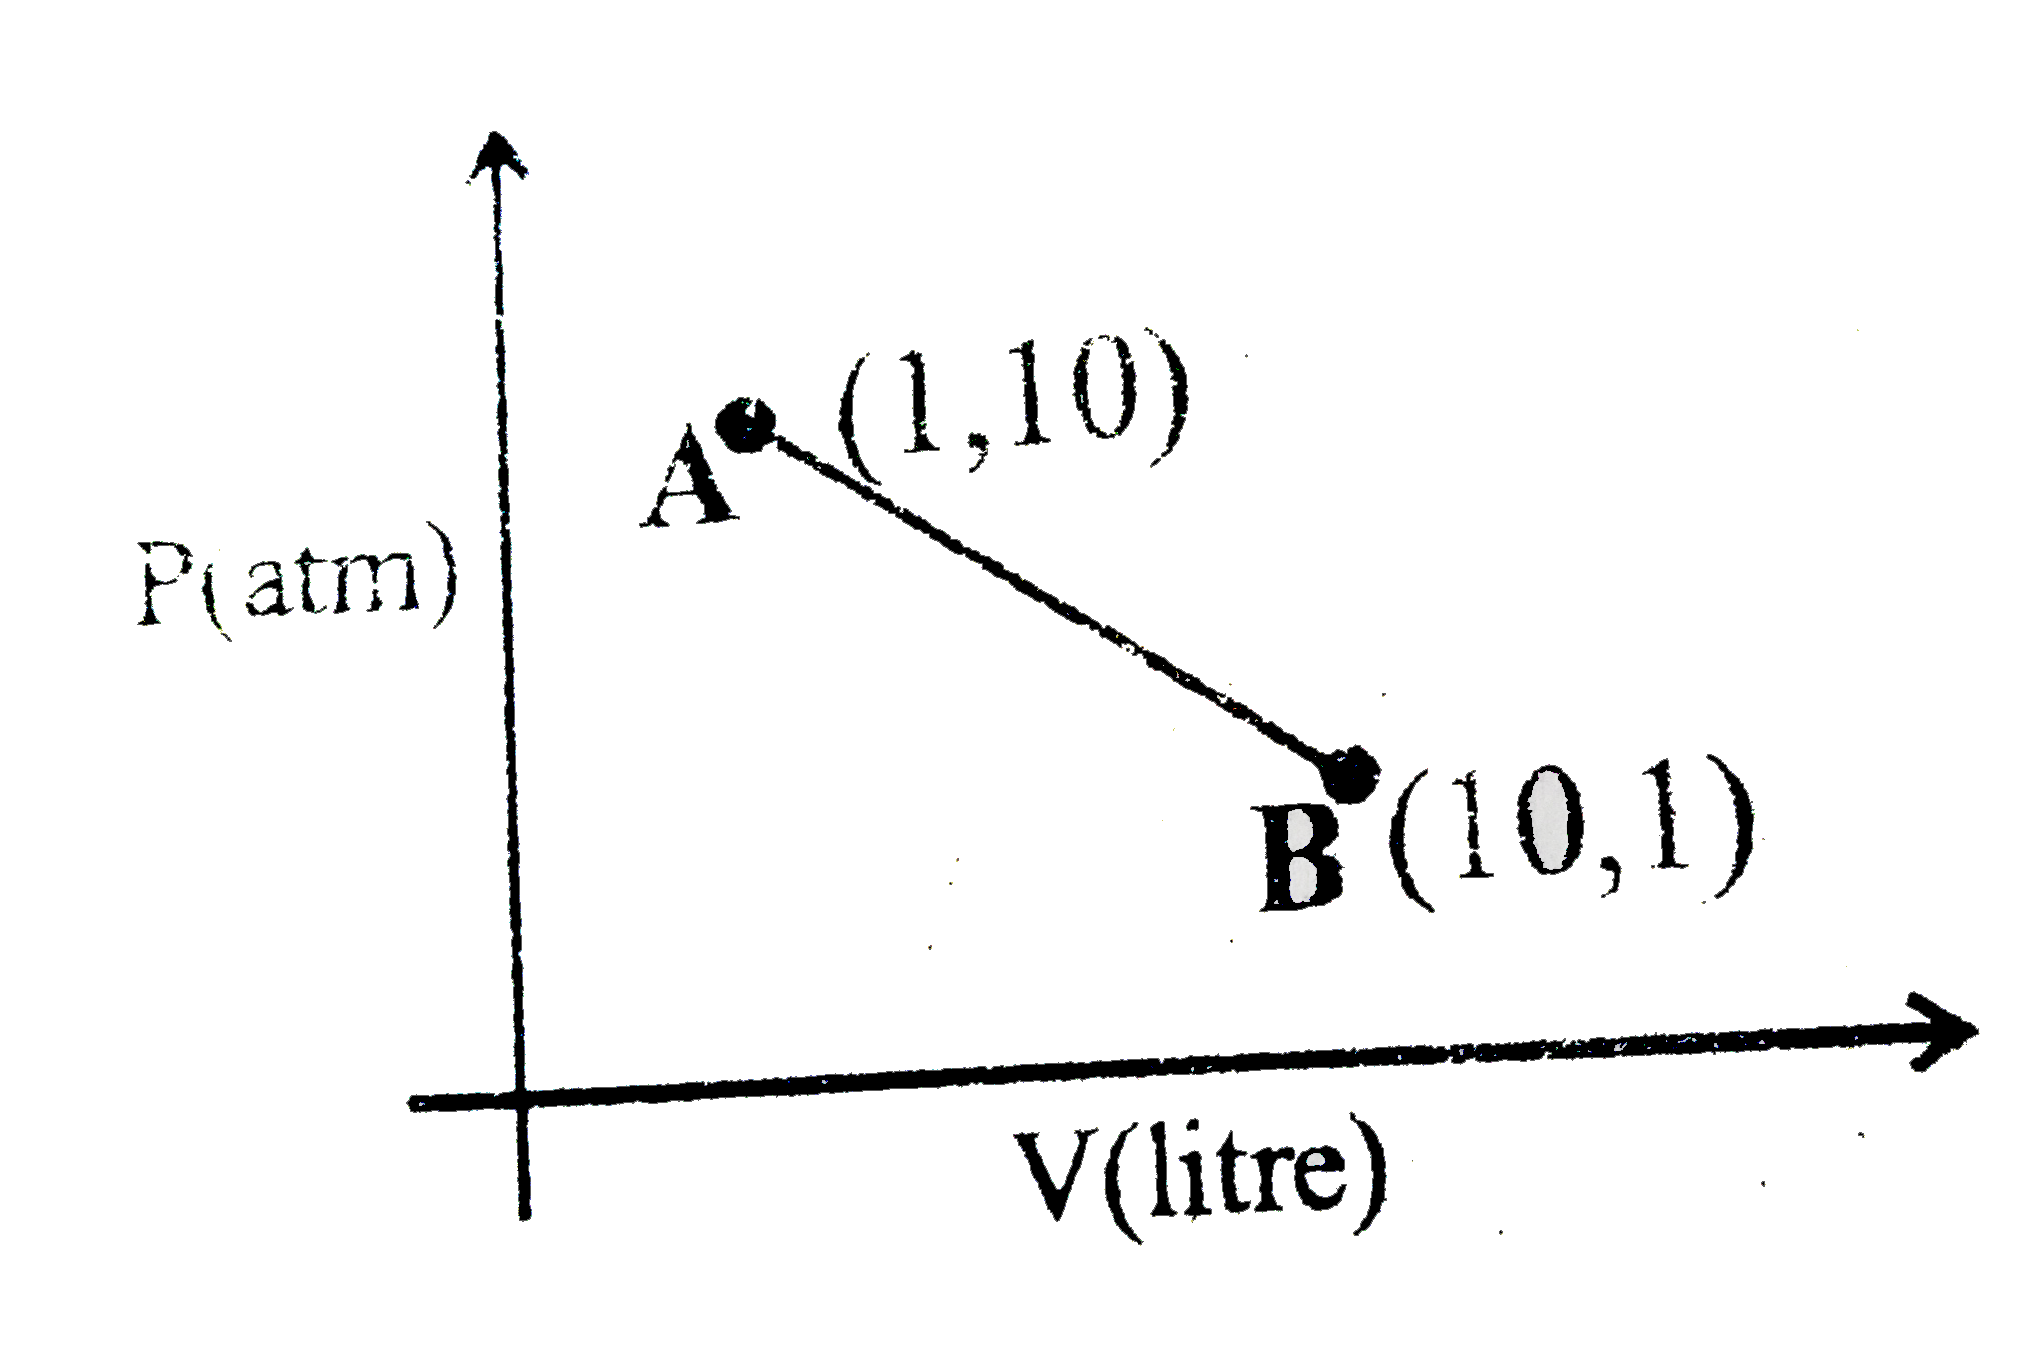
View SolutionFor 1 mole of an ideal gas, a graph of pressure vs volume is plotted as shown. Which of the following options is correct ?
View SolutionWhich of the following plot is correct about the kinetic energy of photoelectrons ?
View Solution

