Strong acid versus strong base:
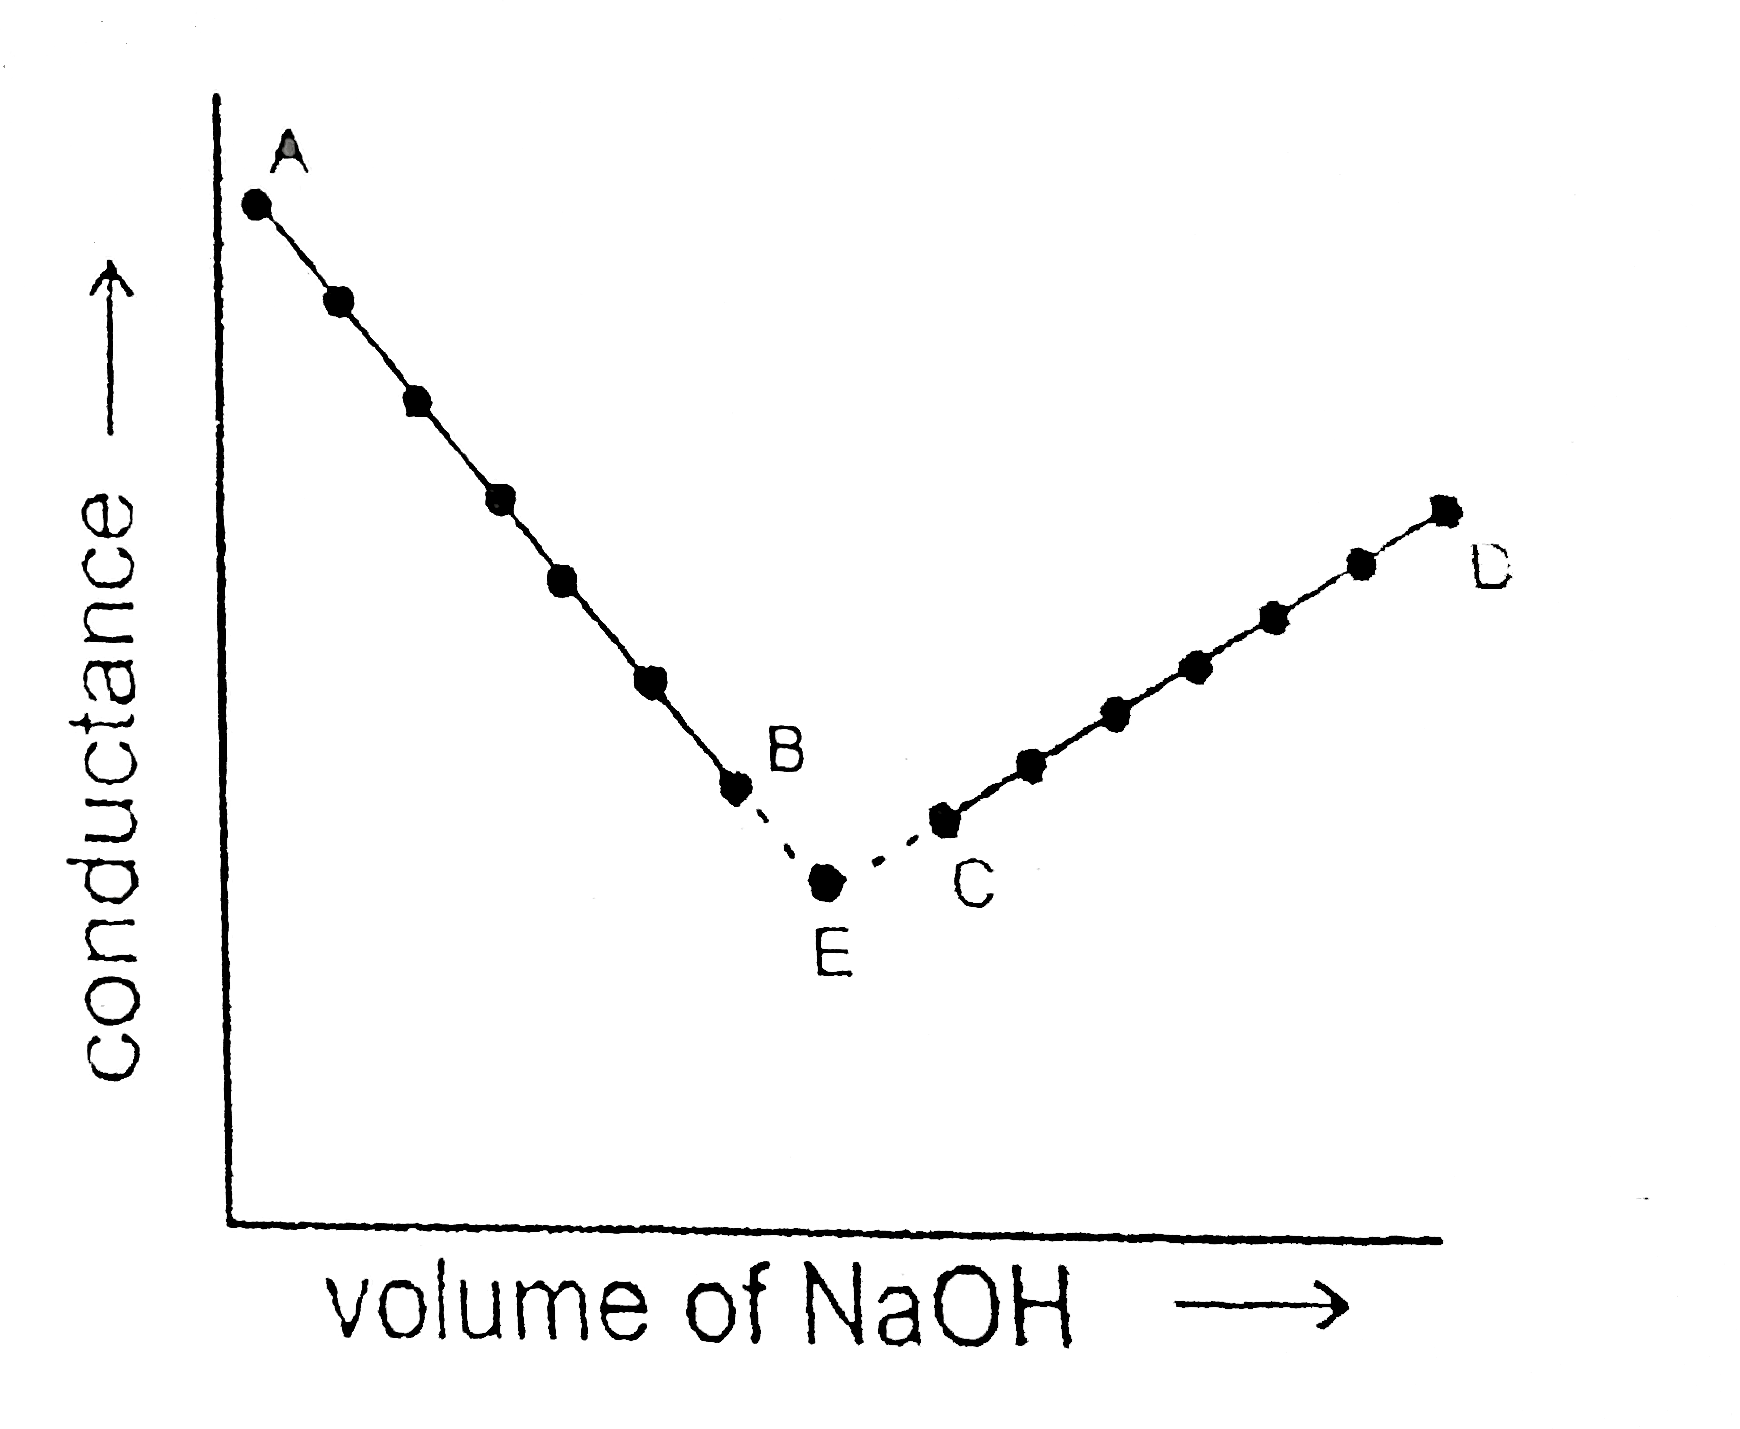
The principle of conductometric titrations is based on the fact that during the titration, one of the ions is replaced by the other and invariable these two ions differ in the ionic conductivity with the result that thhe conductivity of the solution varies during the course of the titration. take, for example, the titration between a strong acid, say HCl, and a string base, say NaOH before NaOH is added, the conductance of HCl solution has a high value due to the presence of highly mobile hydrogen ions. As NaOH is added, H+ ions are replaced by relatively slower moving Na+ ions. consequently the conductance of the solution decreases and this continues right upto the equivalence point where the solution contains only NaCl. Beyond the equivalence point, if more of NaOH is added, then the solution contains a excess of the fast moving OH− ions with the result that its conductance is increased ad it condinues to increase as more and more of NaOH is added. If we plot the conductance value versus the amount of NaOH added, we get a curve of the type shown in Fig. The descending portion AB represents the conductances before the equivalence point (solution contains a mixture of acid HCl and the salt NaCl) and the ascending portion CD represents the conductances after the equivalence point (solution contains the salt NaCl and the excess of NaOH). The point E which represent the minium conductance is due to the solution containing only NaCl with no free acid or alkali and thus represents the equivalence point. this point can, however, be obtained by the extrapolation of the lines AB and DC, and therefore, one is not very particular in locating this point expermentally as it is in the case of ordinary acid-base titrations involving the acid-base indicators.
Weak acid versus strong base:
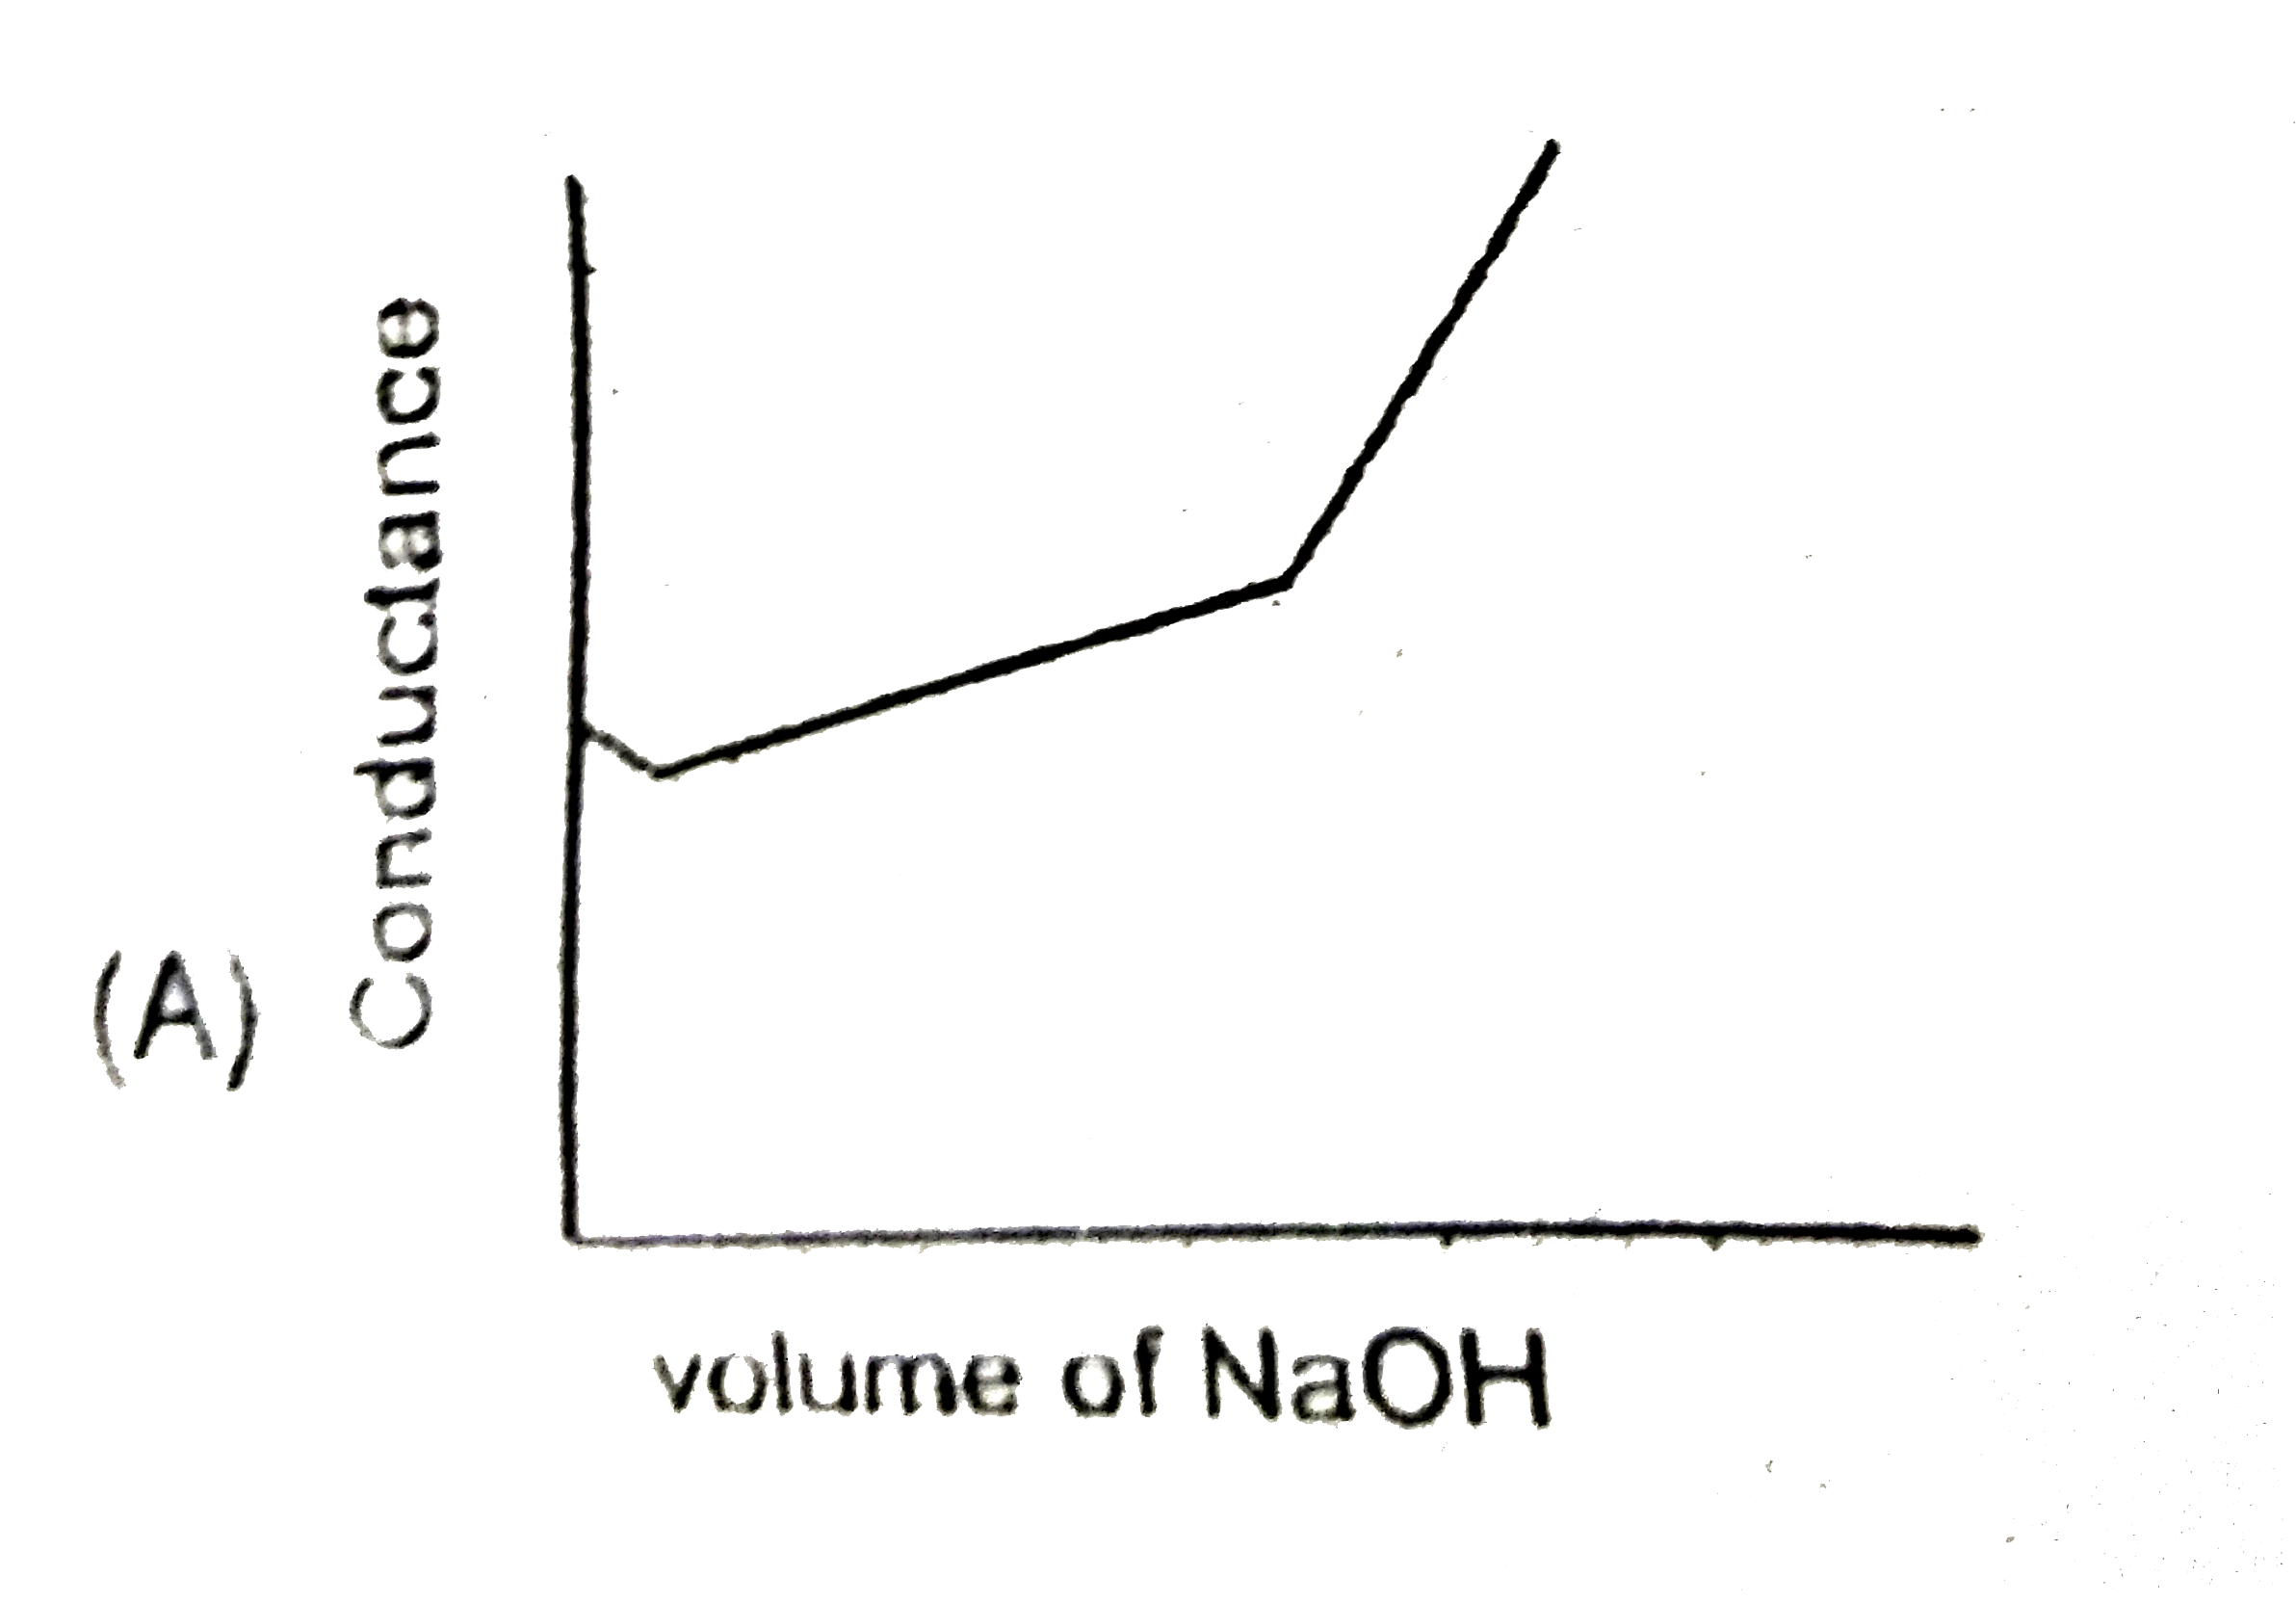
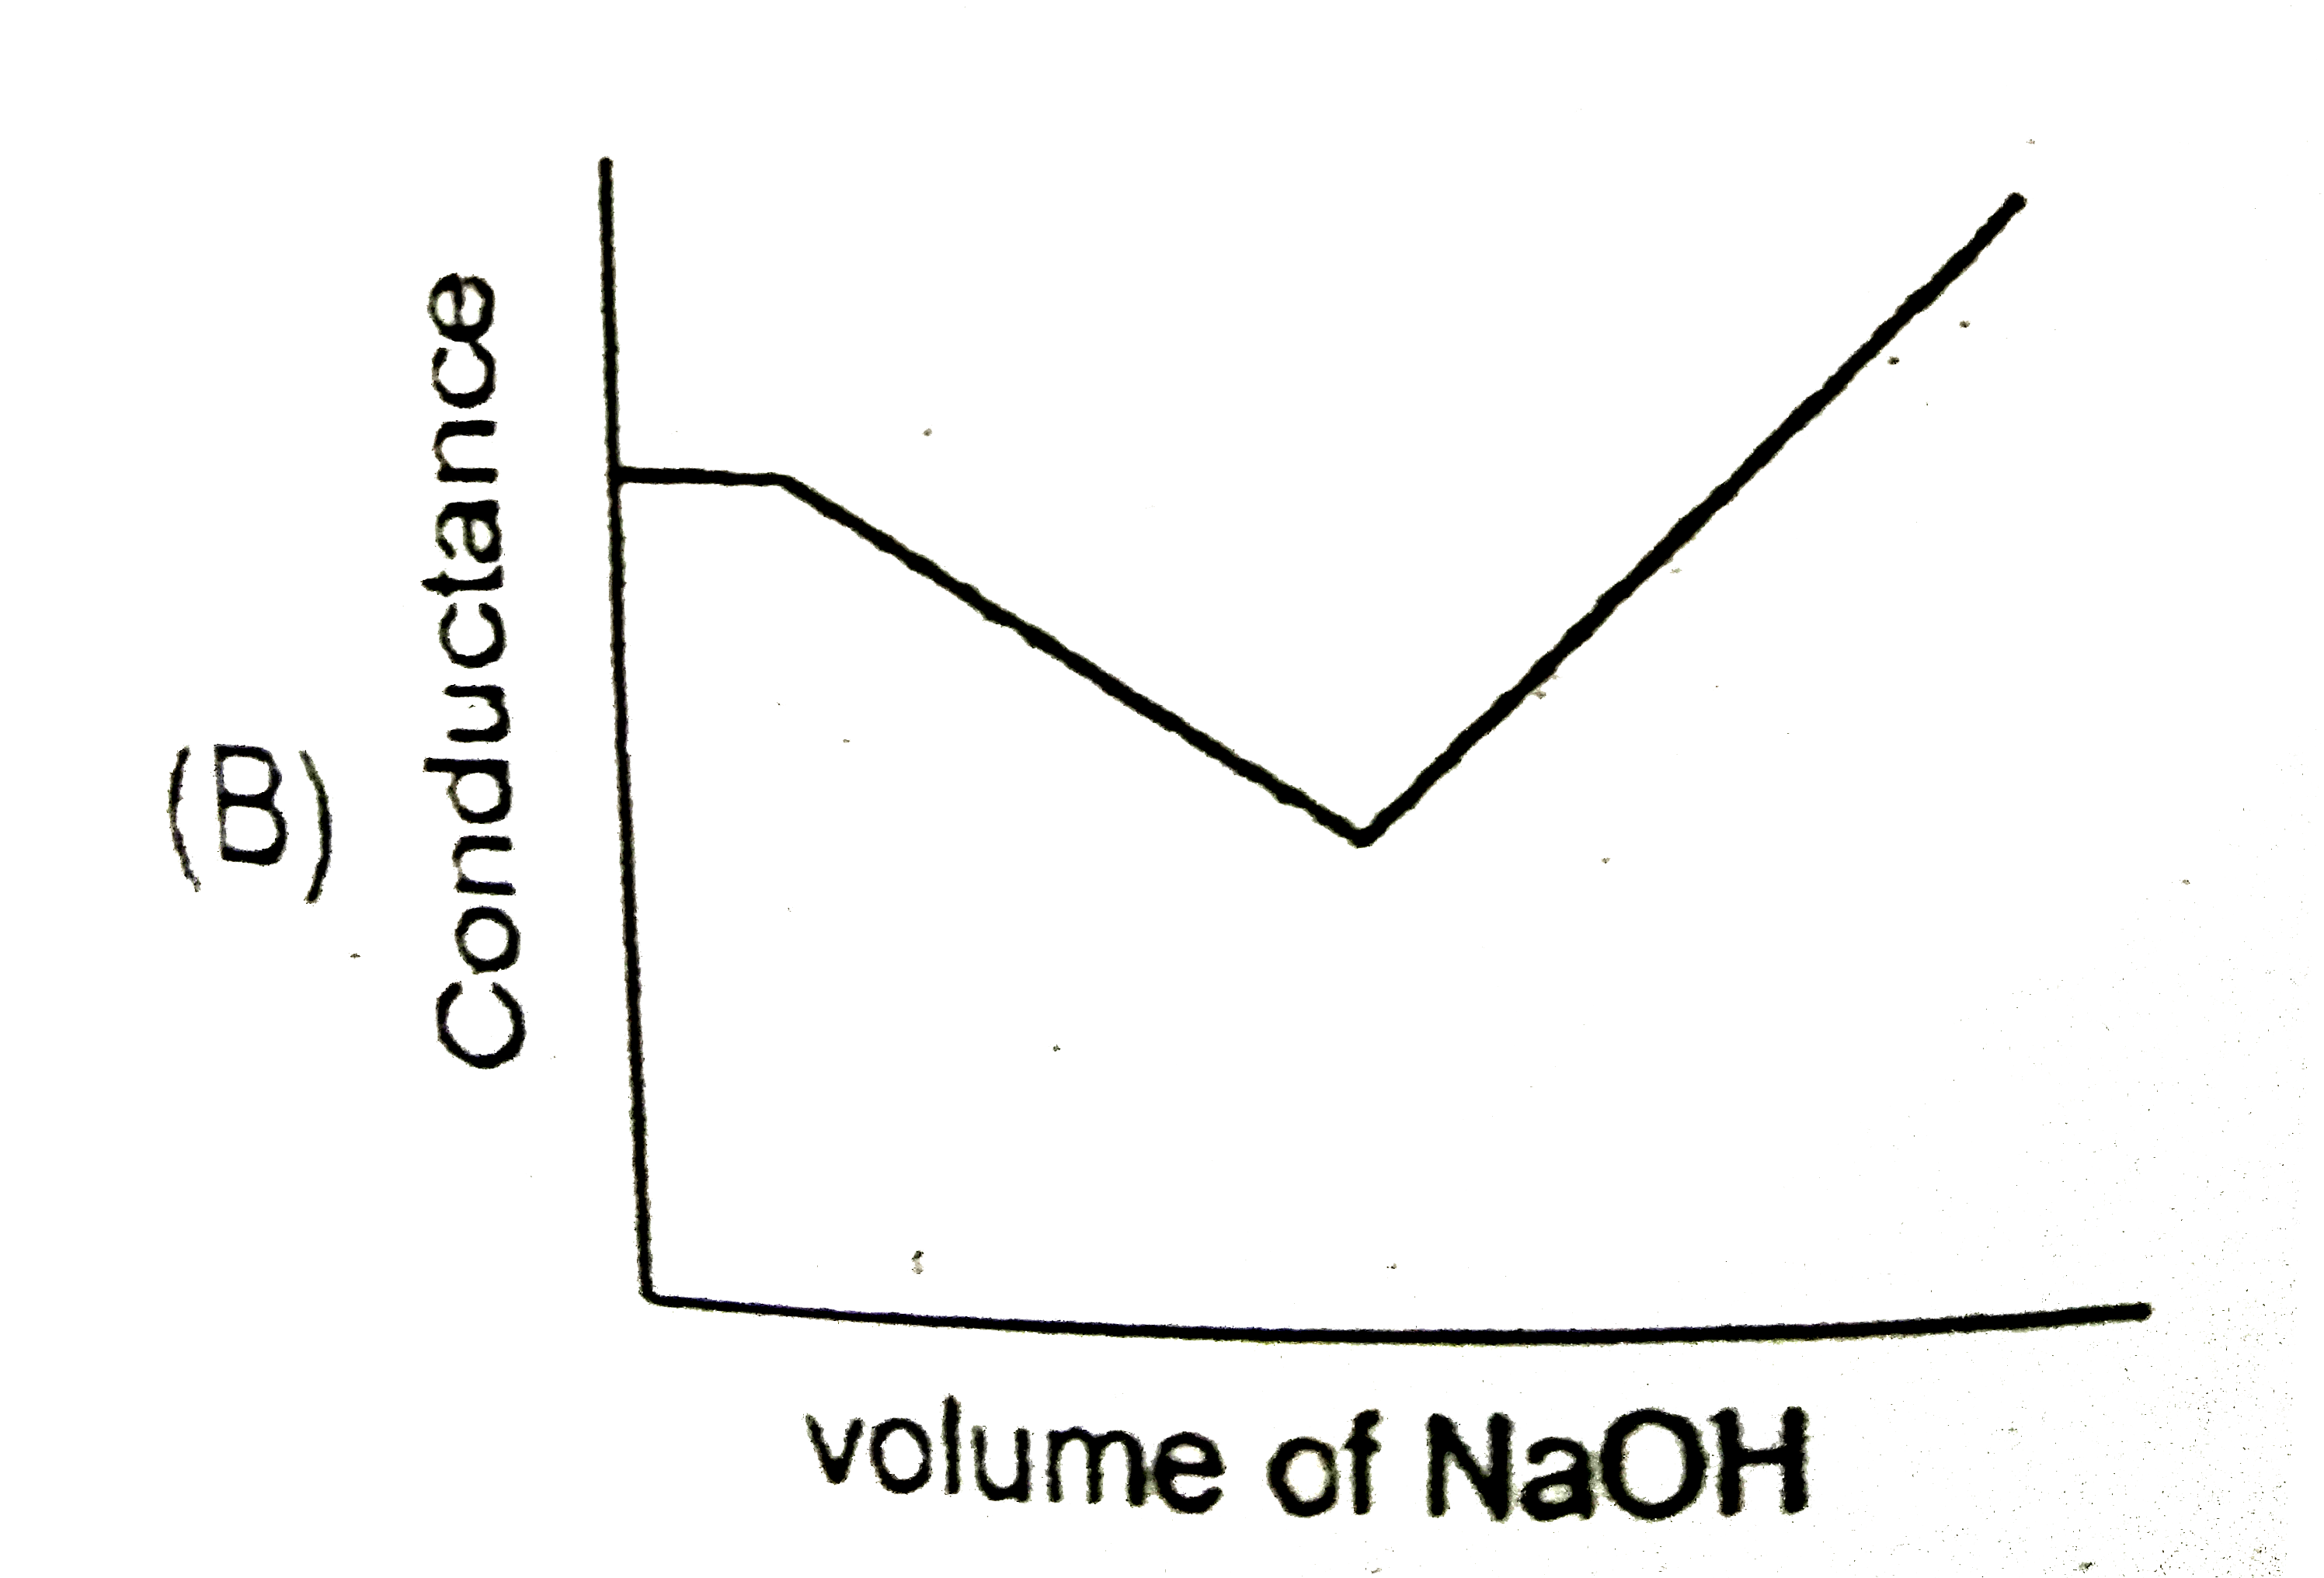
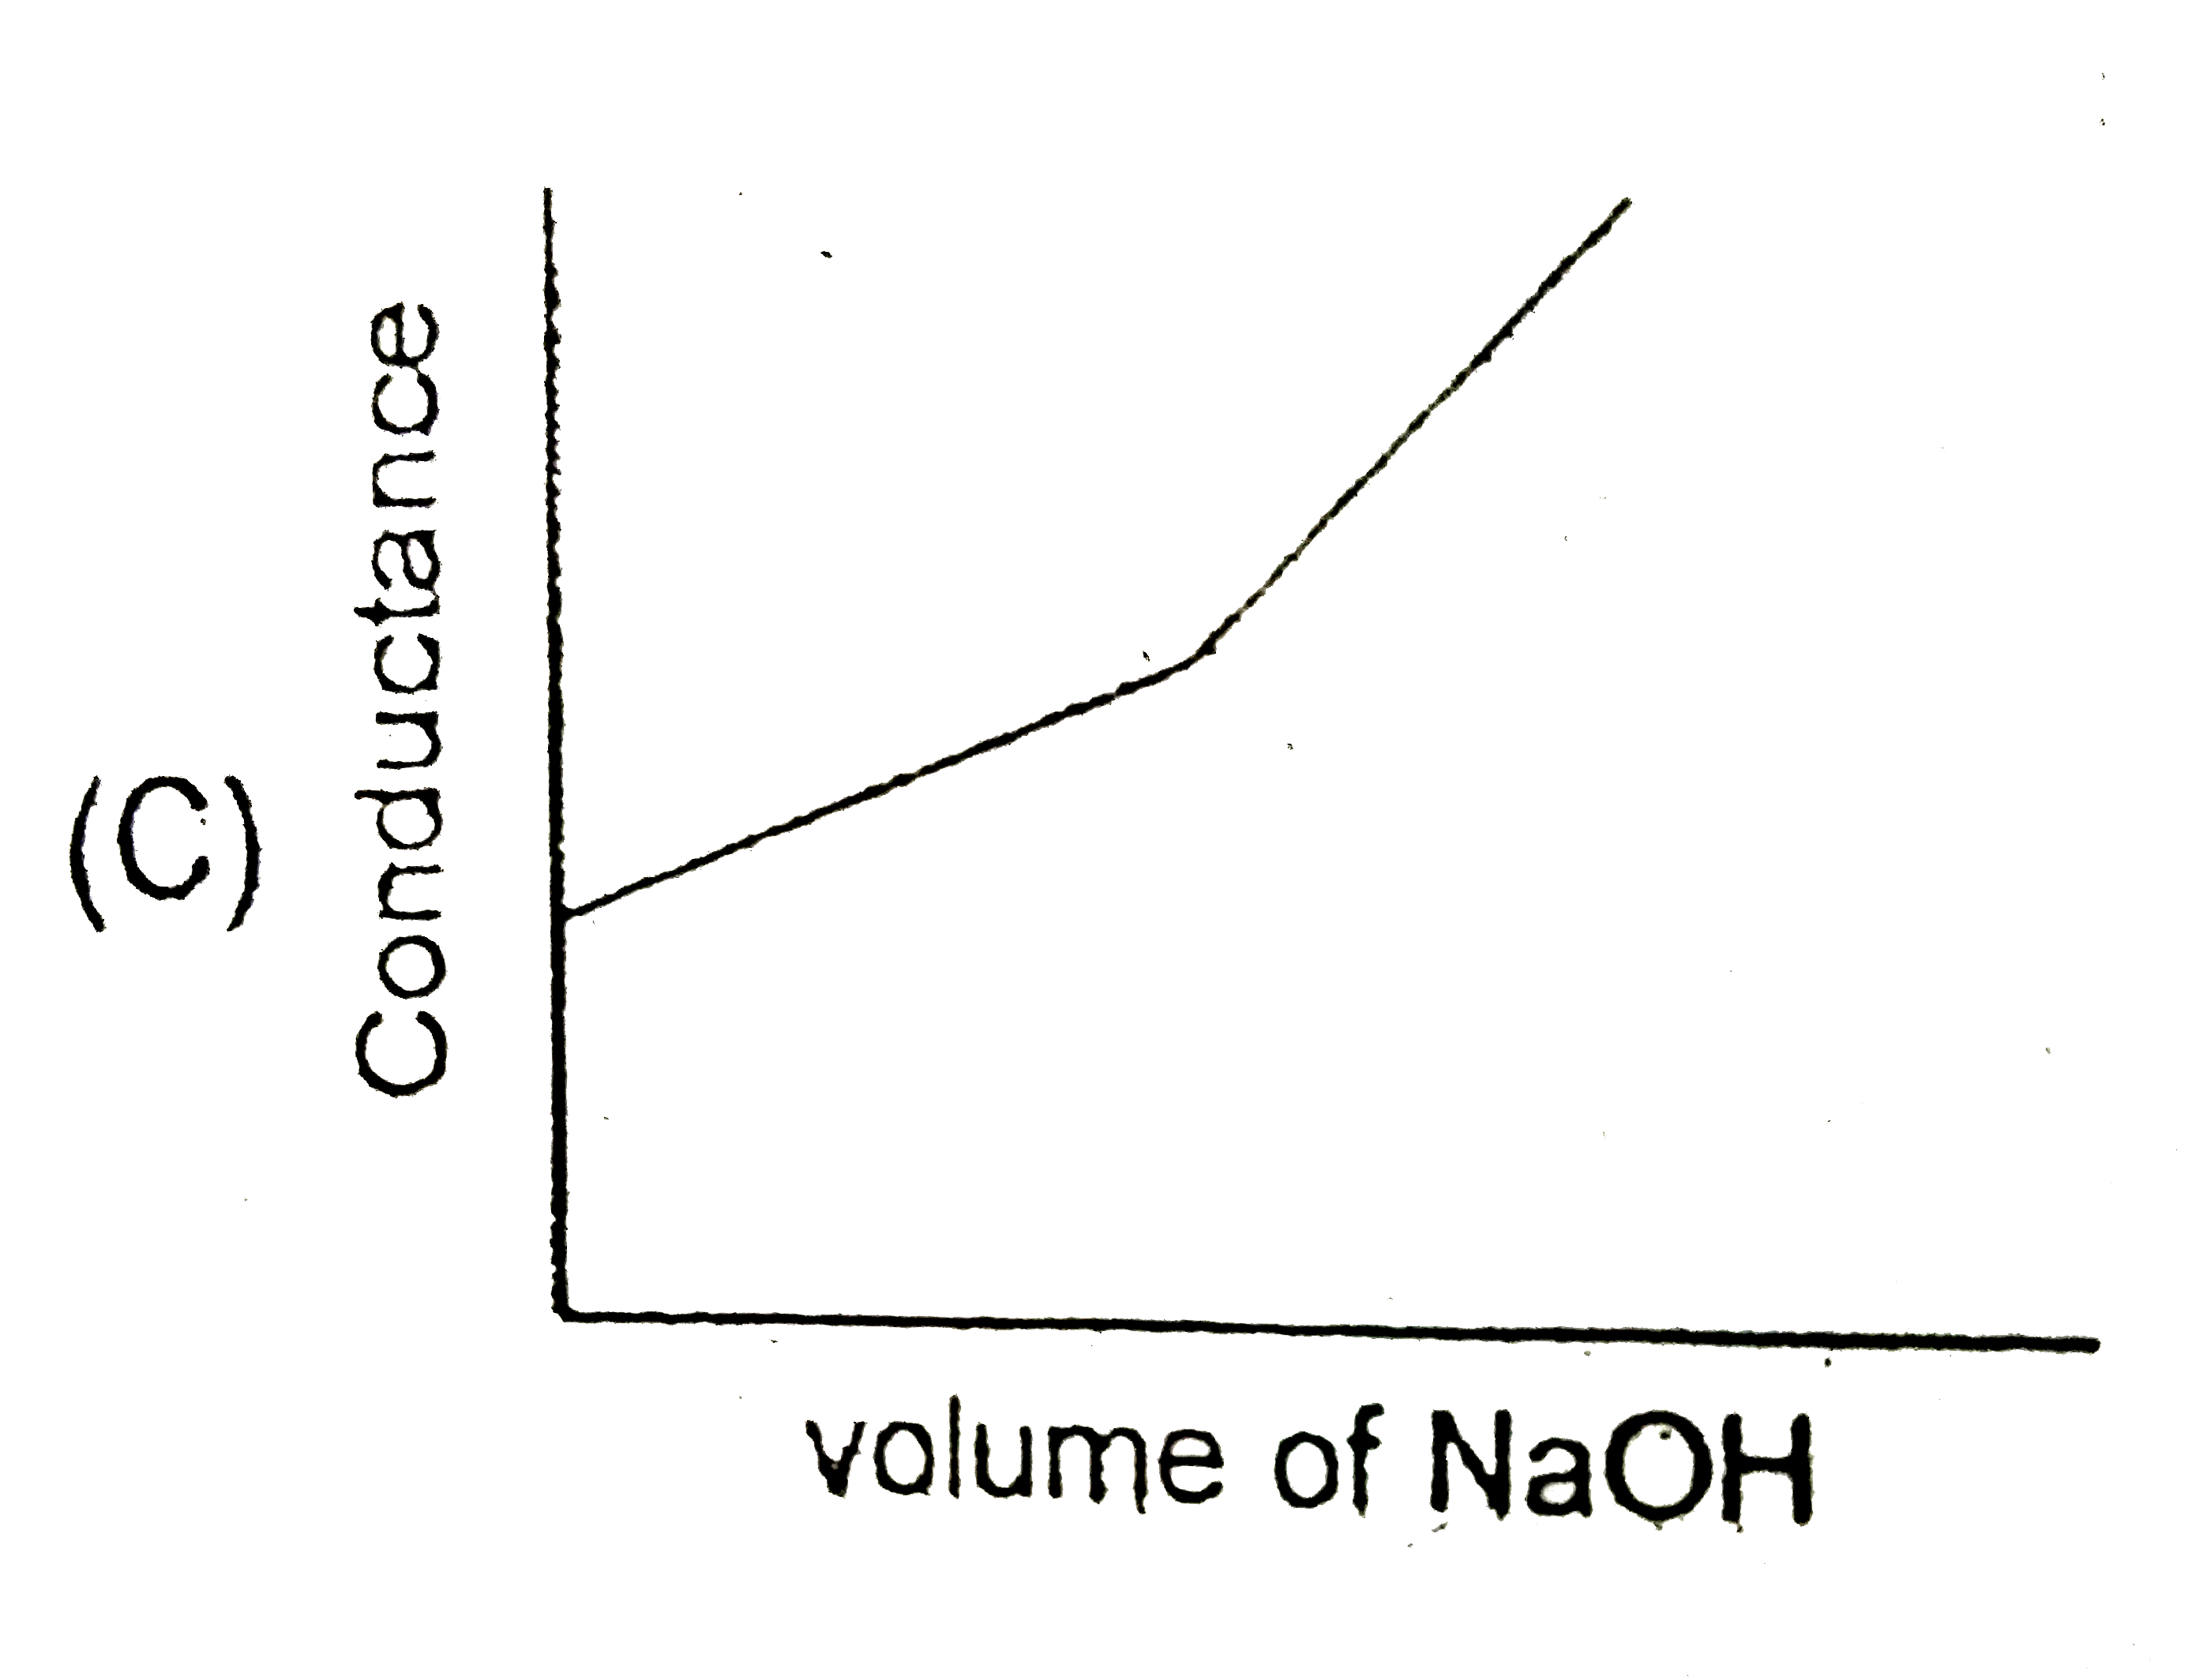
Let us take specific example of acetic acid being titrated against NaOH. Before the addition of alkali, the solution shows poor conductance due to feeble ionization of acetic acid. Initially the addition of alkali causes not only the replacement of H+ by Na+ but also suppresses the dissociation of acetic acid due to the common ion Ac− and thus the conductance of the solution decreases in the beginning. but very soon the conductance start increasing as addition of NaOH neutralizes the undissociated HAc to Na+Ac− thus causing the replacement of non-conducting HAc with Strong-conducting electrolyte Na+Ac−. the increase in conductance continuous right up to the equivalence point. Beyond this point conductance increases more rapidly with the addition of NaOH due to the highly conducting OH− ions, the graph near the equivalence point is curved due to the hydrolysis of the salt NaAc. The actual equivalence point can, as usual, be obtained by the extrapolation method.
In all these graphs it has been assumed that the volume change due addition of solution from burrette is negnigible, hence volume change of the solution in beaker the conductance of which is measured is almost constant throughout the measurement.
Q. The nature of curve obtained for the titration between weak acid versus strong base as described in the above passage will be:
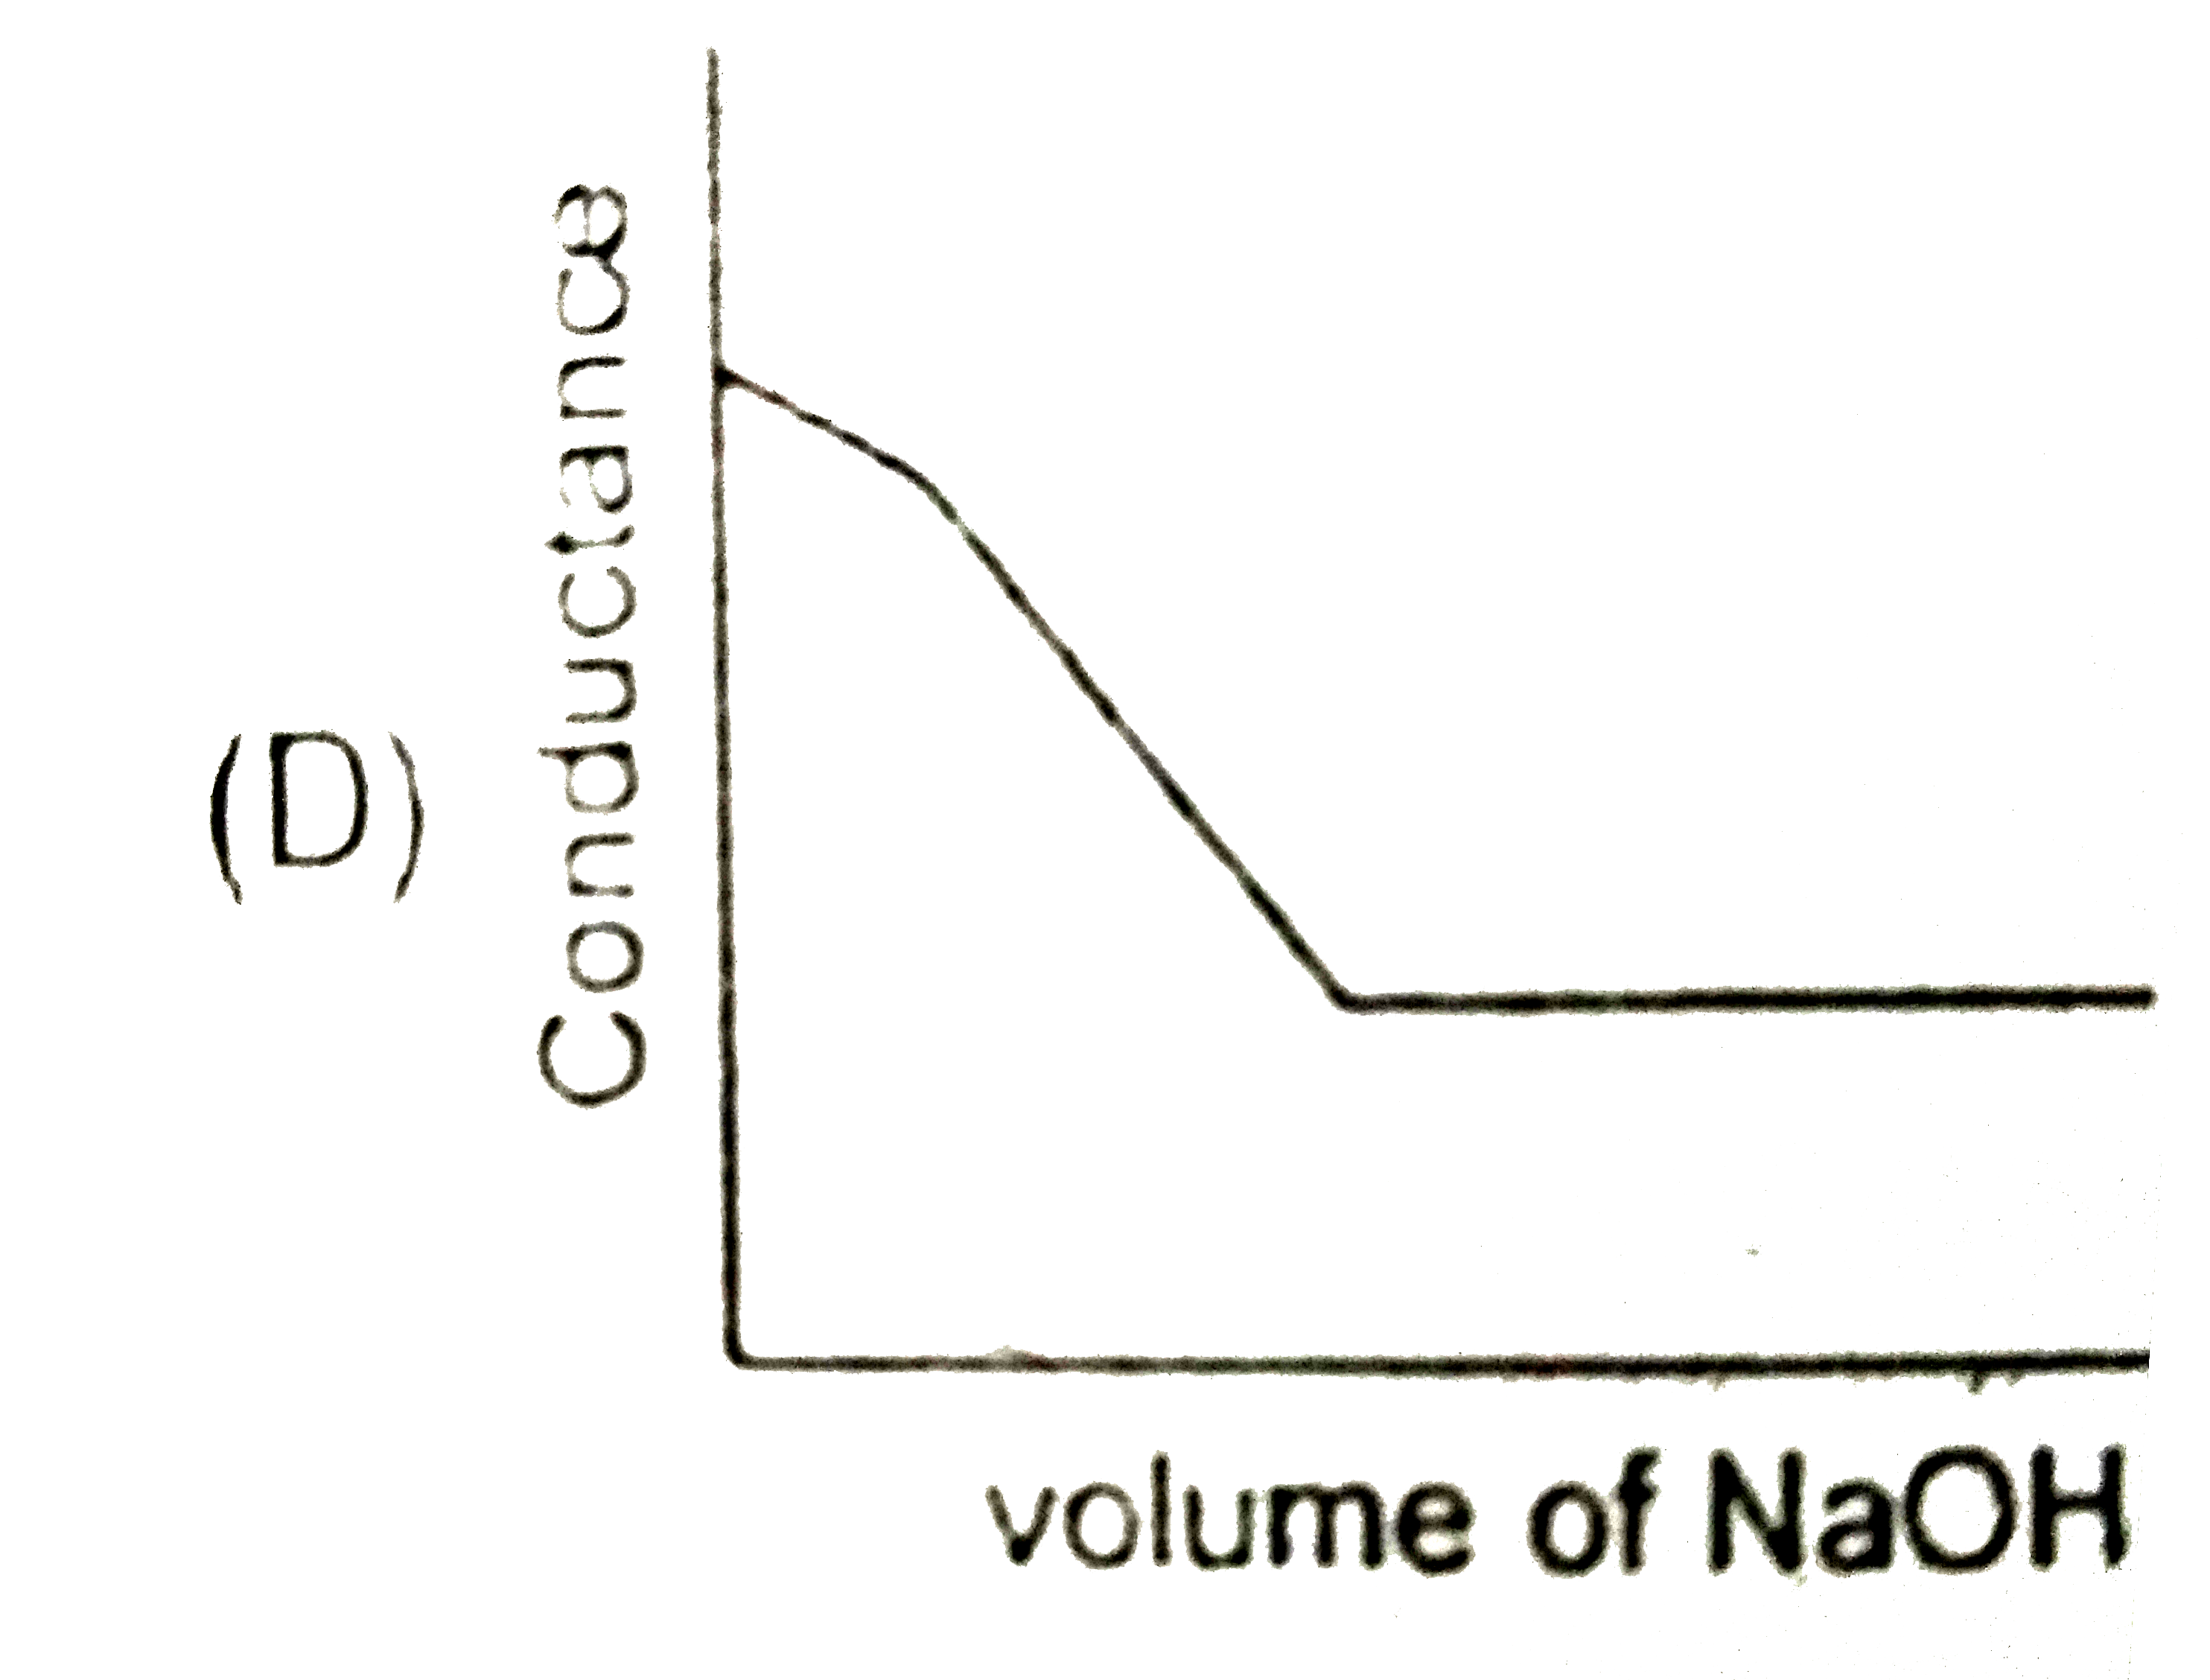
The correct Answer is:A
Step by step video & image solution for Strong acid versus strong base: The principle of conductometric titrations is based on the fact that during the titration, one of the ions is replaced by the other and invariable these two ions differ in the ionic conductivity with the result that thhe conductivity of the solution varies during the course of the titration. take, for example, the titration between a strong acid, say HCl, and a string base, say NaOH before NaOH is added, the conductance of HCl solution has a high value due to the presence of highly mobile hydrogen ions. As NaOH is added, H^(+) ions are replaced by relatively slower moving Na^(+) ions. consequently the conductance of the solution decreases and this continues right upto the equivalence point where the solution contains only NaCl. Beyond the equivalence point, if more of NaOH is added, then the solution contains a excess of the fast moving OH^(-) ions with the result that its conductance is increased ad it condinues to increase as more and more of NaOH is added. If we plot the conductance value versus the amount of NaOH added, we get a curve of the type shown in Fig. The descending portion AB represents the conductances before the equivalence point (solution contains a mixture of acid HCl and the salt NaCl) and the ascending portion CD represents the conductances after the equivalence point (solution contains the salt NaCl and the excess of NaOH). The point E which represent the minium conductance is due to the solution containing only NaCl with no free acid or alkali and thus represents the equivalence point. this point can, however, be obtained by the extrapolation of the lines AB and DC, and therefore, one is not very particular in locating this point expermentally as it is in the case of ordinary acid-base titrations involving the acid-base indicators. Weak acid versus strong base: Let us take specific example of acetic acid being titrated against NaOH. Before the addition of alkali, the solution shows poor conductance due to feeble ionization of acetic acid. Initially the addition of alkali causes not only the replacement of H^(+) by Na^(+) but also suppresses the dissociation of acetic acid due to the common ion Ac^(-) and thus the conductance of the solution decreases in the beginning. but very soon the conductance start increasing as addition of NaOH neutralizes the undissociated HAc to Na^(+)Ac^(-) thus causing the replacement of non-conducting HAc with Strong-conducting electrolyte Na^(+)Ac^(-). the increase in conductance continuous right up to the equivalence point. Beyond this point conductance increases more rapidly with the addition of NaOH due to the highly conducting OH^(-) ions, the graph near the equivalence point is curved due to the hydrolysis of the salt NaAc. The actual equivalence point can, as usual, be obtained by the extrapolation method. In all these graphs it has been assumed that the volume change due addition of solution from burrette is negnigible, hence volume change of the solution in beaker the conductance of which is measured is almost constant throughout the measurement. Q. The nature of curve obtained for the titration between weak acid versus strong base as described in the above passage will be: by Chemistry experts to help you in doubts & scoring excellent marks in Class 12 exams.
Updated on:21/07/2023Topper's Solved these Questions
- ELECTROCHEMISRYBOOK - RESONANCE ENGLISHCHAPTER - ELECTROCHEMISRYEXERCISE - Exercise 3
7 Videos
- ELECTROCHEMISRYBOOK - RESONANCE ENGLISHCHAPTER - ELECTROCHEMISRYEXERCISE - Part 2
23 Videos
- ELECTROCHEMISRYBOOK - RESONANCE ENGLISHCHAPTER - ELECTROCHEMISRYEXERCISE - Objective Questions
41 Videos
- ELECTRO CHEMISTRYBOOK - RESONANCE ENGLISHCHAPTER - ELECTRO CHEMISTRYEXERCISE - PHYSICAL CHEMITRY (ELECTROCHEMISTRY)
53 Videos
- EQUIVALENT CONCEPT & TITRATIONSBOOK - RESONANCE ENGLISHCHAPTER - EQUIVALENT CONCEPT & TITRATIONSEXERCISE - Part -IV
22 Videos
Similar Questions
Which indicator is most commonly used for the titration of a strong acid against a strong base?
View SolutionWhy is heat of neutralisation for a strong acid and strong base constant ?
View SolutionWhich of the following are true for an acid- base titration?
View SolutionWhich of the following is/are true for an acid- base titration?
View SolutionEnthalpy of neutralisation of all strong acids and strong bases has the same value because
View SolutionThe best indicator for the detection of the end point in the titration of a weak acid and a strong base is
View SolutionWhy do the salts of strong acids and strong bases not undergo hydrolysis?
View SolutionThe heat of neutralisation for strong acid and strong base forming 2 moles of water is
View SolutionWhat is Arrhenius concept of acids and bases ? On the basis of this concept explain why heat of neutralisation for a strong acid and a strong base is always constant.
View SolutionA strong acid is titrated with weak base. At equivalence point, pH will be :
View Solution
