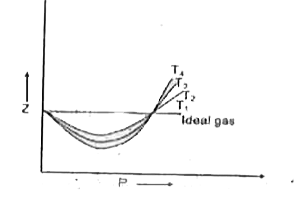
The behaviour of a real gas is usually depicted by plotting compressibility factor Z versus P at a constant temperature At high temperature and high pressure Z is usually more than one This fact can be explained by van der Waals' equation when .
The constant a is negligible and not b
The constant b is negligible and not a
Both the constants a and b are negligible
Both the constants a and b are negligible
From van der Waals' equation,
[P+aV2][V−b]=RT..(1)
Z=PVnRT,ifZ>1thenPV>nRT
Which is possible from (1) when aV2 is negligible
P(V−b)=RT
or PV=RT+Pb
or PV>RT .
Topper's Solved these Questions
- GASEOUS STATEBOOK - P BAHADURCHAPTER - GASEOUS STATEEXERCISE - Exercise B
1 Videos
- GASEOUS STATEBOOK - P BAHADURCHAPTER - GASEOUS STATEEXERCISE - Exercise 4
1 Videos
- GASEOUS STATEBOOK - P BAHADURCHAPTER - GASEOUS STATEEXERCISE - Exercise 3
1 Videos
- CHEMICAL EQUILIBRIUMBOOK - P BAHADURCHAPTER - CHEMICAL EQUILIBRIUMEXERCISE - Exercise
134 Videos
- IONIC EQUILIBRIUMBOOK - P BAHADURCHAPTER - IONIC EQUILIBRIUMEXERCISE - Exercise
85 Videos
Similar Questions
Knowledge Check
The gases which strictly follow the general equation (PV=nRT) are called ideal or perfect gases. Actually, there is no gas which is perfect or ideal. A real gas is one which actually exists, whether it obeys gas laws strictly or not. Under ordinary conditions, only those gases nearly behave as ideal or perfect which have very low boiling points such as nitrogen, hydrogen ect. The most easily liquefiable and highly soluble gases such as ammonia, carbon dioxide, sulphur dioxide show large deviation
A very convenient method of studying deviation of real gases from ideal behaviour is through a compressibility factor (Z)
Z=PVnRT
(i) Z=1, for ideal gases.
(ii) Z≠1, for real gases.
The behaviour of a real gas is usually depiected by plotting compressibility factor Z versus pressure P at a constant temperature. At high temperature and pressure, Z is usually more than one. This fact can be explained by van der Waal's equation when :Athe constant 'a' is negligible but not 'b'Bthe constant 'b' is negligible but not 'a'Cboth constant 'a' and 'b ' are negligibleDboth the constant 'a' and 'b' are not negligibleAt high temperature and low pressure the van der Waals equation is reduced to .
A[P+aV2][V]=RTBPV=RTCP(V−b)=RTD[P+aV2][V]=RTCompressibility factor (Z) is plotted against pressure at different temperature for same gas
 AT4>T3>T2>T1BT1>T2>T3>T4CT1>T2>T3>T4DT1>T2>T3>T4
Which of the following represents a plot of compressibility factor (Z) versus P at room temperature for helium?
View SolutionThe compressibility factor (Z) of real gas is usually less than 1 at low temperature and low pressure because
View SolutionAt a high pressure, the compressibility factor (Z) of a real gas is usually greater than one. This can be explained from van der Waals equation by neglecting the value of:
View SolutionIf Z is a compressibility factor, van der Waals' equation at low pressure can be written as
View SolutionIf Z is a compressibility factor, van der waals equation at low pressure can be written as
View Solution
