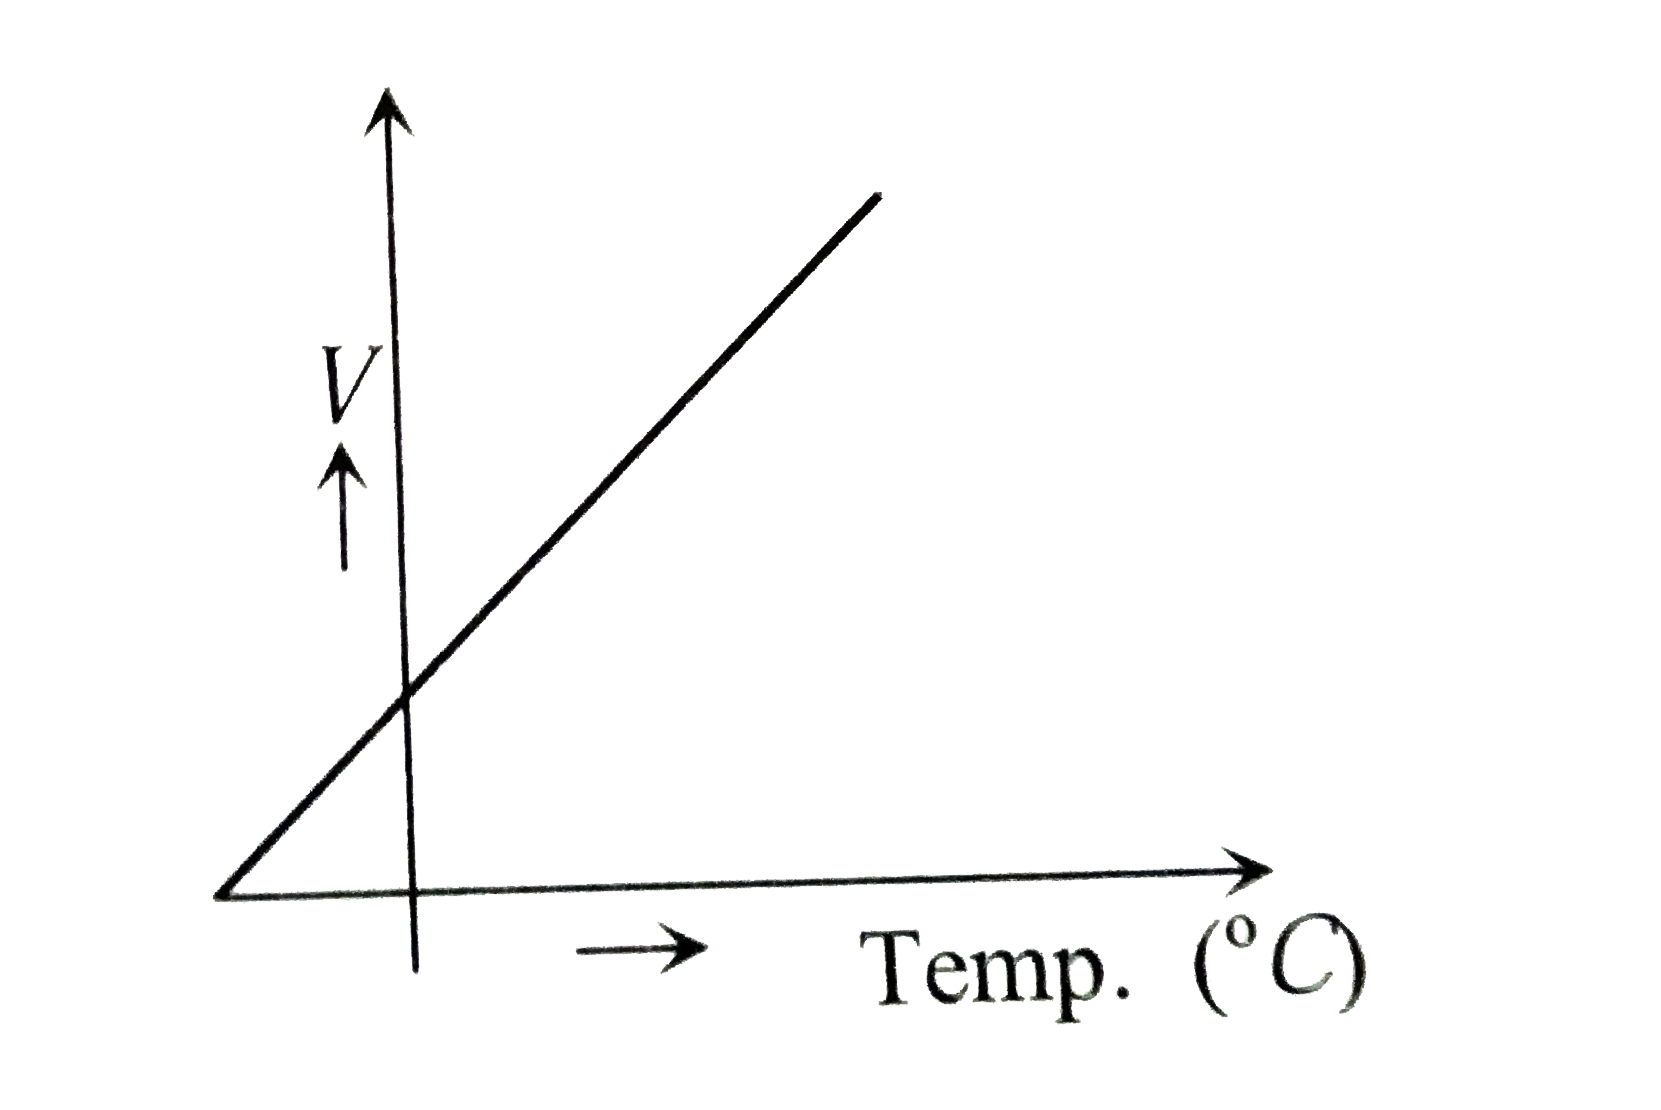
The following graphs illustrate:
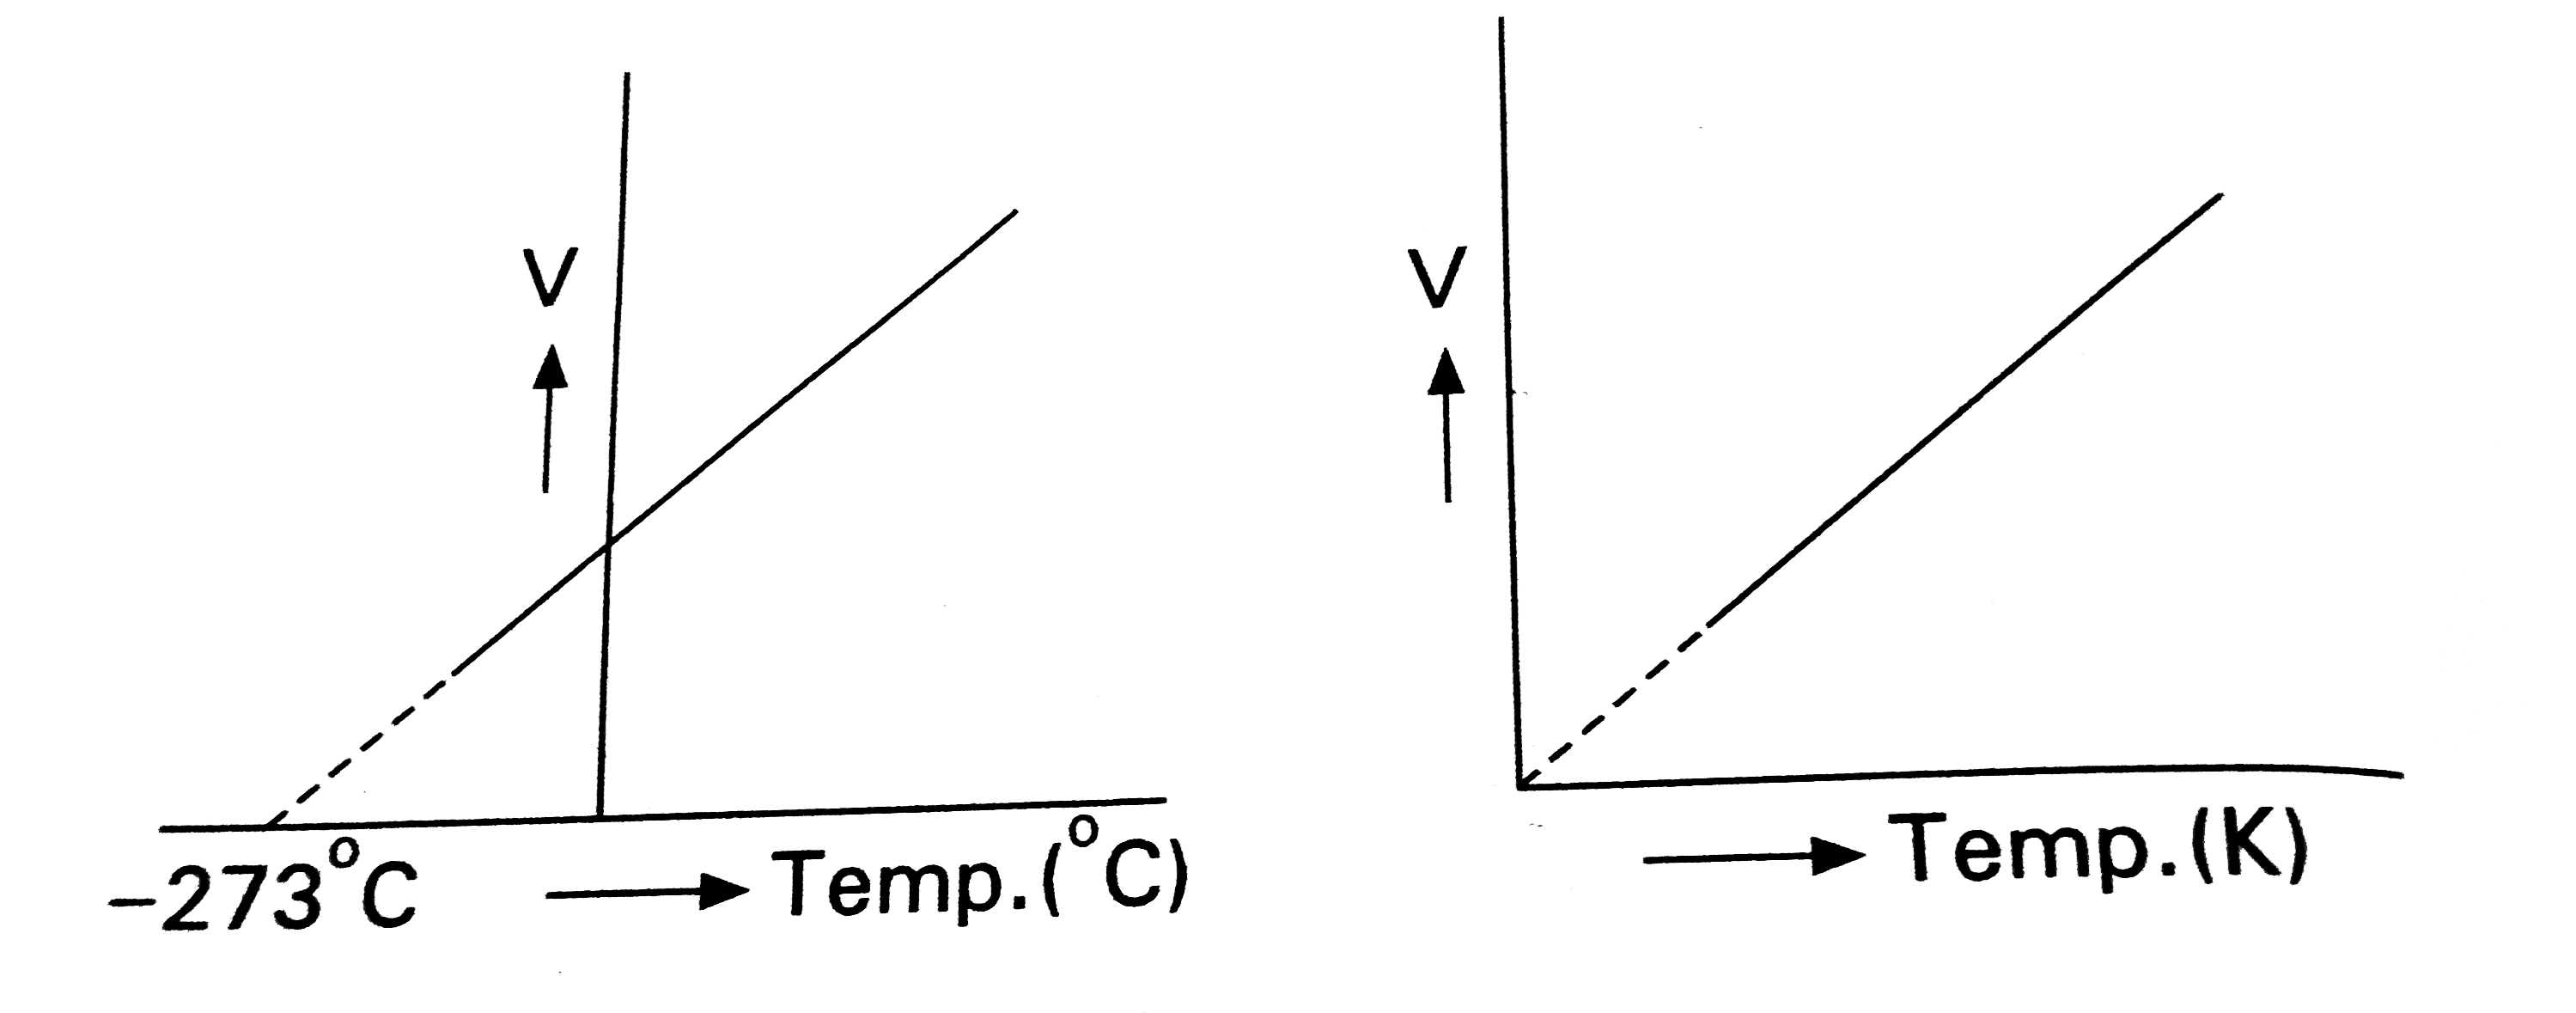
Dalton's law
Charles's law
Boyle's law
Gay-Lussac's law
The correct Answer is:B
Step by step video, text & image solution for The following graphs illustrate: by Chemistry experts to help you in doubts & scoring excellent marks in Class 11 exams.
Updated on:21/07/2023Topper's Solved these Questions
- MISCELLANEOUS (TOPICS OF GENERAL INTEREST)BOOK - OP TANDONCHAPTER - MISCELLANEOUS (TOPICS OF GENERAL INTEREST)EXERCISE - SET-V: Matching type Questions
37 Videos
- INTRODUCTION TO ORGANIC CHEMISTRY BOOK - OP TANDONCHAPTER - INTRODUCTION TO ORGANIC CHEMISTRY EXERCISE - SINGLE INTEGER ANSWER TYPE
4 Videos
- OXIDATION AND REDUCTION (REDOX REACTIONS)BOOK - OP TANDONCHAPTER - OXIDATION AND REDUCTION (REDOX REACTIONS)EXERCISE - SECTION V
3 Videos
Similar Questions
Knowledge Check
The following graph illustrates
 ADalton's lawBCharles' lawCBoyle's lawDGay-Lussac's law
Which of the following graphs best illustrates the variation of entropy of a substance with temp.
A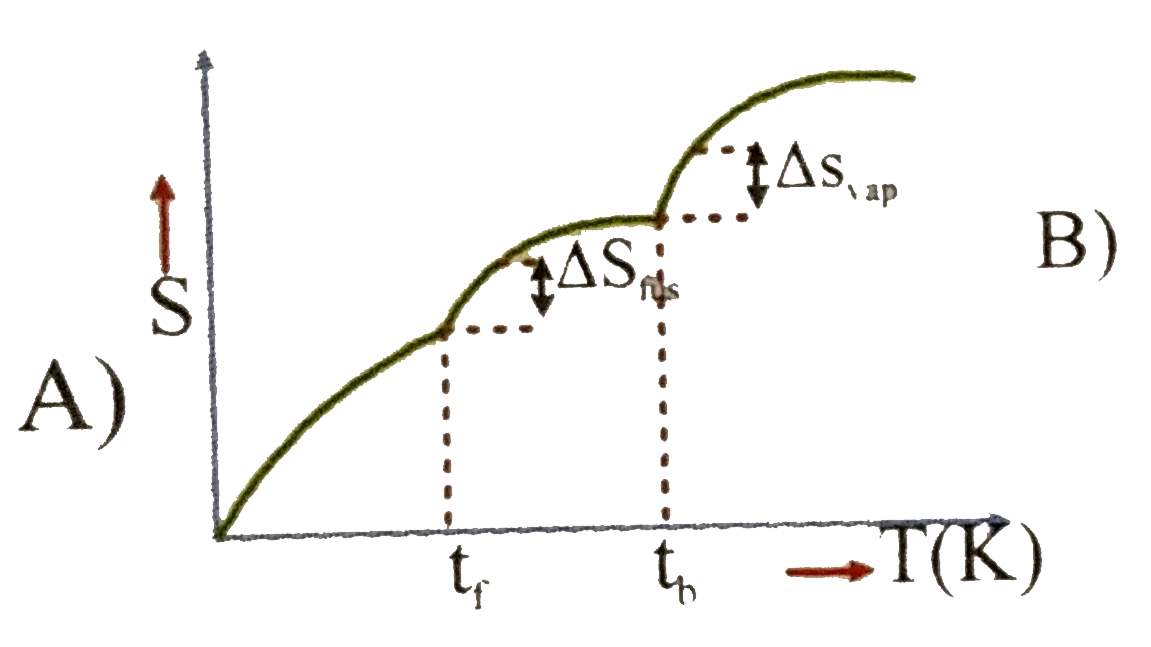 B
B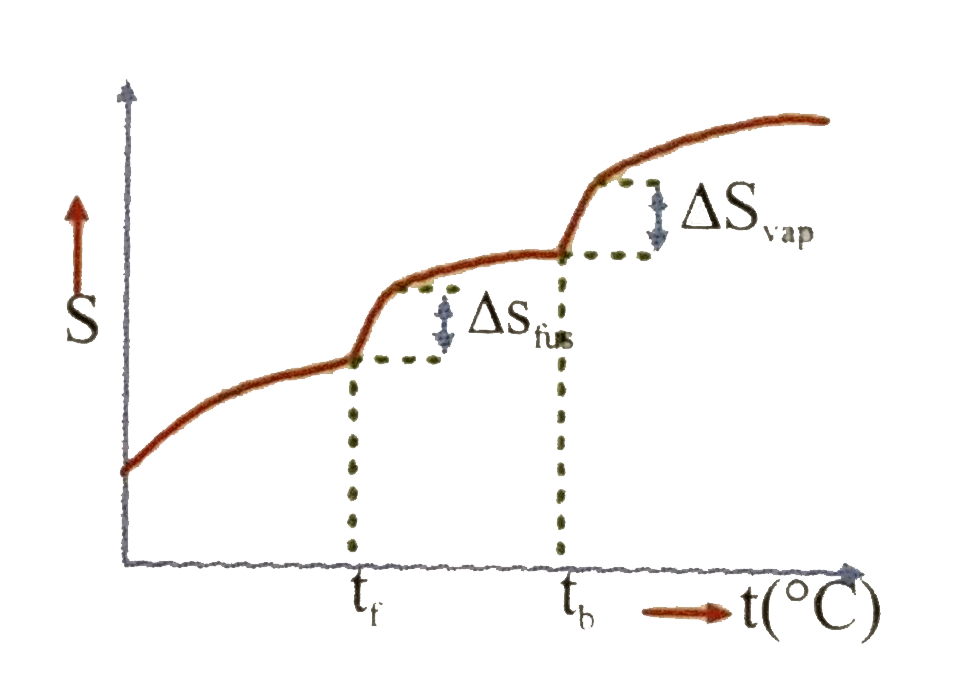 C
C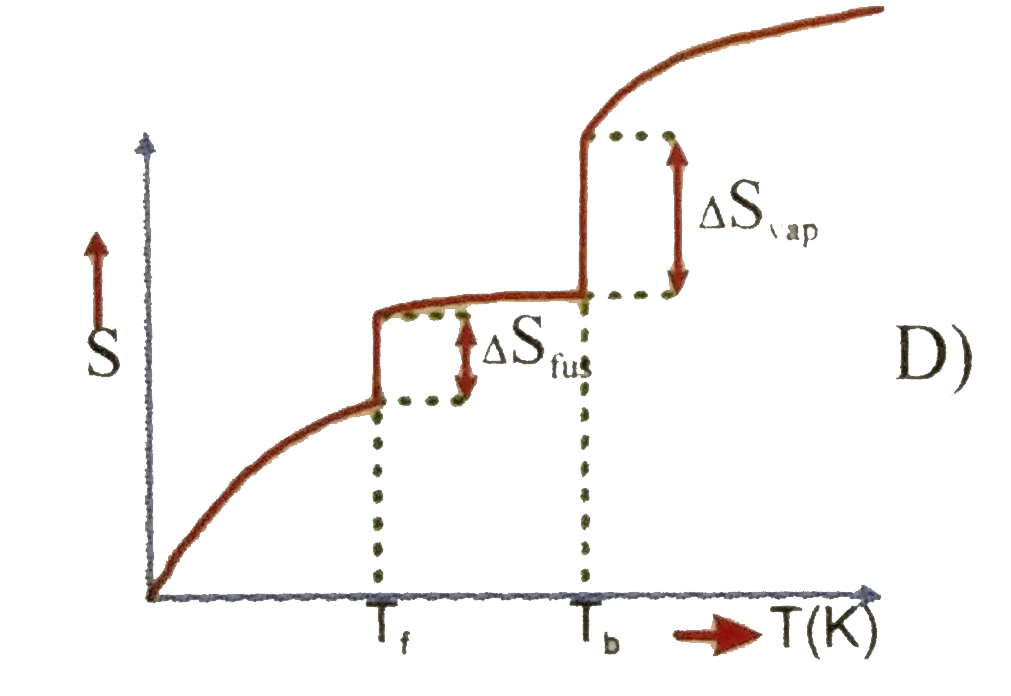 D
D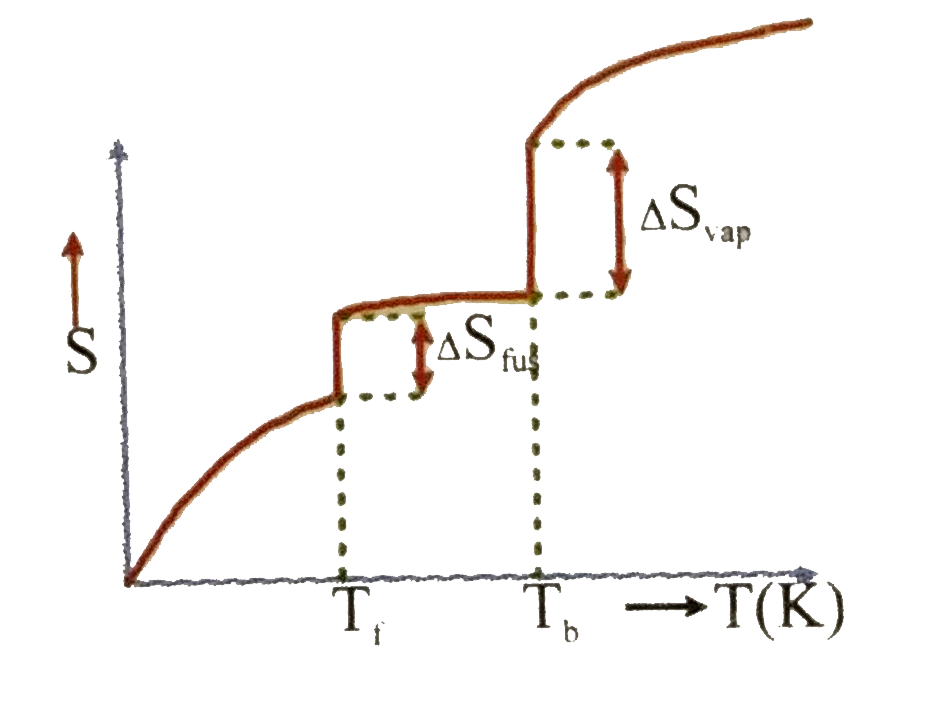
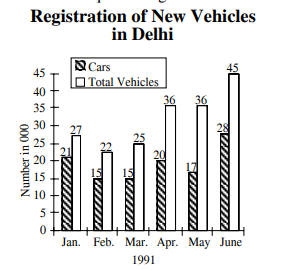
Each of the questions is based on the table given below -----
Which of the following graphs well illustrates expenditure for water supply and cleaning in the ratio of expenditure in public sector under various plannings ?
 A
A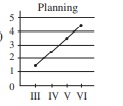 B
B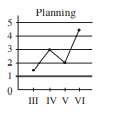 C
C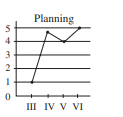 D
D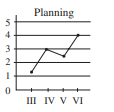
The following graph illustrates several phenomena that develop while a muscel is being repetitively stimulated :

______ (a)Treppe or staircase phenomenon
View SolutionThe following graph illustrates several phenomena that develop while a muscel is being repetitively stimulated :

____ (b)Fatigue
View SolutionWhich of the following pairs illustrates the law of multiple proportions?
View SolutionWhich of the following data illustrates the law of conservation of mass?
View SolutionWhich of the following statements illustrated the law of multiple proportions?
View Solution

