This graph represents:
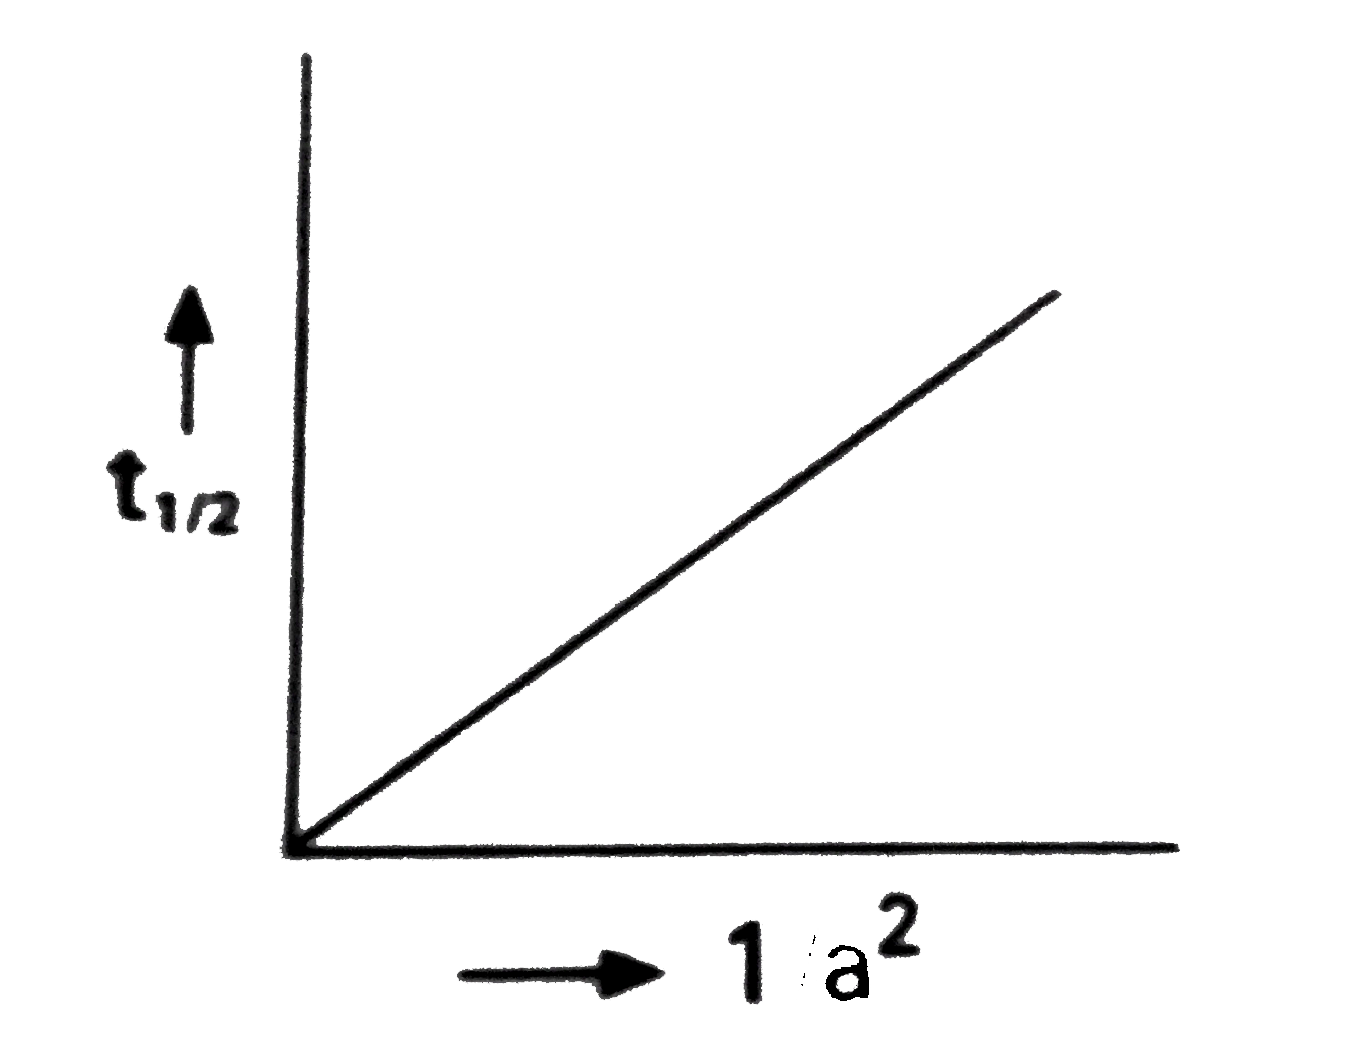
A
first order reaction
B
zero order reaction
C
second order reaction
D
third order reaction
Text Solution
The correct Answer is:D
|
Topper's Solved these Questions
- MISCELLANEOUS (TOPICS OF GENERAL INTEREST)BOOK - OP TANDONCHAPTER - MISCELLANEOUS (TOPICS OF GENERAL INTEREST)EXERCISE - SET-V: Matching type Questions
37 Videos
- INTRODUCTION TO ORGANIC CHEMISTRY BOOK - OP TANDONCHAPTER - INTRODUCTION TO ORGANIC CHEMISTRY EXERCISE - SINGLE INTEGER ANSWER TYPE
4 Videos
- OXIDATION AND REDUCTION (REDOX REACTIONS)BOOK - OP TANDONCHAPTER - OXIDATION AND REDUCTION (REDOX REACTIONS)EXERCISE - SECTION V
3 Videos
Similar Questions
Knowledge Check
Area under Speed-Time graph represents
ADistanceBAverage acceleration,CAccelerationDNone of these.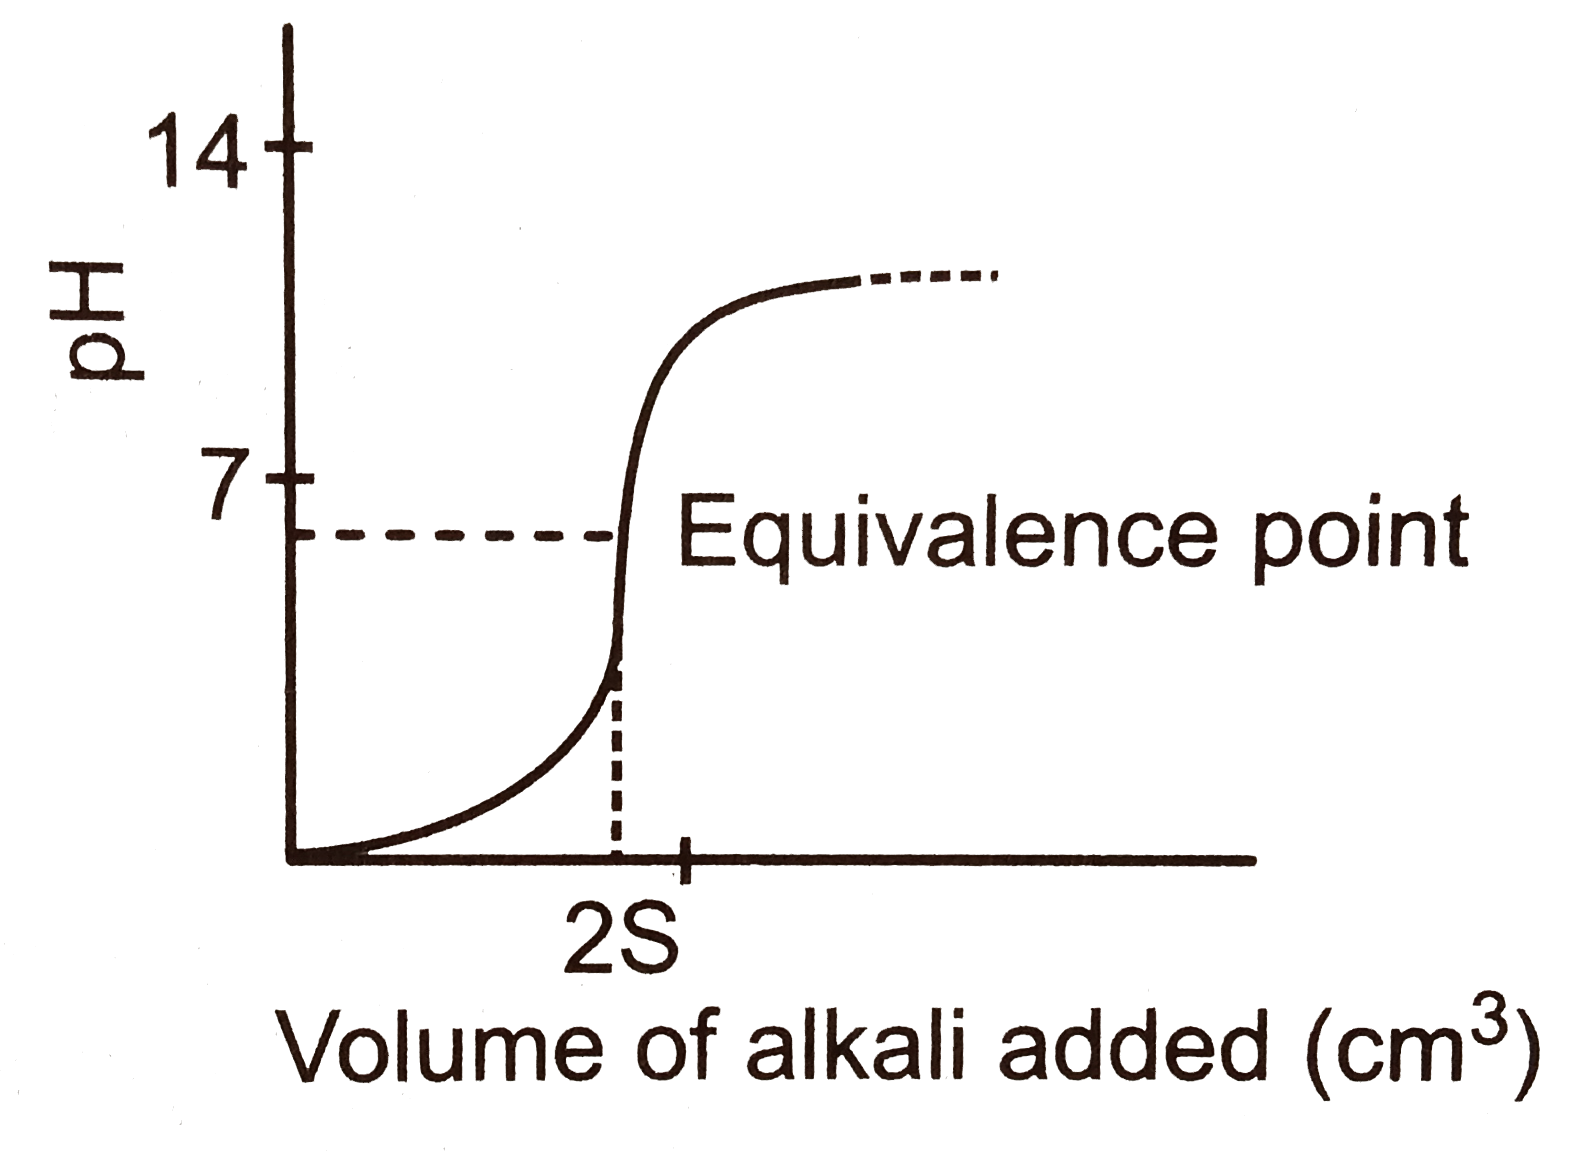
The graph represents the titration curve for :Astrong acid and strong baseBstrong acid and weak baseCweak acid and stong baseDweak acid and weak baseWhich graph represents an objects at rest ?
A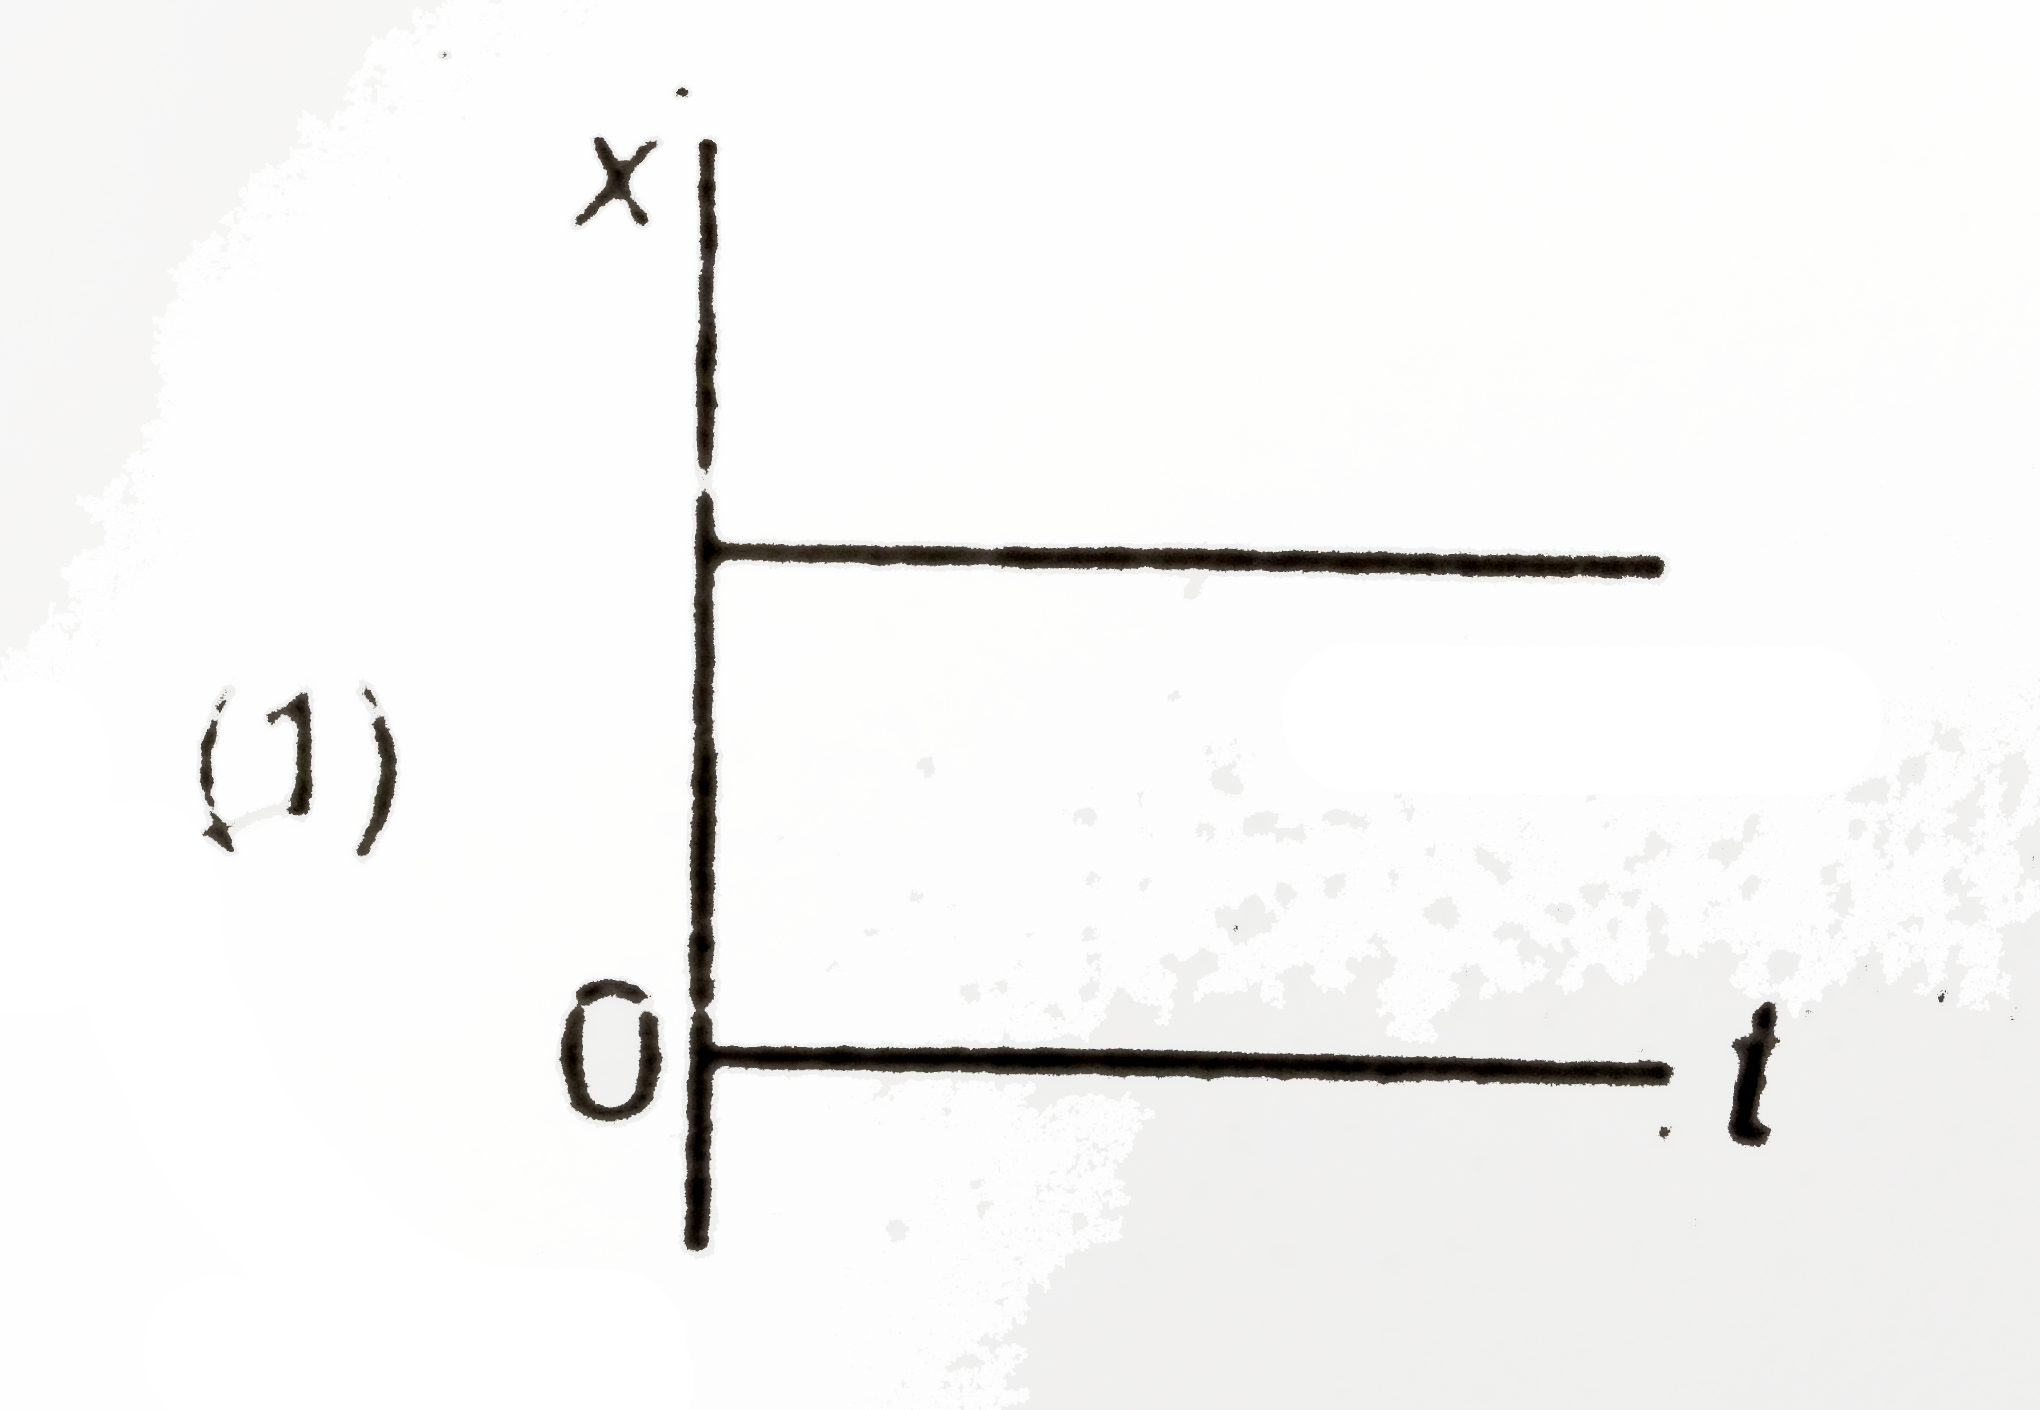 B
B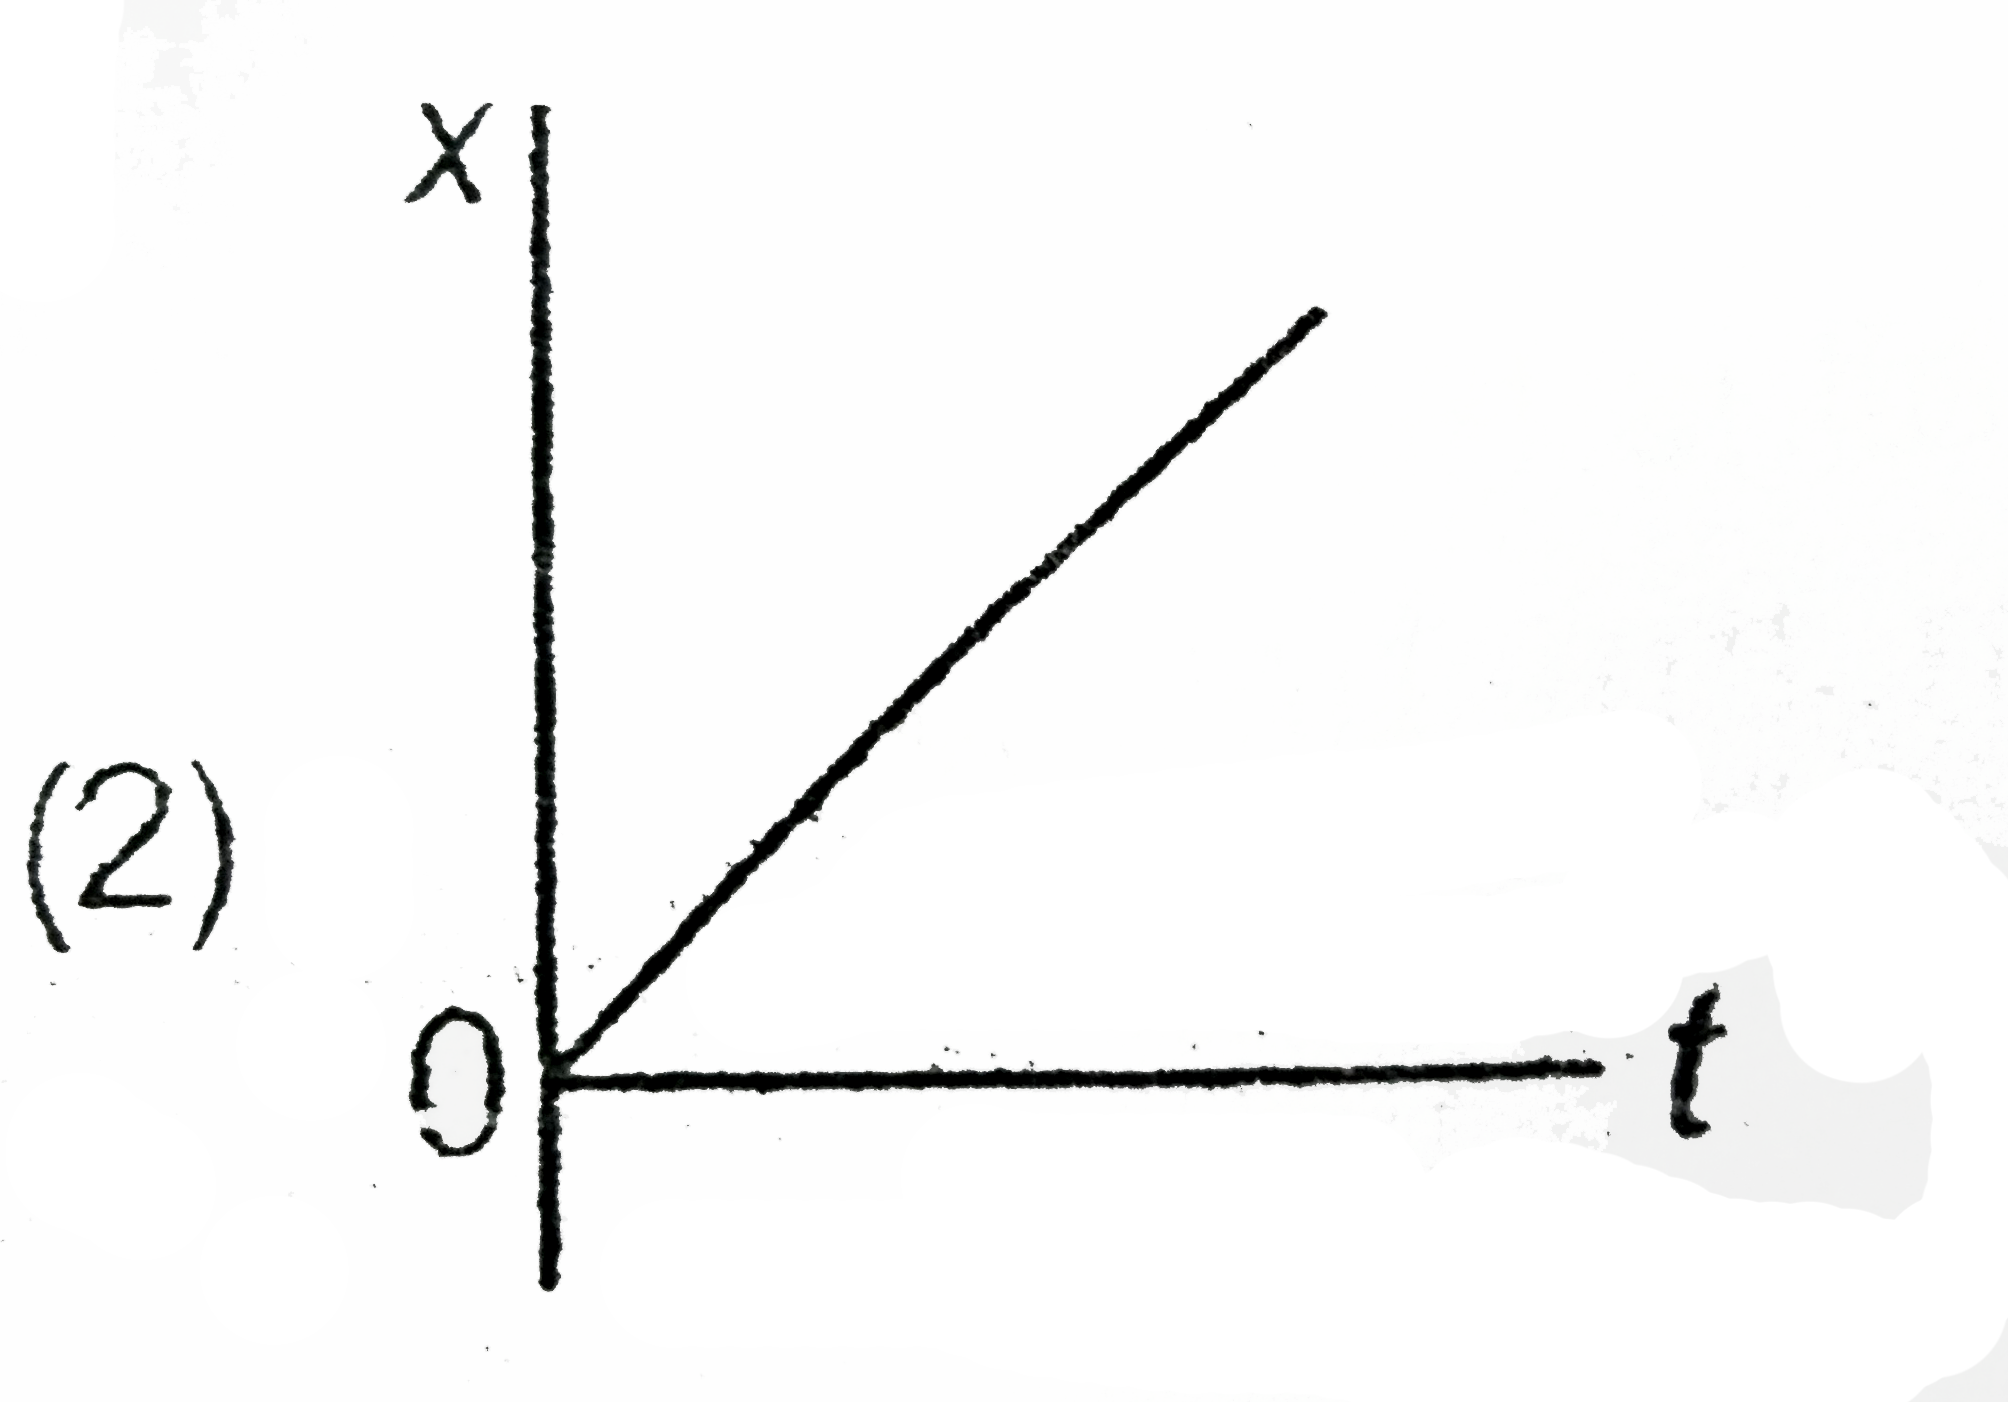 C
C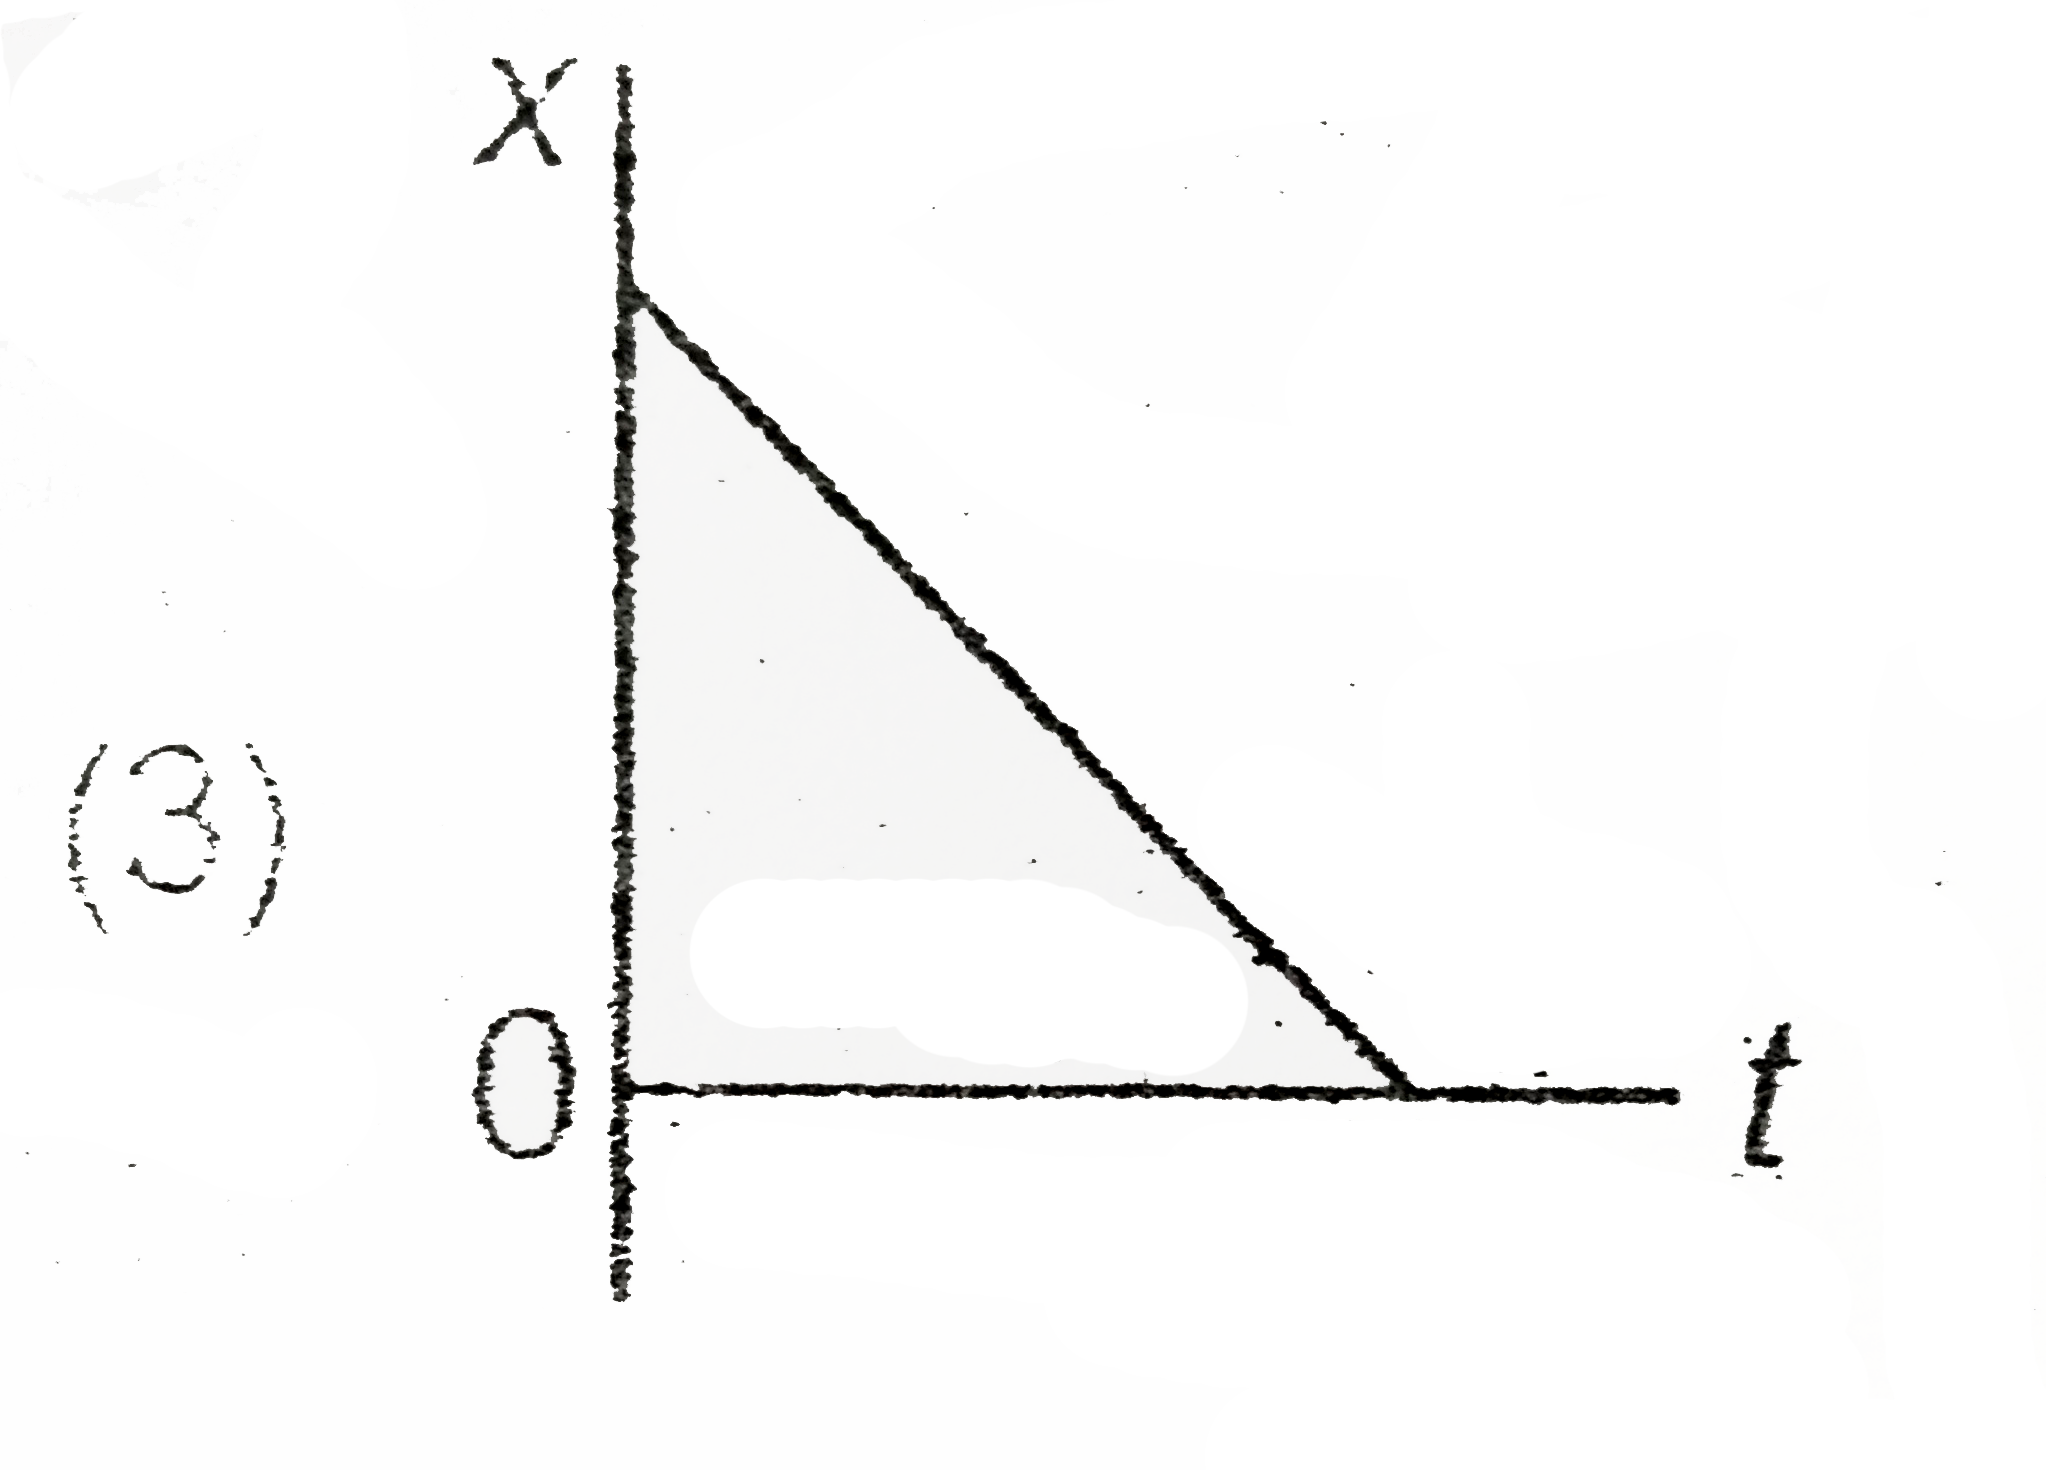 D
D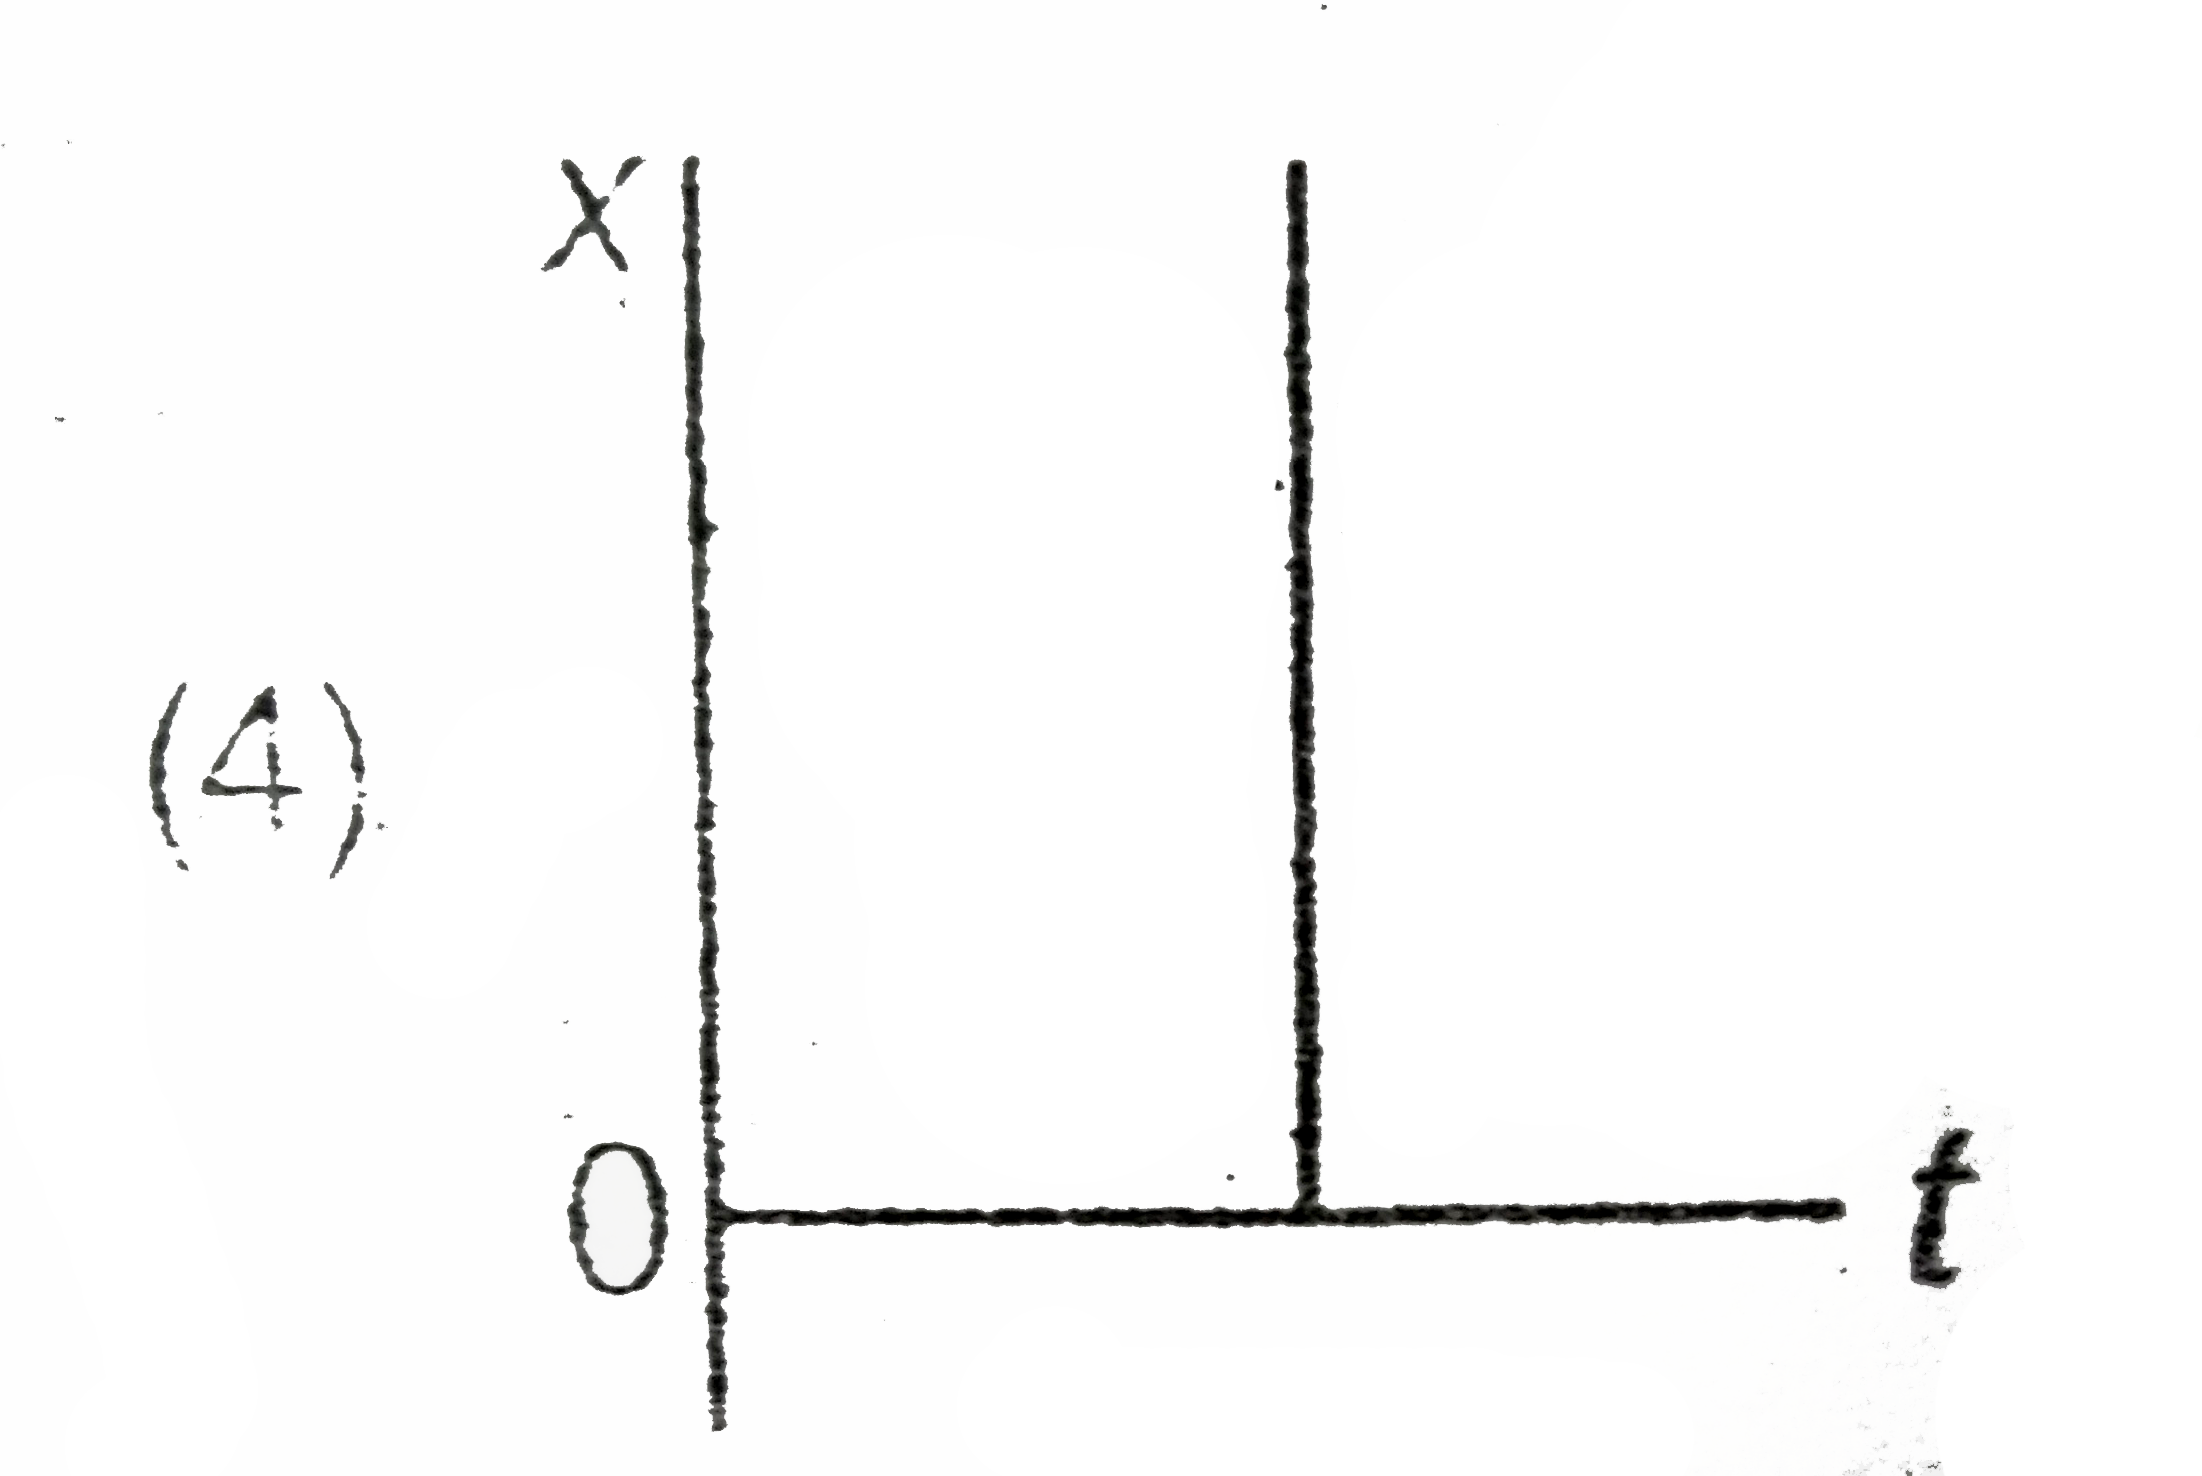
Which graph represents positive acceleration ?
View SolutionWhich graph represents the uniform acceleration
View SolutionIn the given curve total area under the graph represents:
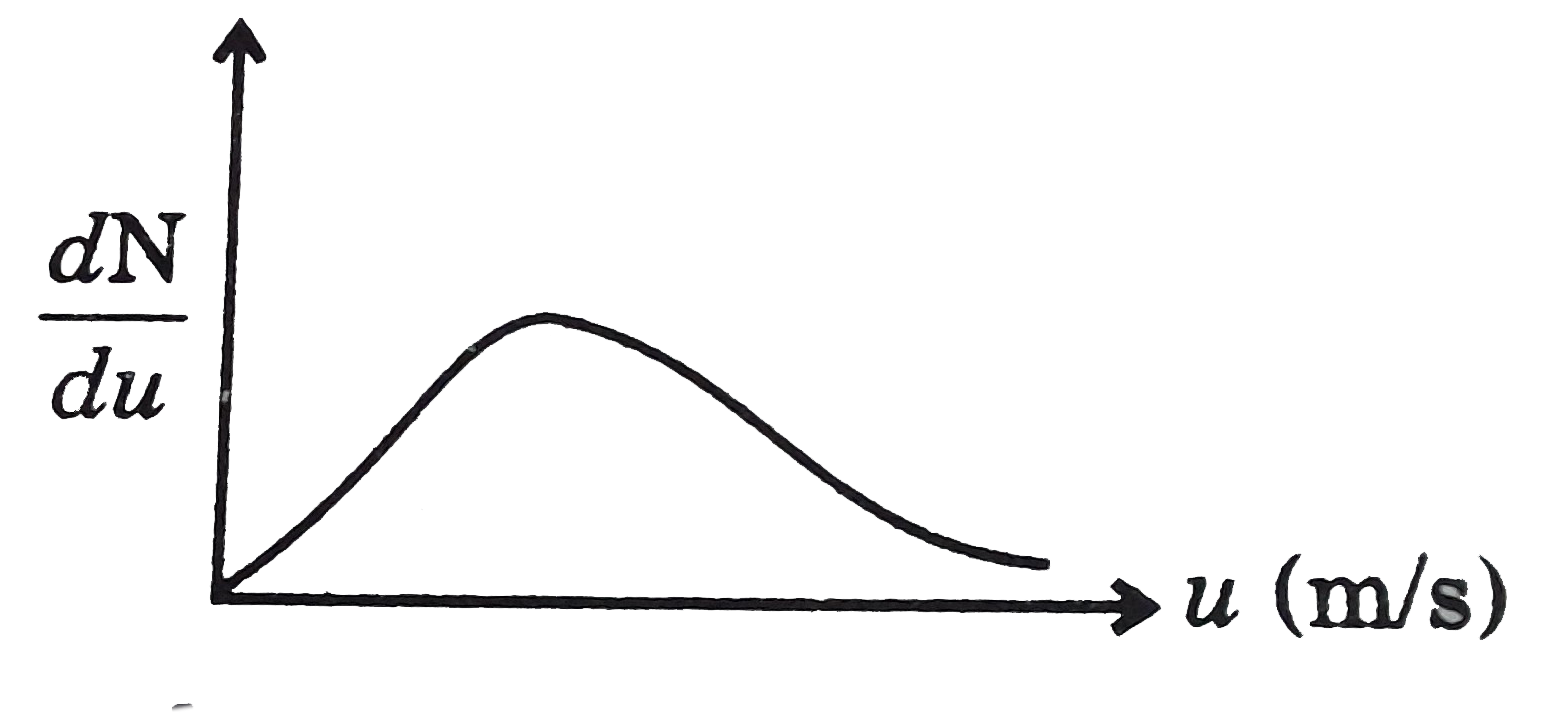
View SolutionThe area under a Velocity-Time graph represents ______________.
View SolutionThe area of the shaded portion of the graph represents :
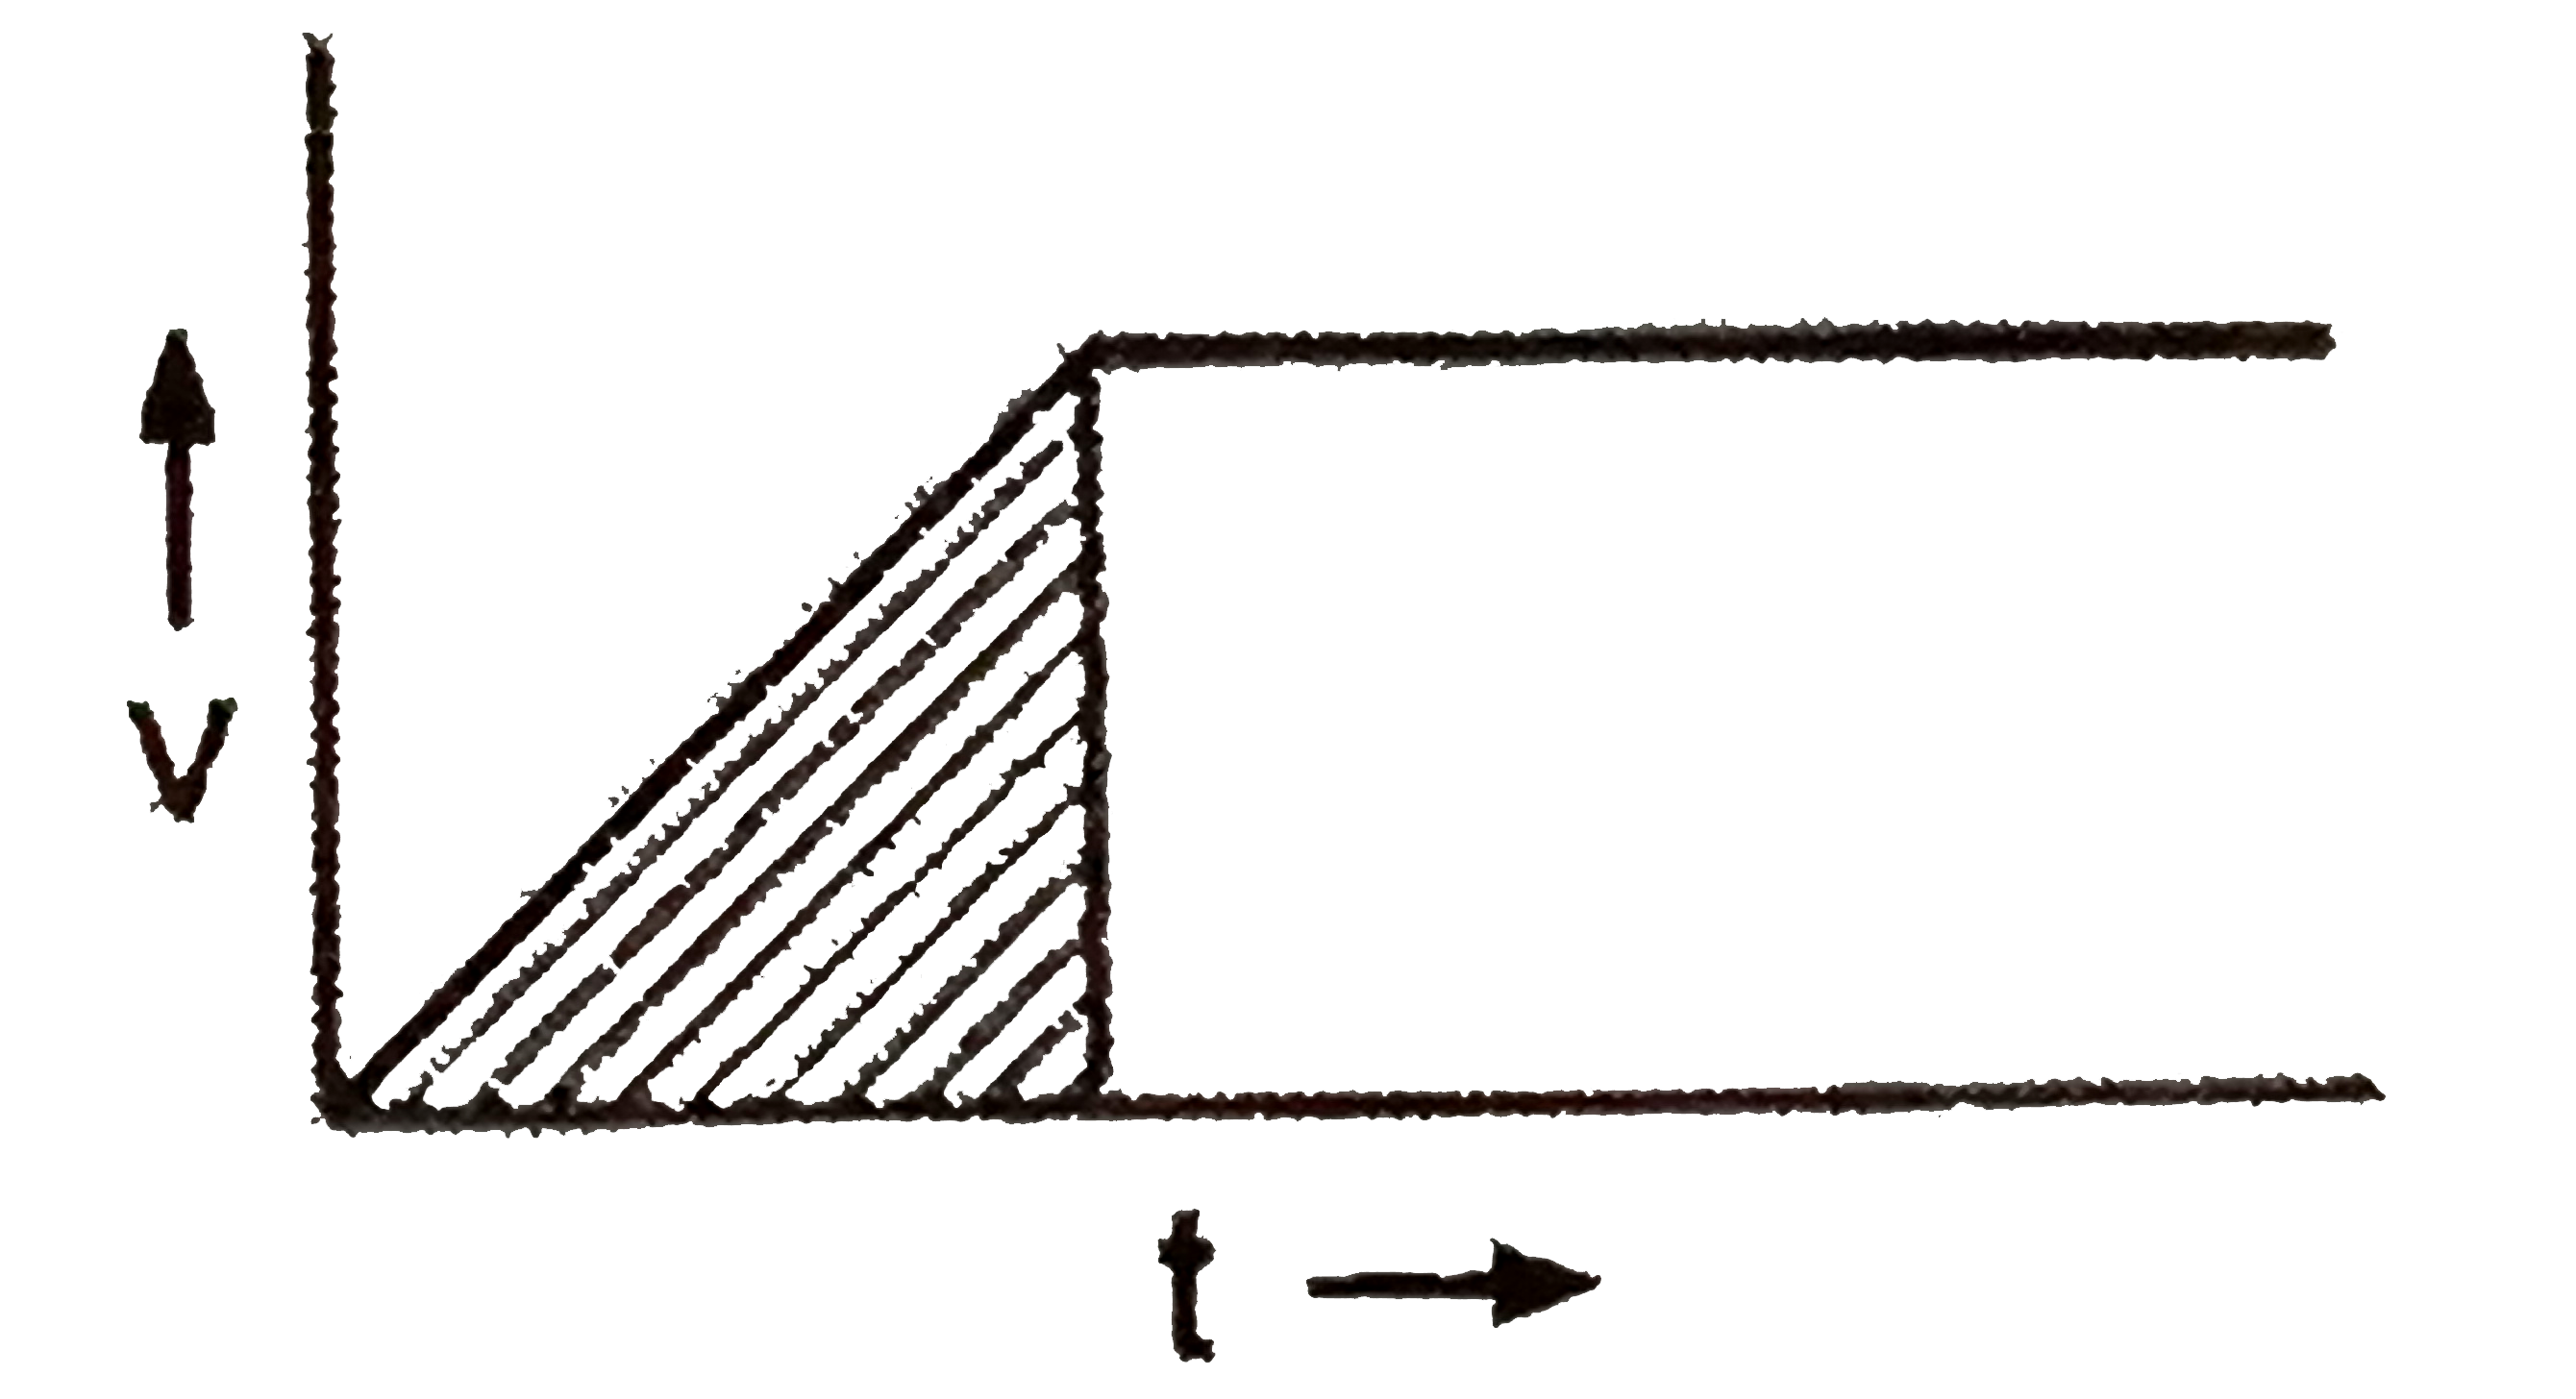
View Solution
