The following table shows the ages of the students during a year are :

Find the mode.Solution in Punjabi
Step by step video & image solution for The following table shows the ages of the students during a year are : Find the mode. by Chemistry experts to help you in doubts & scoring excellent marks in Class 8 exams.
Topper's Solved these Questions
Similar Questions
List conditions under which combustion can take place.
03:22View SolutionThe following table shows the ages of the patients admitted in a hospital during a year:Find the mode and the mean of the data given above. Compare and interpret the two measures of central tendency.
04:26View SolutionThe following table shows the marks obtained by 100 students of Class X in a school during a particular academic session.Find the mode of this distribution.
01:10View Solution20 छात्राओ की औसत आयु 15 वर्ष है तथा 25 छात्रो की औसत आयु 24 वर्ष है, तो छात्र तथा छात्राओ की औसत आयु ज्ञात करे?
03:17View SolutionThe following table expresses the age of eight students . Find the median age.
S. No.12345678Age (Years)1816141113109207:40View Solutionनिम्नलिखित सारणी किसी अस्पताल में एक विशेष वर्ष में भर्ती हुए रोगियों की आयु को दर्शाती हैं :

उपरोक्त आँकड़ों से बहुलक ज्ञात कीजिए।02:26View SolutionThe following frequency dsitribution table gives the ages of 80 patients treated in a hospital during a month. Find the mode of the ages of the patients.
 03:07View Solution
The following table shows ages of people who went to a particular play of circus in a day.

Find the mode of the ages of the vistiors.07:34View SolutionThe following table shows the ages of the patients admitted in a hospital during a year :
Age (in years)Number of patients5−15615−251125−352135−452345−551455−655
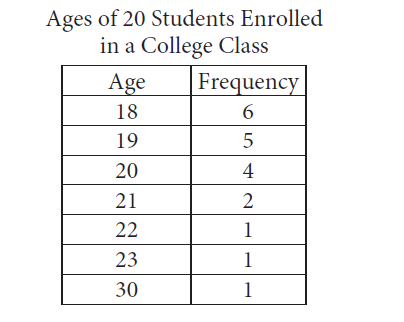
Find the mode and the mean of the data given above . Copmare and interpret the two measures of central tendency .02:01View SolutionAges of 20 Students Enrolled in a College Class

The table above shows the distribution of ages of the 20 students enrolled in a college class. Which of the following gives the correct order of the mean, median, and mode of the ages?05:20View SolutionThe following table shows the ages of the patients admitted in a hospital during a year:

Find the mode and the mean of the data given above. Compare and interpret the two measures of central tendency.01:39View SolutionThe ages (in years) of 11 cricket players are given below
28,34,32,41,36,32,32,38,32,40,31
Find the mode of the age06:35View SolutionThe following table shows the ages of the patients admitted in a hospital during a year:Find the mode and the mean of the data given above. Compare and interpret the two measures of central tendency.
02:46View SolutionThe following table shows the ages of the students during a year are :

Find the mode.04:27View SolutionThe following table shows ages of people who went to a particular
play of circus in a day.

Find the mode of the ages of the vistiors.02:10View Solutionअपनी कक्षा के साथियों की आयु वर्षों के रिकॉर्ड कीजिए और फिर उनका बहुलक ज्ञात कीजिए।
View Solution

