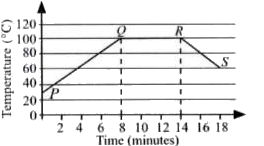
The given graph shows the change in temperature of water with time as it is brought to boil before being Ieft to cool.
Based on the graph, which of the following statements are correct?
(i) Evaporation only occurs from P to Q.
(ii) There is heat gain from P to R.
(iii) The water is boiled for 6 minutes.
(iv) Water exists in two different states between Q and R.

A
(i) and (ii) only
B
(ii) and (iv) only
C
(i) and (iii) only
D
(ii), (iii) and (iv) only
Video Solution
Text Solution
The correct Answer is:D
Evaporation can occur all temperatures. During boiling temperature remains constant so, it is boiling from 8 to 14 s. During this time, it exist in vapour and liquid phase simultaneously.
|
Updated on:21/07/2023
Topper's Solved these Questions
Similar Questions
Knowledge Check
- Question 1 - Select One
Which of the following feact only with boiling water ?
ABeBMgCCaDSr - Question 2 - Select One
The specific heat of water at boiling point is
AzeroBoneCinfinityDless than one - Question 3 - Select One
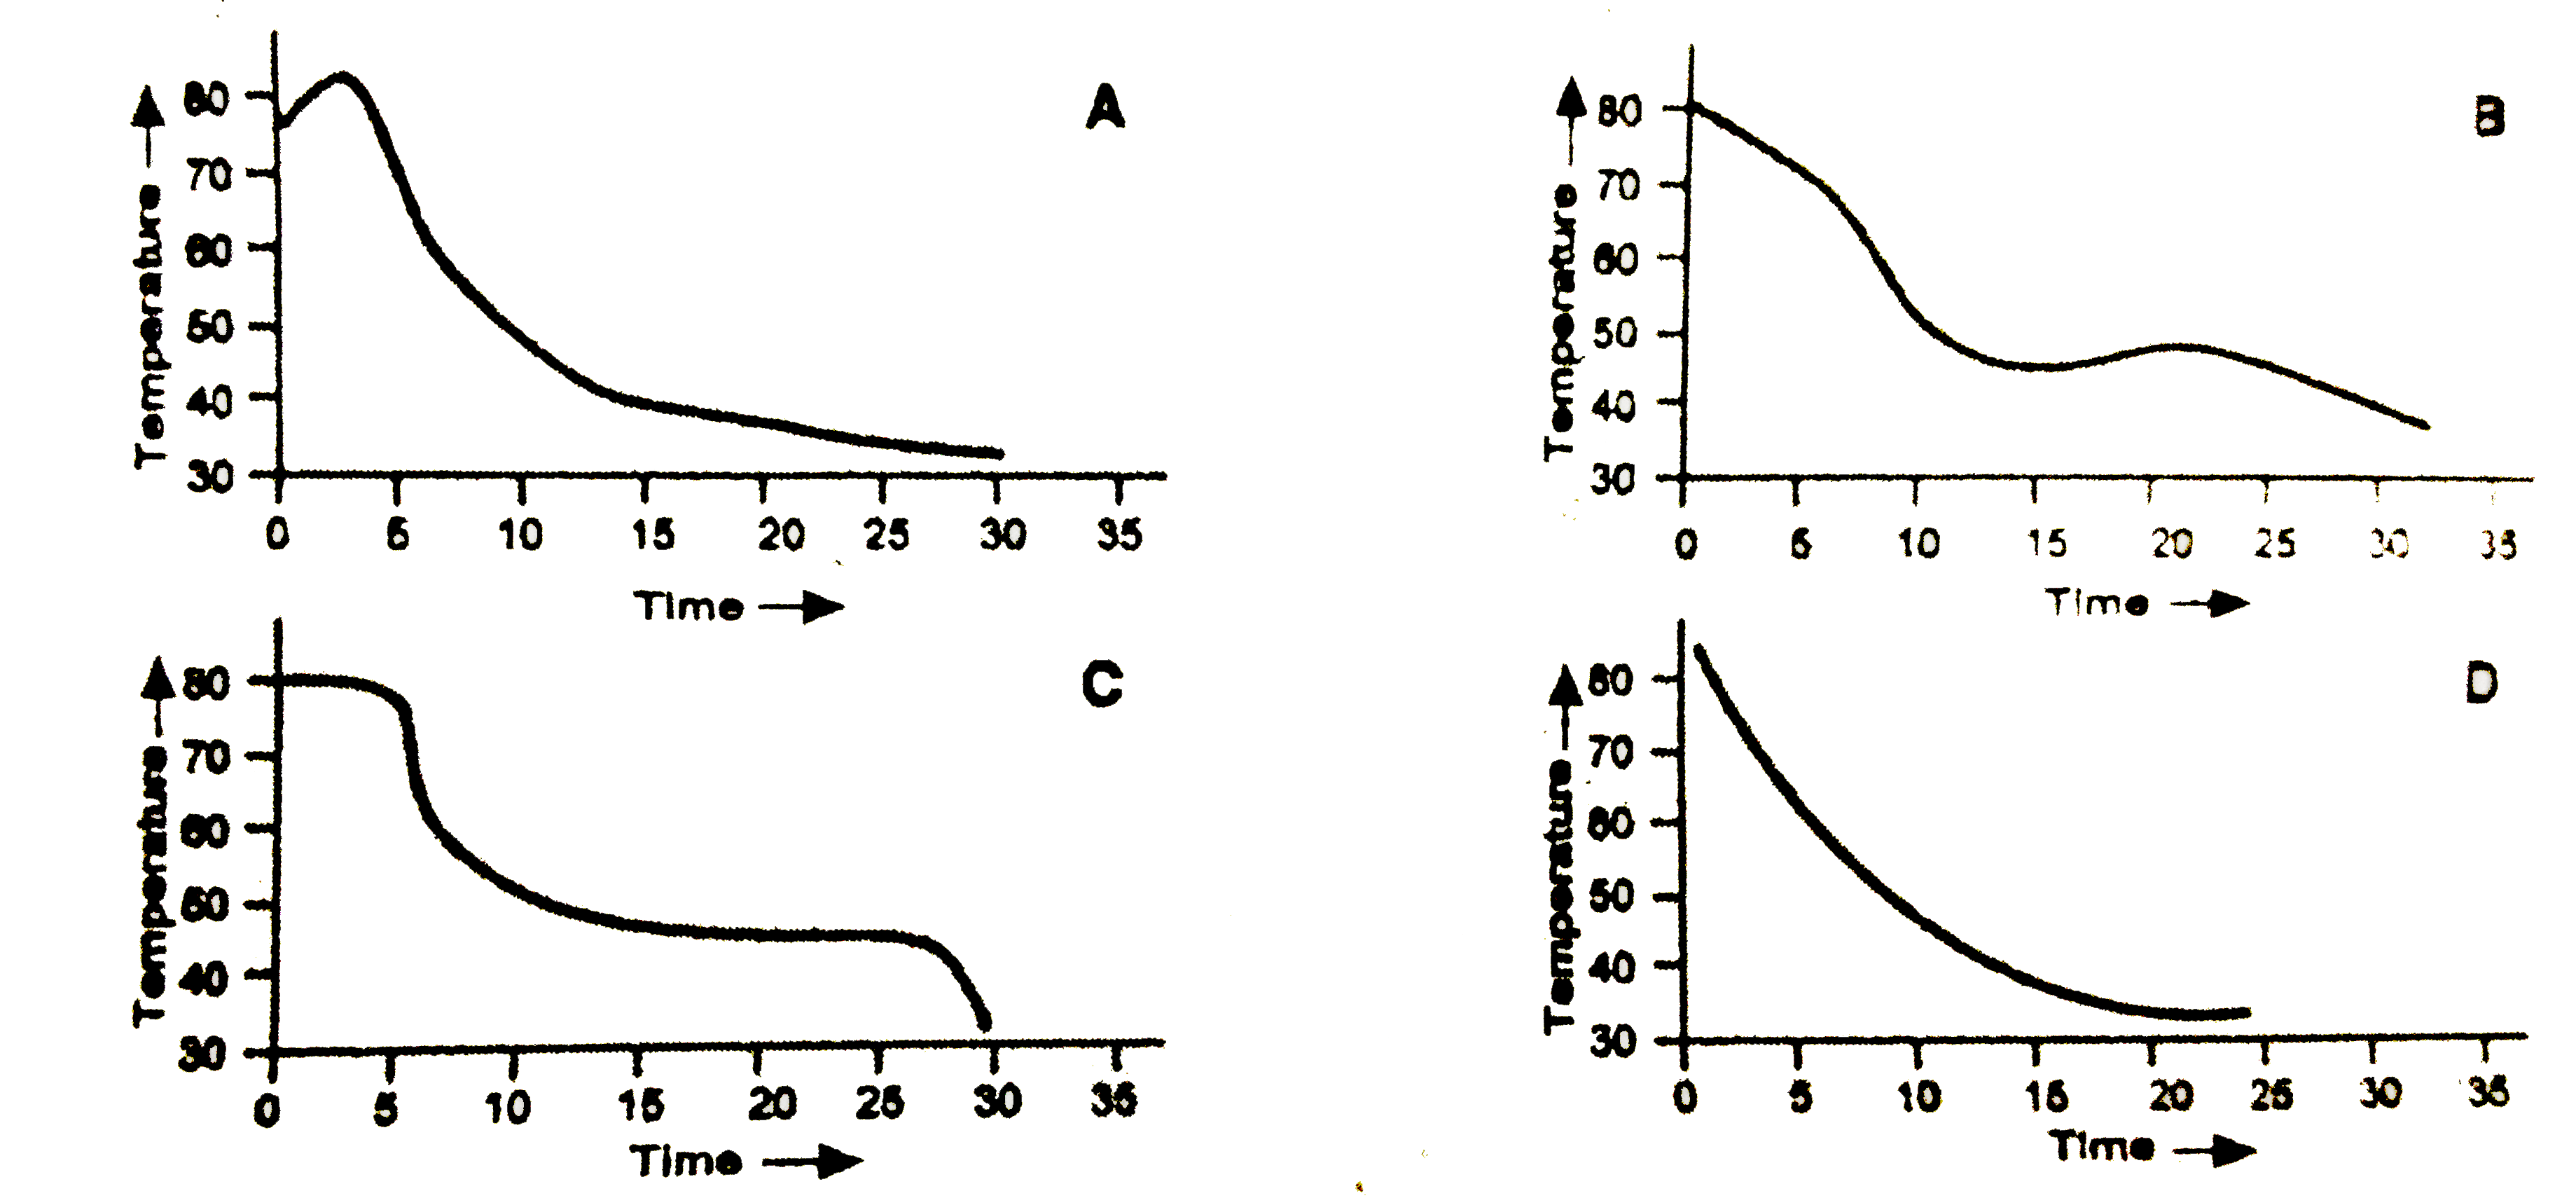
The temperature-time graph obtained when hot water is allowed to cool resembles the graph given in one of the following figures. The correct figure is:
 AABBCCDD
Which of the following statements are “true” ?
The evaporation of water takes place only in sunlight.( )View SolutionDraw the graph showing cooling of hot water with time.
View SolutionWhich of the following graphs represents rate of cooling of hot water?
View SolutionHow does the evaporation of water at ordinary temperature differ from that of boiling water ?
View SolutionThe increases in temperature of water above of water above its boiling point in the pressure cooker is due to change in ______
View Solution


