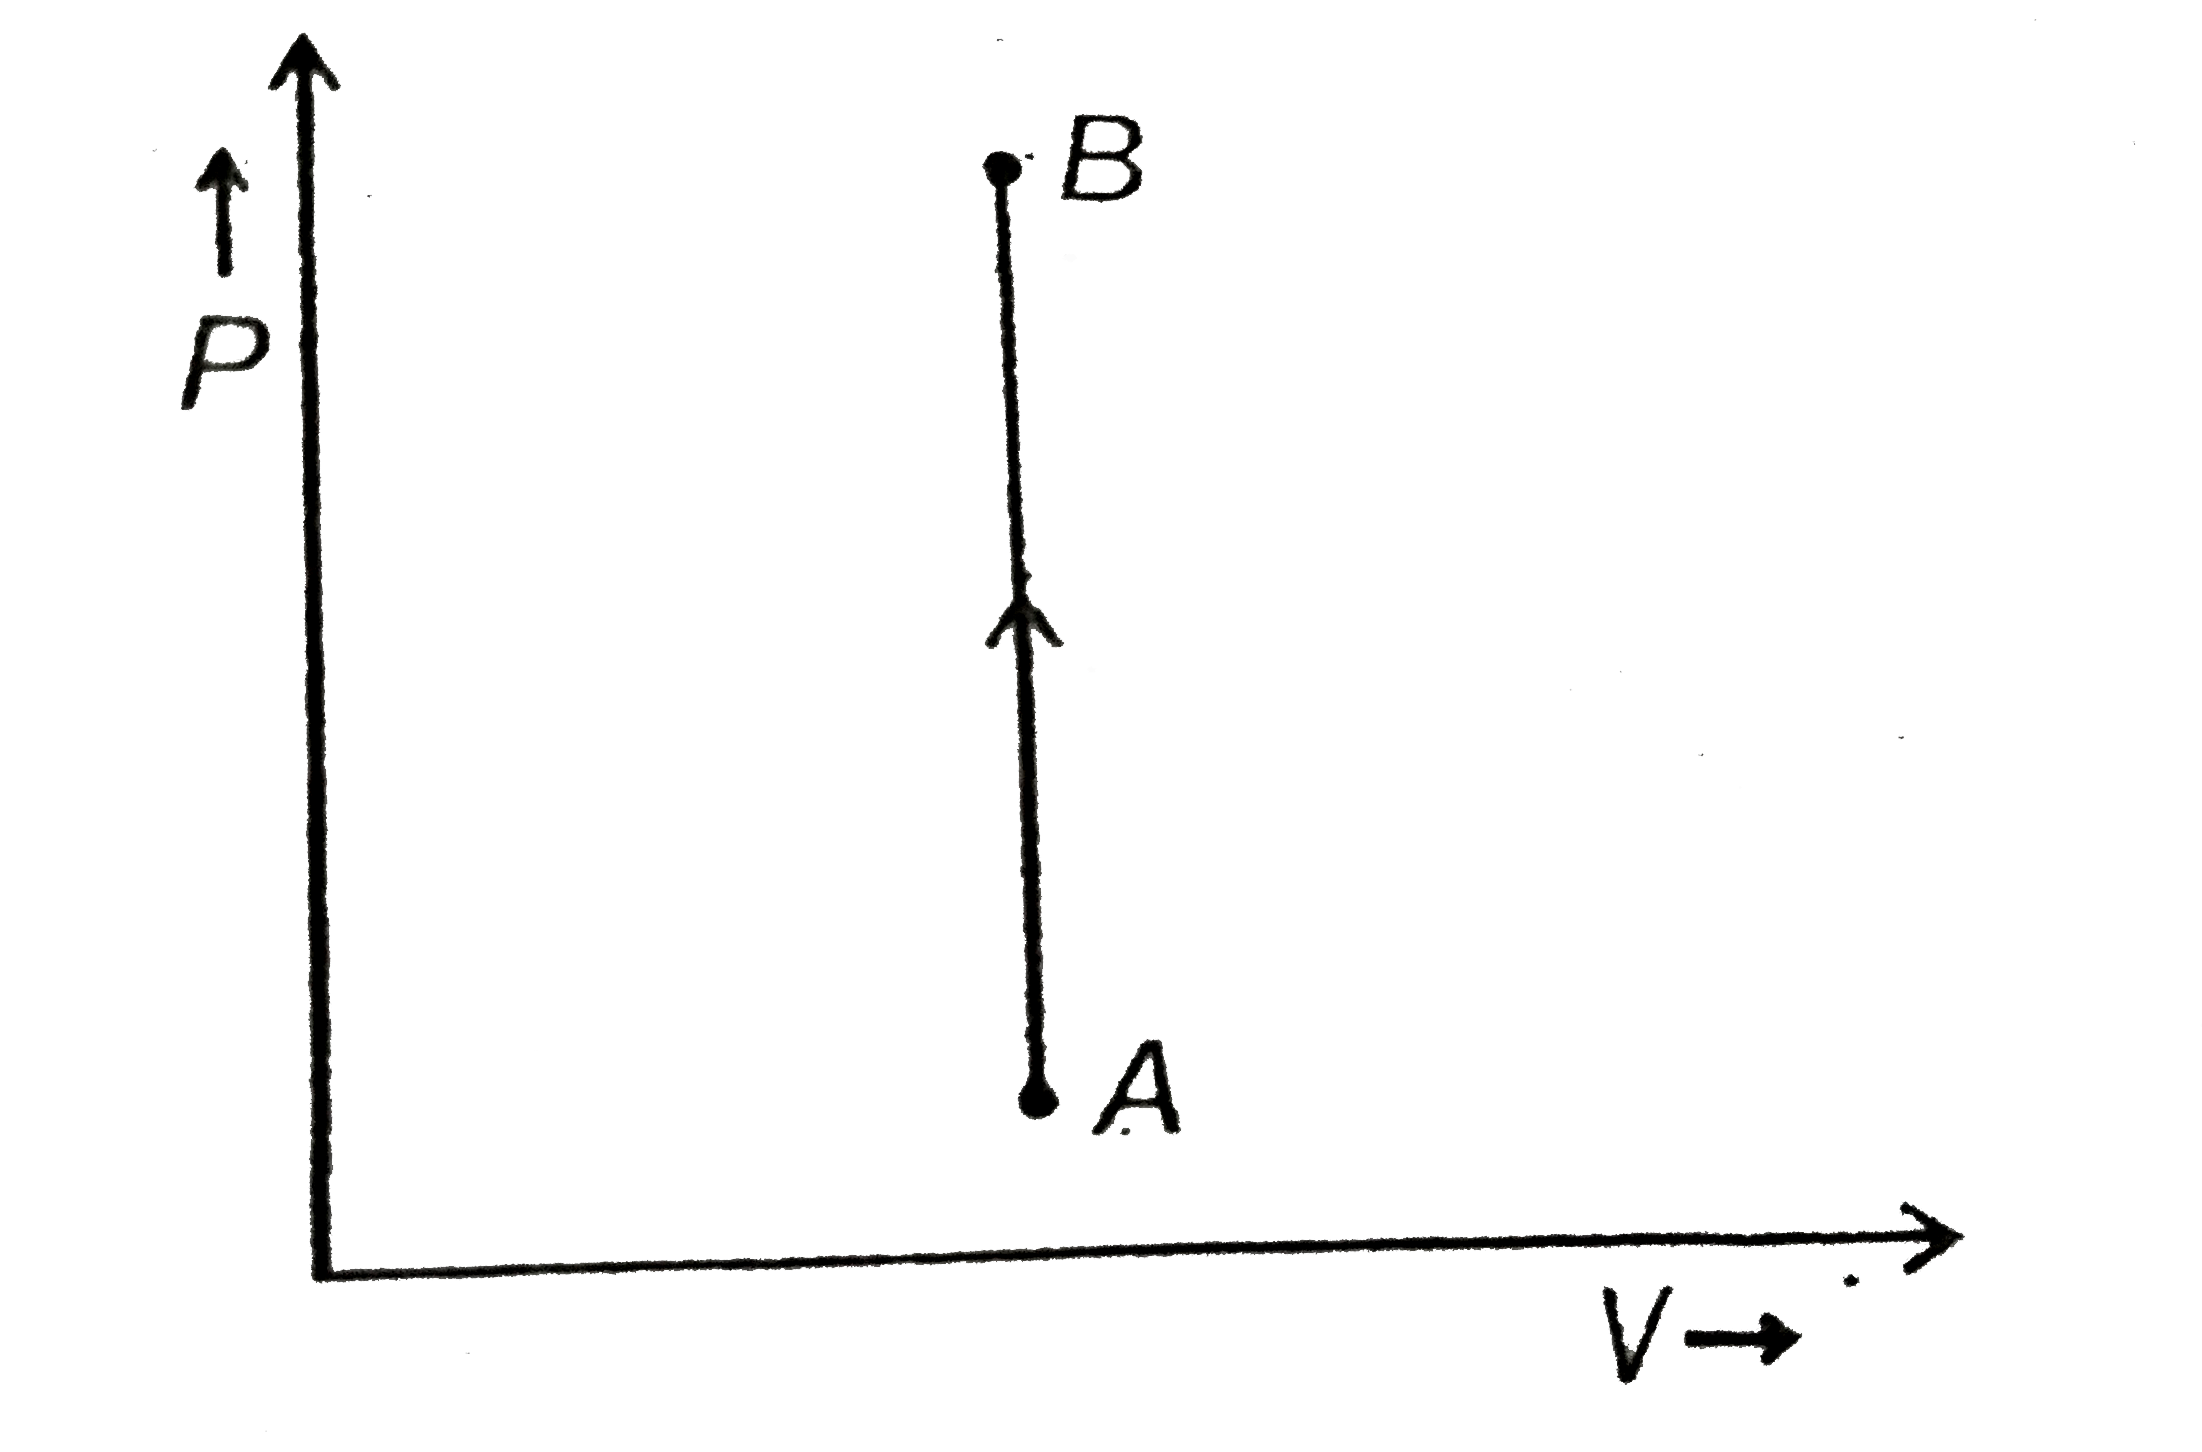
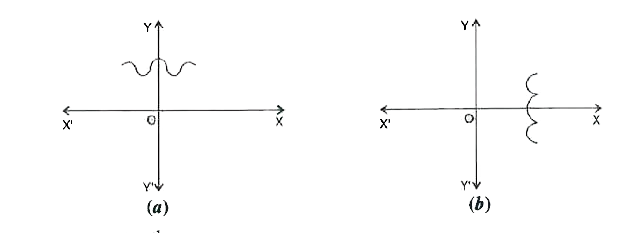
Which of the following graphs represents rate of cooling of hot water?


To determine which graph represents the rate of cooling of hot water, we can follow these steps:
Step 1: Understand the Concept of Cooling
When hot water cools, its temperature decreases over time. This is based on Newton's Law of Cooling, which states that the rate of cooling of an object is proportional to the difference in temperature between the object and its surroundings.
Step 2: Analyze the Graphs
We need to look at the graphs provided and determine which one shows a decrease in temperature over time. The x-axis typically represents time, while the y-axis represents temperature.
Step 3: Identify the Characteristics of Cooling Graphs
- A cooling graph will show a downward trend, meaning that as time progresses, the temperature should decrease.
- The graph should not be constant (horizontal line) or increasing (upward slope).
Step 4: Evaluate Each Graph Option
1. First Graph: If the temperature is constant, this cannot represent cooling.
2. Second Graph: If the graph shows a zigzag pattern with increases and decreases, it does not represent a consistent cooling trend.
3. Third Graph: If the temperature is increasing, this is also incorrect as it does not represent cooling.
4. Fourth Graph: If this graph shows a steady decrease in temperature over time, it is likely the correct representation of cooling.
Step 5: Conclusion
After evaluating all the options, the fourth graph, which shows a continuous decrease in temperature over time, represents the rate of cooling of hot water.
Final Answer
The fourth graph represents the rate of cooling of hot water.
---
When hot water cools, its temperature decreases over time. This is based on Newton's Law of Cooling, which states that the rate of cooling of an object is proportional to the difference in temperature between the object and its surroundings.
We need to look at the graphs provided and determine which one shows a decrease in temperature over time. The x-axis typically represents time, while the y-axis represents temperature.
- A cooling graph will show a downward trend, meaning that as time progresses, the temperature should decrease.
- The graph should not be constant (horizontal line) or increasing (upward slope).
1. First Graph: If the temperature is constant, this cannot represent cooling.
2. Second Graph: If the graph shows a zigzag pattern with increases and decreases, it does not represent a consistent cooling trend.
3. Third Graph: If the temperature is increasing, this is also incorrect as it does not represent cooling.
4. Fourth Graph: If this graph shows a steady decrease in temperature over time, it is likely the correct representation of cooling.
After evaluating all the options, the fourth graph, which shows a continuous decrease in temperature over time, represents the rate of cooling of hot water.
The fourth graph represents the rate of cooling of hot water.
Topper's Solved these Questions
- HEATBOOK - BEIITIANSCHAPTER - HEATEXERCISE - Conceptive Worksheet
15 Videos
- HEATBOOK - BEIITIANSCHAPTER - HEATEXERCISE - Summative Worksheet
14 Videos
- ELECTRIC CURRENT AND ITS EFFECTSBOOK - BEIITIANSCHAPTER - ELECTRIC CURRENT AND ITS EFFECTSEXERCISE - IIT JEE WORKSHEET (V. Matrix Matching)
3 Videos
- MEASUREMENTBOOK - BEIITIANSCHAPTER - MEASUREMENTEXERCISE - IIT JEE WORKSHEET (IV INTEGER TYPE)
1 Videos
Similar Questions
Knowledge Check
Which of the following graph represents e−x?
A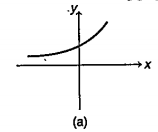 B
B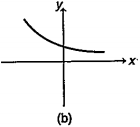 C
C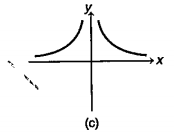 D
D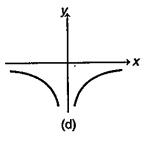
Which of the following graph represents e−x?
A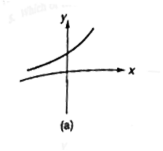 B
B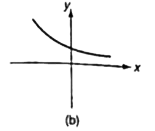 C
C D
D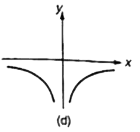
Which of the following graph represents 3s orbital
A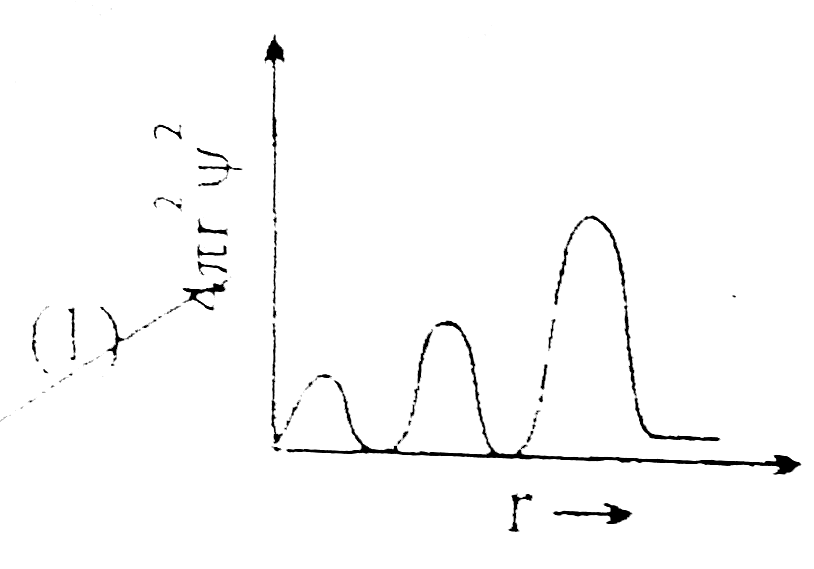 B
B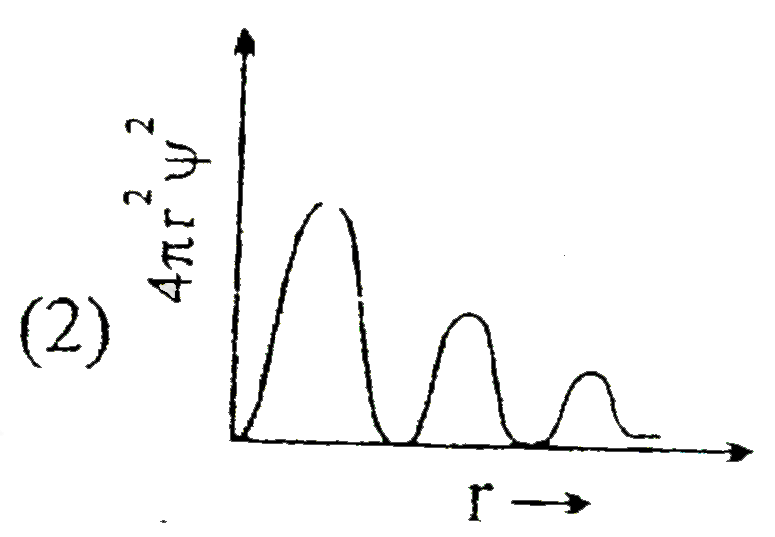 C
C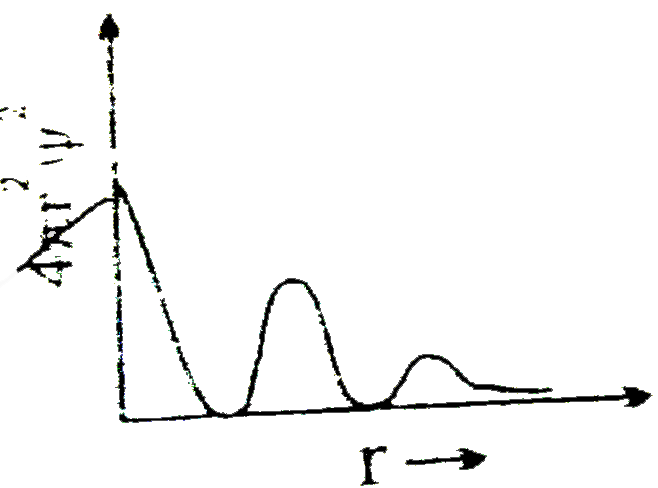 D
D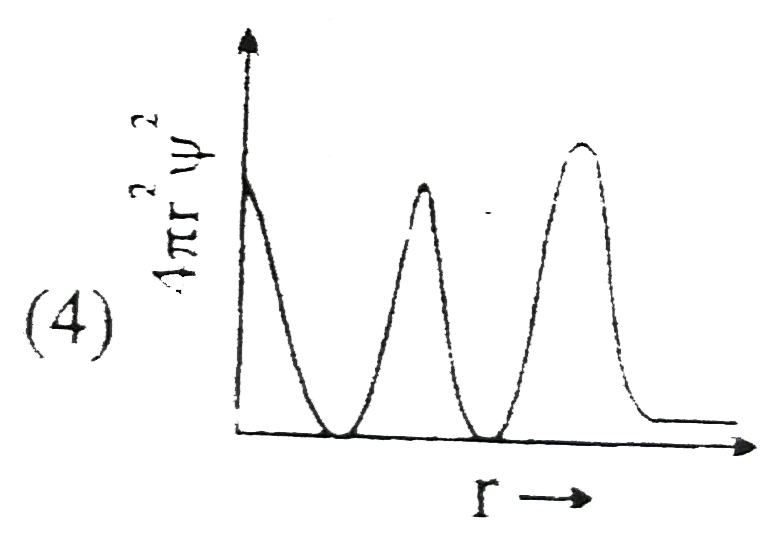
Which of the following graph represents Boyle's law ?
View SolutionWhich one of the following graphs represents motion?
View SolutionWhich of the following graph represents e−x?
View SolutionWhich of the following graph represent Boyle's law ?
View SolutionWhich of the following graph represents Boyle's law ?
View Solution

