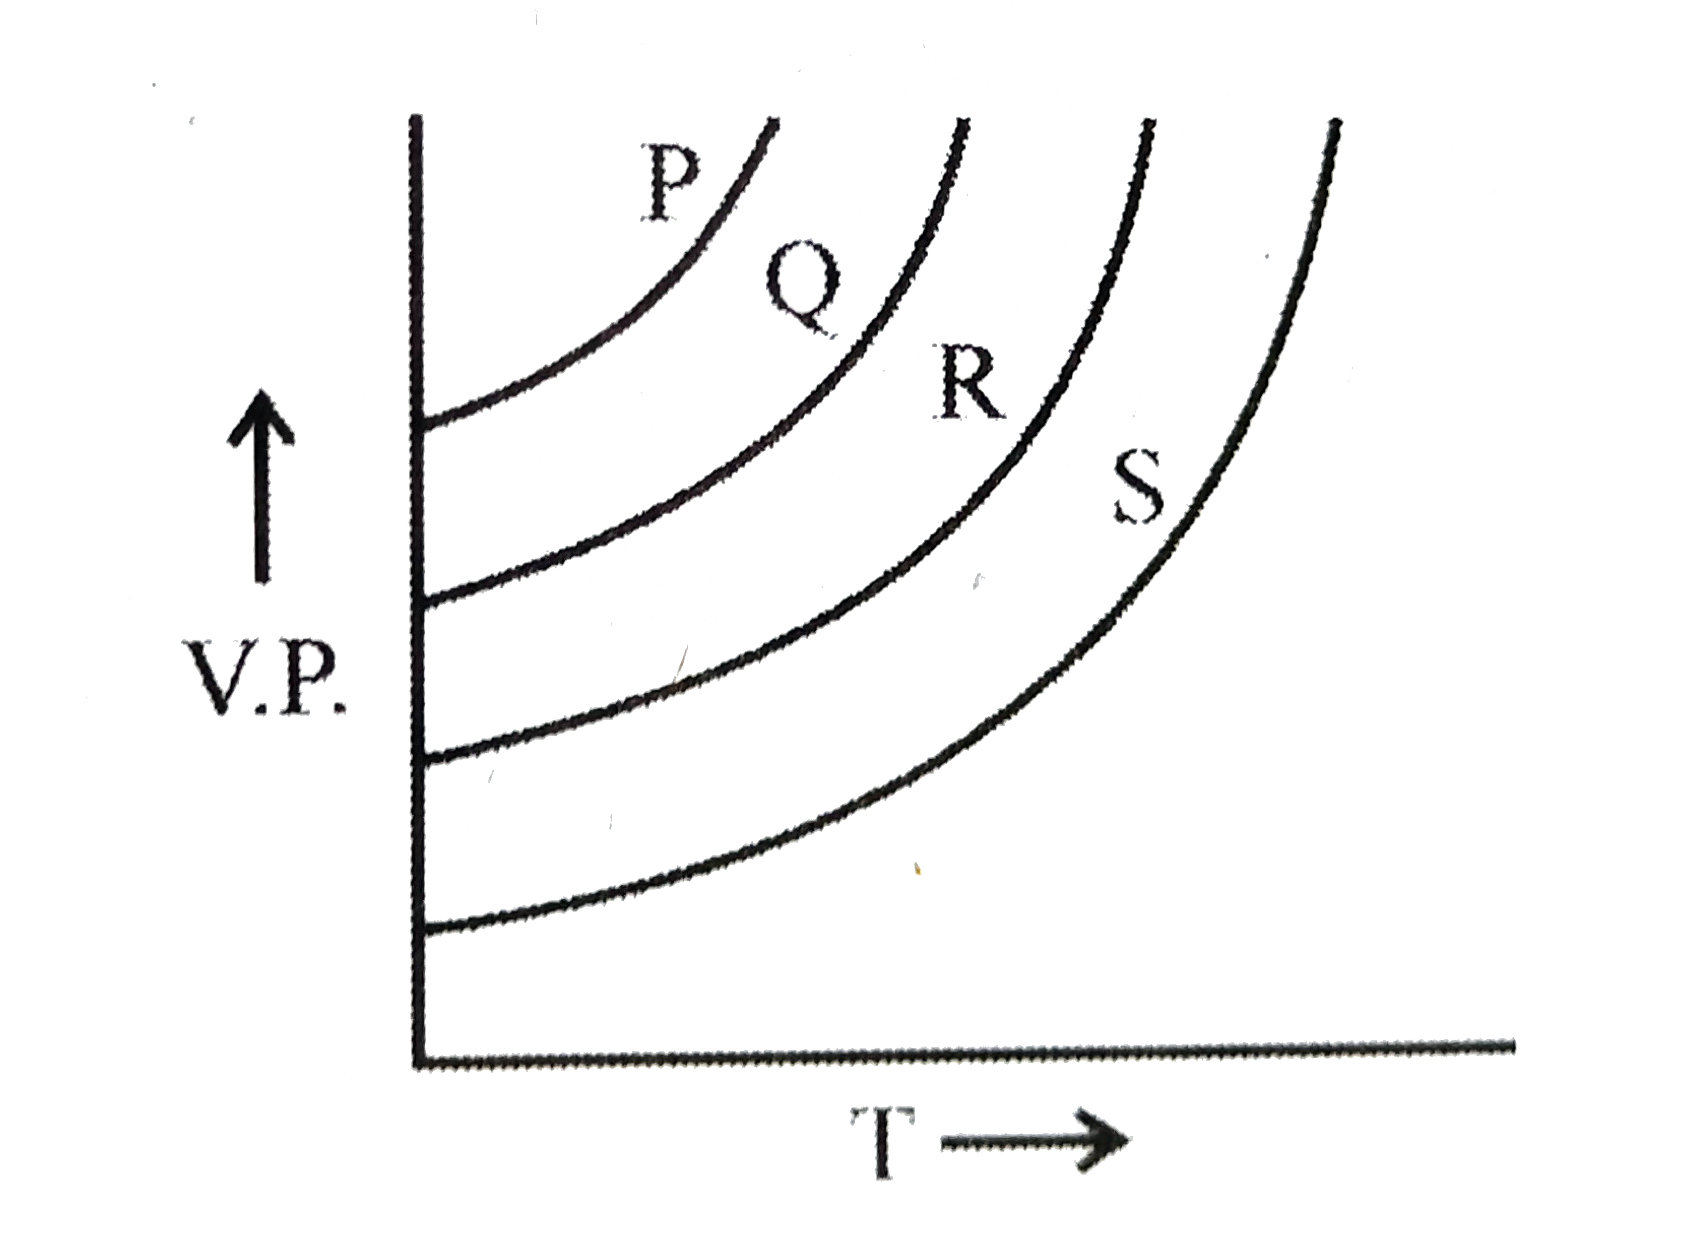
The given graph shows the vapour pressure -temperature curves for some liquids.Liquids P,Q,R and S respectively are

A
diethyl ether, acetone , ethyl alcohol,water
B
acetone, ethyl alcohol, diethyl ether, water
C
water, ethyl alcohol, acetone, diethyl ether
D
ethyl alcohol, acetone, diethyl ether,water
Video Solution
Text Solution
The correct Answer is:A
The vapour pressure increases with increase intermolecular forces. When the forces are weak, the liquid has high volatility and maximum vapour pressure.Diethyl ether has highest vapour pressure while water has lowest vapour pressure.
|
Topper's Solved these Questions
Similar Questions
Knowledge Check
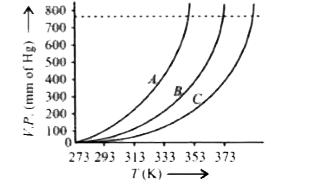
 The given graph shows the vapour pressure- temperature curves for some liquids.
Liquids A,B,C, and D respectively areAdiethyl ether, acetone, ethyl alcohol, whaterBacetone, ehtyl alcohol, diethyl ether, waterCwater, ethyl alcohol, acetone, diethyl etherDethyl alcohol, acetone, diethyl eher, water.Vapour pressure of a liquid depends upon its
Athe amount on the liqiud takenBthe temperature of ht liquidCboth on the amount as well as temperatureDneither the amount nor the temperature but only on the nature of the liquidVapour pressure of a liquid depends on
AVolume of containerBAmount of liquidCSurface area of containerDTemperature
The vapour pressure of a liquid in a closed container depends upon
View SolutionThe vapour pressure of a give liquid will decrease if :
View SolutionThe vapour pressure of a given liquid will increase if
View SolutionA graph between vapour pressure and temperature of few liquids is given below. Study the graph and answer following question.

Which of the following statements is not true?
View SolutionIf the total vapour presure of the liquid mixtureAandBis given by the equation:P=180XA+90then the ratio of the vapour pressure of the pure liquids A and B is given by :
View Solution