The plot of In k v/s 1/T is linear with slope of :Solution in Punjabi
−Ea/R
Ea/R)
Ea/2.303R
−Ea/2.303R
The correct Answer is:A
Step by step video & image solution for The plot of In k v/s 1/T is linear with slope of : by Chemistry experts to help you in doubts & scoring excellent marks in Class 12 exams.
Topper's Solved these Questions
- BOOK - NARENDRA AWASTHICHAPTER - CHEMICAL KINETIC & NUCLEAR CHEMISTRYEXERCISE - Level 1 (Q.3 To Q.32)1videos
CHEMICAL KINETIC & NUCLEAR CHEMISTRY
- BOOK - NARENDRA AWASTHICHAPTER - CHEMICAL KINETIC & NUCLEAR CHEMISTRYEXERCISE - Level 1 (Q.33 To Q.62)2videos
CHEMICAL KINETIC & NUCLEAR CHEMISTRY
- BOOK - NARENDRA AWASTHICHAPTER - SURFACE CHEMISTRYEXERCISE - Level -21videos
SURFACE CHEMISTRY
Similar Questions
The following data pertain to reaction between A and B
S.No[A][B]RatemolL−1molL−1molL−1sec−1I1×10−22×10−22×10−4II2×10−22×10−24×10−4III2×10−24×10−28×10−4
Which of the following interference(s) can be drawn from the above data
(a) Rate constatnt of the reaction 10−4
(b) Rate law of reaction is k[A][B]
(c ) Rate of reaction increases four times on doubling the concentration of both the reactant Select the correct answer codes:
a) a,b and C
b) a and b
c) b and c
d) c alone01:03View Solutioncolumn Icolumn IIP.Zero order reaction1.t1/2α1[A]0Q.First order reaction2.t100%=[A]0/kR.second order reactions3.Involves at least two reactantsS.Pseudo unimolecular reaction4.[A]=[A]0e−kt
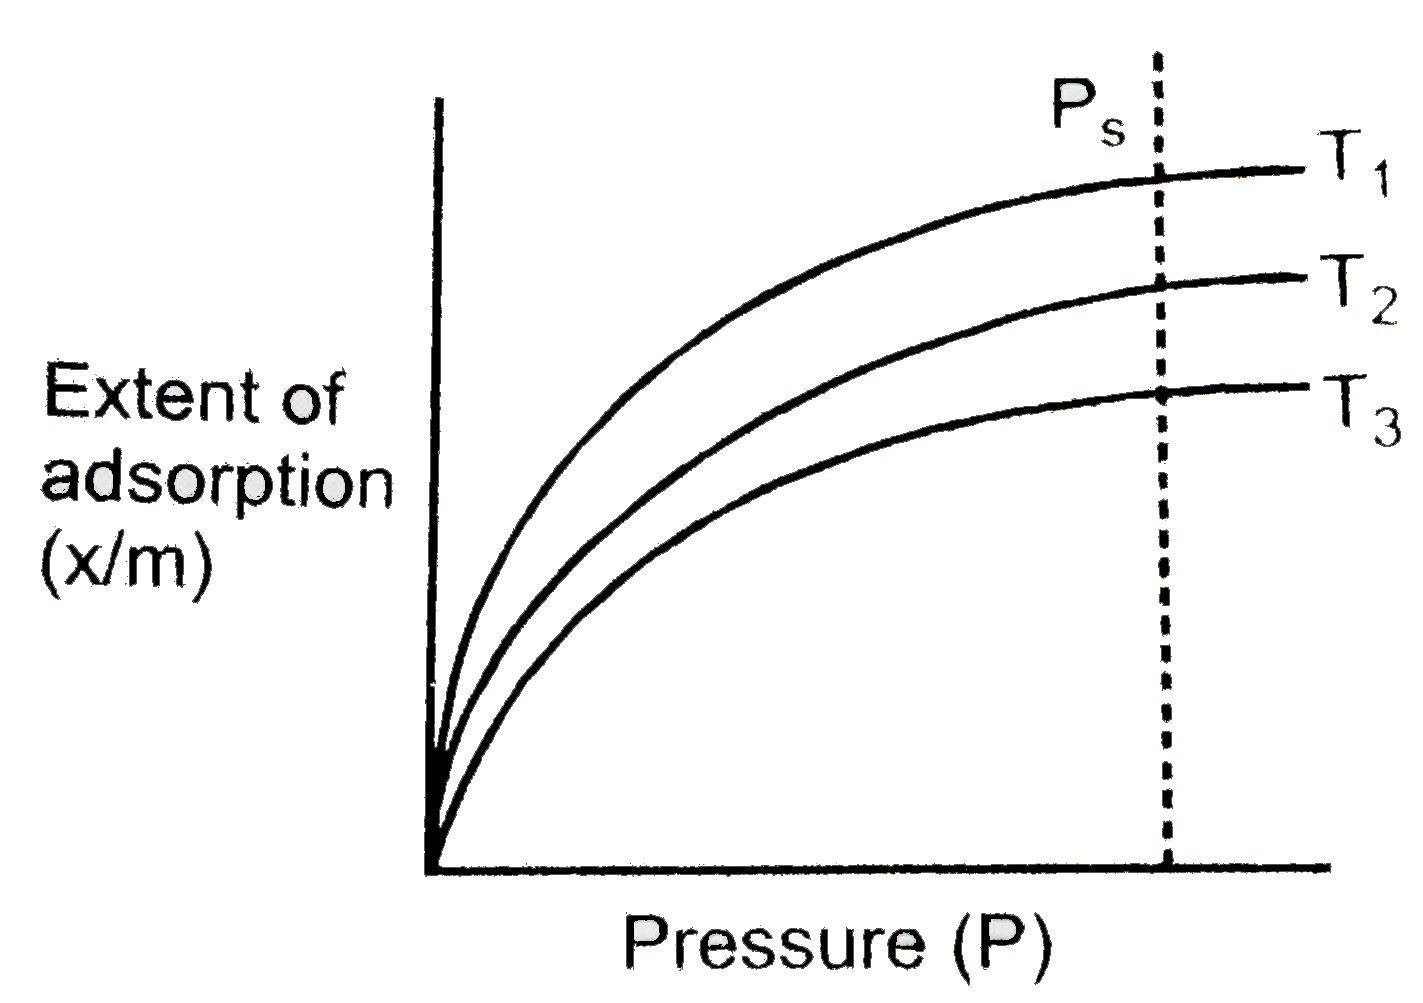
View Solutionfor the graph below, select correct order of temperture ?
 View Solution
The plot of In 1/T is linear with slope of :
03:20View SolutionA plot of k vs 1//T for a reaction gives the slope -1 xx 10^(4) K. The energy of activation for the reaction is:
View SolutionΔG∘ versus T plot the Ellingham 's diagram slopes downward for the reaction
View SolutionA plot of Ink v/s 1/T for a reaction gives the slope −1×10⁴k. The energy of activation for the reaction is (Given,R=8.314k−1 mol−1)
01:12View SolutionMatch the following column: {:("Column-I","Column-II"),((A)" Plot of log P vs log V at const T",(p)" Linear with ve slope"),((B)" Plot of log V vs log T at const P",(q)" Linear with negative slope"),((C)" Plot of V "prop"T at const T",(r)" Parabola"),((D)" Plot of volume vs pressure at const temp",(s)" Linear passing through origin"),("", (t)" Rectangular hyperbola") :}
02:05View SolutionFor a reaction ,the value of slope of a plot in K→1T=……….
02:31View SolutionThe plot of In k versus 1T is liner with slope of
02:36View SolutionFor the Arrhenius equation, the slope for the plot ln k vs 1T is
01:14View SolutionAccording to Arrhenius equation, the slope of log k vs 1/T plot is
02:09View SolutionThe plot of In k versus 1T is liner with slope of
03:01View SolutionFor the Arrhenius equation, the slope for the plot ln k vs 1/T is
02:05View SolutionΔG∘ - T plot in Ellingham 's diagram slopes are downward for the reaction.
02:40View Solution

