The ratio of slope of two graphs, which are plotted with K.E. v/s v and stopping potential V v/s v isSolution in Malayalam
h
hv0
e (electronic charge)
h/e
Step by step video & image solution for The ratio of slope of two graphs, which are plotted with K.E. v/s v and stopping potential V v/s v is by Chemistry experts to help you in doubts & scoring excellent marks in Class 11 exams.
Updated on:21/07/2023Topper's Solved these Questions
- STRUCTURE OF ATOMSBOOK - BRILLIANT PUBLICATIONCHAPTER - STRUCTURE OF ATOMSEXERCISE - LEVEL - II (ASSERTION - REASON)
5 Videos
- STRUCTURE OF ATOMSBOOK - BRILLIANT PUBLICATIONCHAPTER - STRUCTURE OF ATOMSEXERCISE - LEVEL - I
107 Videos
- STRUCTURE OF ATOMSBOOK - BRILLIANT PUBLICATIONCHAPTER - STRUCTURE OF ATOMSEXERCISE - LEVEL - III (Linked Comprehension Type)
8 Videos
- STATES OF MATTER BOOK - BRILLIANT PUBLICATIONCHAPTER - STATES OF MATTER EXERCISE - LEVEL III (Linked Comprehension Type )
9 Videos
- THERMODYNAMICS AND CHEMICAL ENERGETICS BOOK - BRILLIANT PUBLICATIONCHAPTER - THERMODYNAMICS AND CHEMICAL ENERGETICS EXERCISE - (LEVEL-II (HOMEWORK)
39 Videos
Similar Questions
Assertion : Energy of orbitals in hydrogen atom is 1s<2s=2p<3s=3p=3d<4s=4p=4d=4f
Reason : The energy of orbitals in hydrogen atom is determined by using principal quantum number.
View SolutionA radiostation broadcasts on a frequency of 1550 kHz. Calculate the wavelength.
View SolutionThe hydrogen-like species Ļi^(2+) is in a spherically symmetric state S1 with one radial node. Upon absorbing light the ion undergoes transition to a state S2 The state S2 has one radial node and its energy is equal to the ground state energy of the hydrogen atom.
The state S1 is: 1s, 2s, 2p, 3s
View Solutionwhich of the following statements is correct?
View SolutionWhich of the following is an intensive property
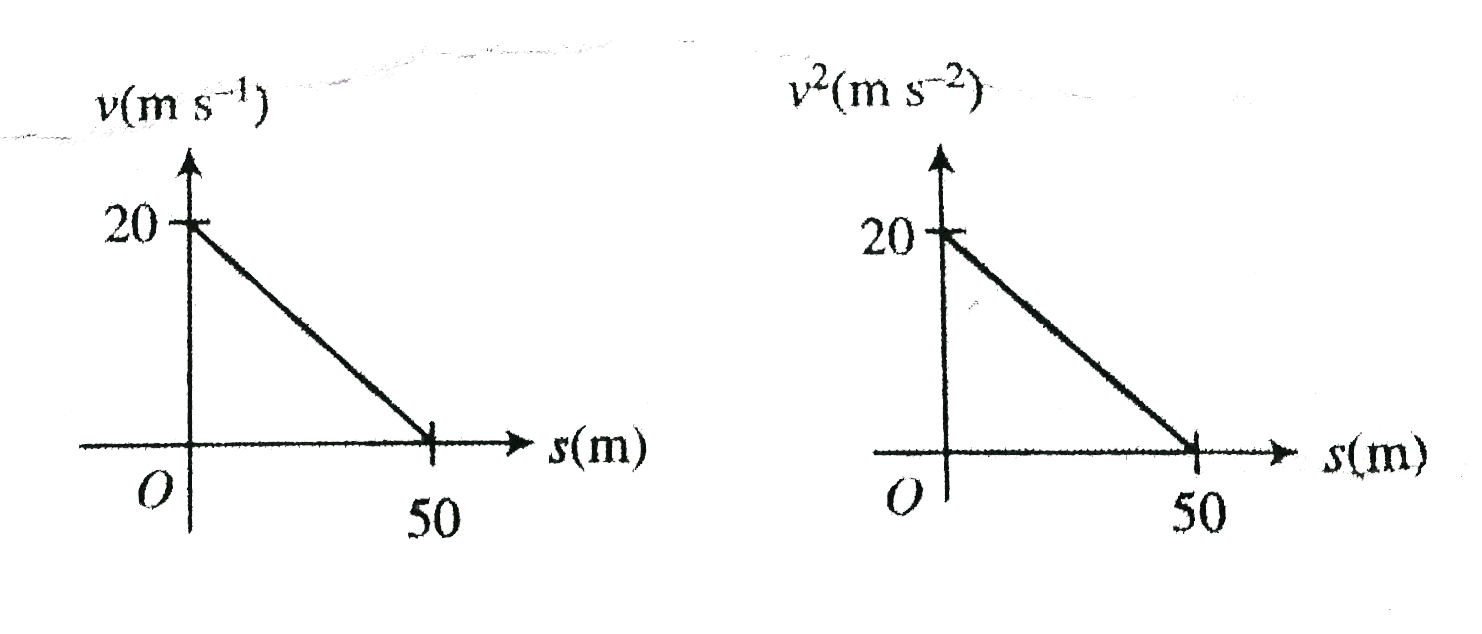
View SolutionThe v−s and v2−s graph are given for two particles. Find the accelerations of the particles at s=0.
 .
.
View SolutionSlope of V0−v curve is-
(where V0= Stopping potential and v=frequency)
View SolutionSlope of V0 vs v curve is (where V0= Stopping potential, v=subjected freqency)
View SolutionWhich of the following is the graph between the frequency (v) of the incident radiations and the stopping potential ?
View SolutionIn a photoelectric experiment, the graph of frequency v of incident light (in Hz) and stopping potential V (in V) is as shown in the figure. Planck's constant is (e is the elementary charge)
View Solutionप्रकाश - वैधुत प्रभाव के प्रयोग में आपतित प्रकाश की आवृति (v ) तथा निरोधी विभव (V ) के बीच खींचे गये ग्राफ की ढलान (slope) होती हैं-
View SolutionIn photoelectric effect the slope of straight line graph between stopping potential (V_(s)) and frequency of incident light (v) gives
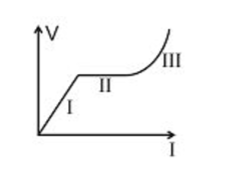
View SolutionVoltage V v/s I graph is shown in the figure.

View SolutionGraph plotted between stopping potential V0 and frequency v, where v>v0, for a photosensitive material is a_____graph whose slope is ____.
View SolutionSlope of V_(0) vs v curve is (where V_(0) = Stopping potential, v=subjected freqency)
View SolutionIn a photoelectric experiment, the graph of frequency v of incident light (in Hz) and stopping potential V (in V) is as shown in the figure. Planck's constant is (e is the elementary charge)
View Solution
