The pressure-volume of varies thermodynamic process is shown in graphs:
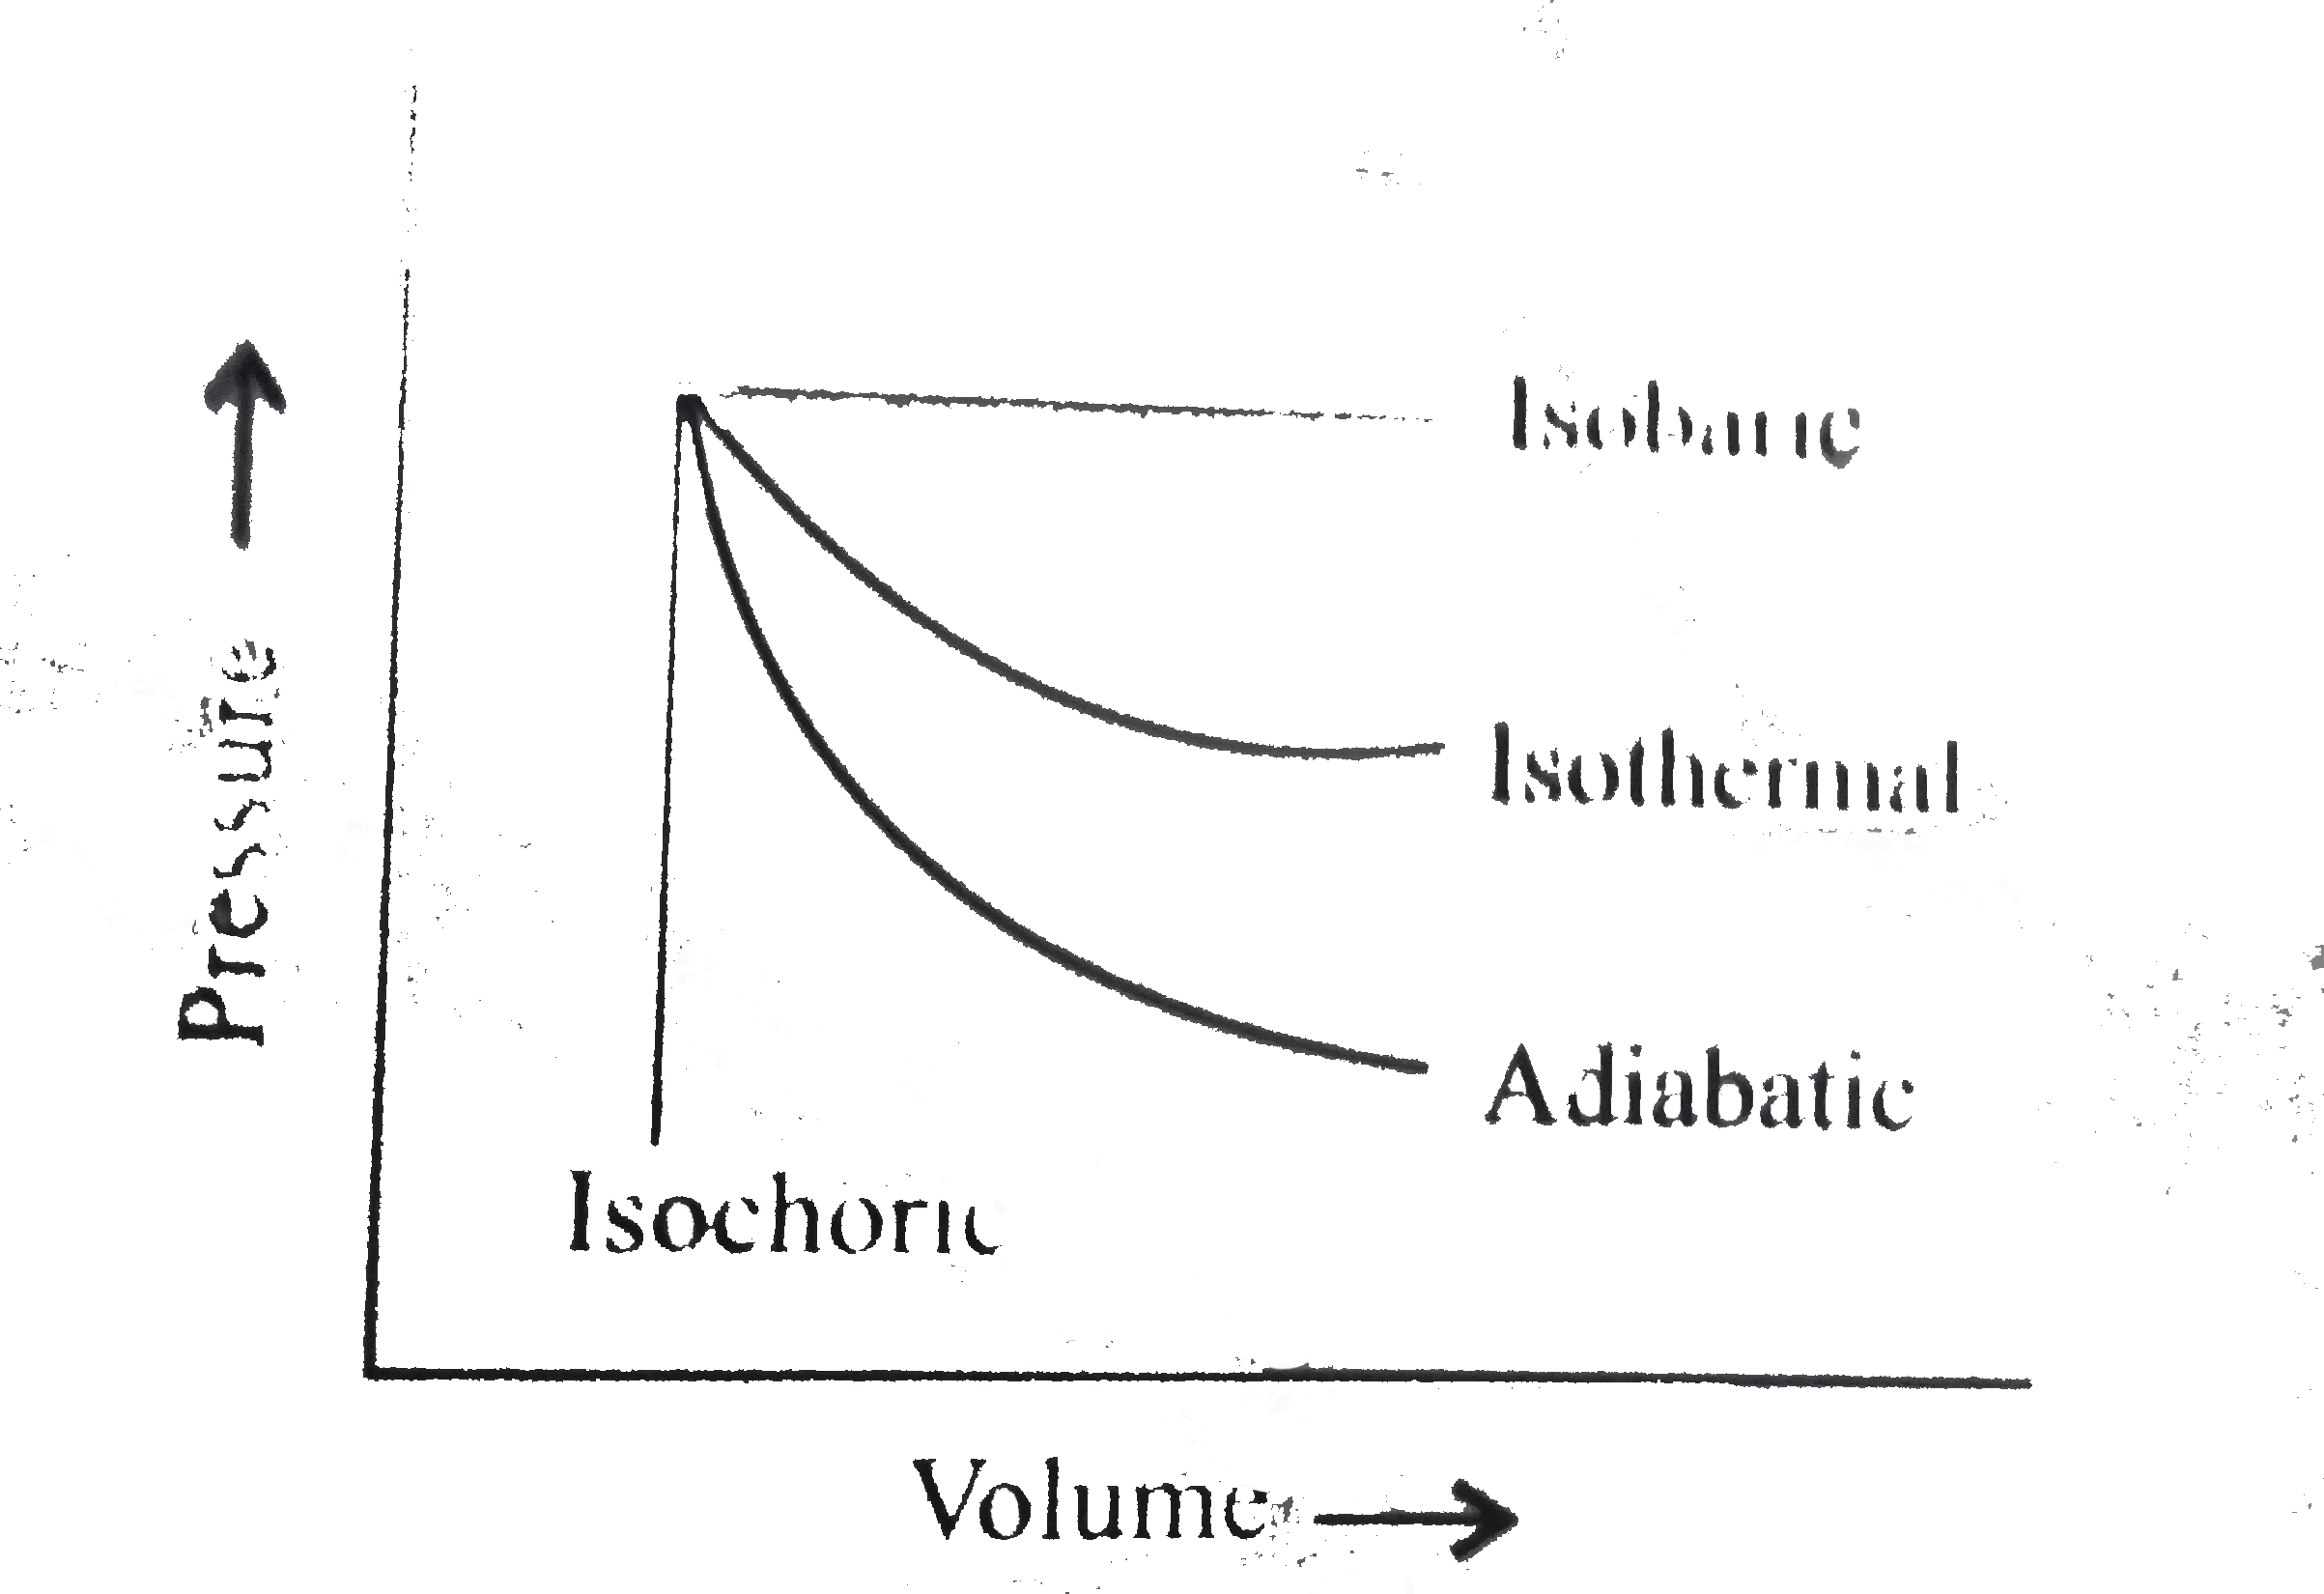
Work is the mole of transference of energy. It has been observed that reversible work done by the system is the maximum obtainable work.
wrev>wirr
The works of isothermal and adiabatic processes are different from each other.
wisothermal reversible=2.303nRTlog10(V2V1)
=2.303nRTlog10(P2P1)
wadiabatic reversible=CV(T1−T2)
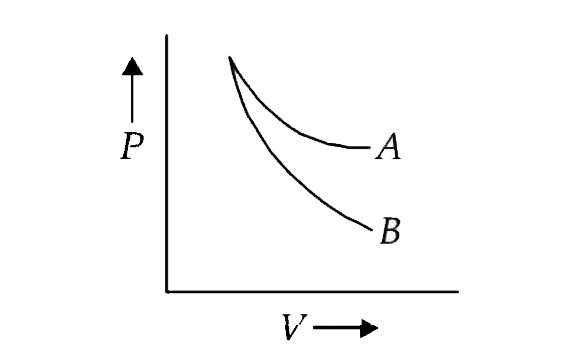
P−V plots for two gases during adiabatic processes are given in the given figure:
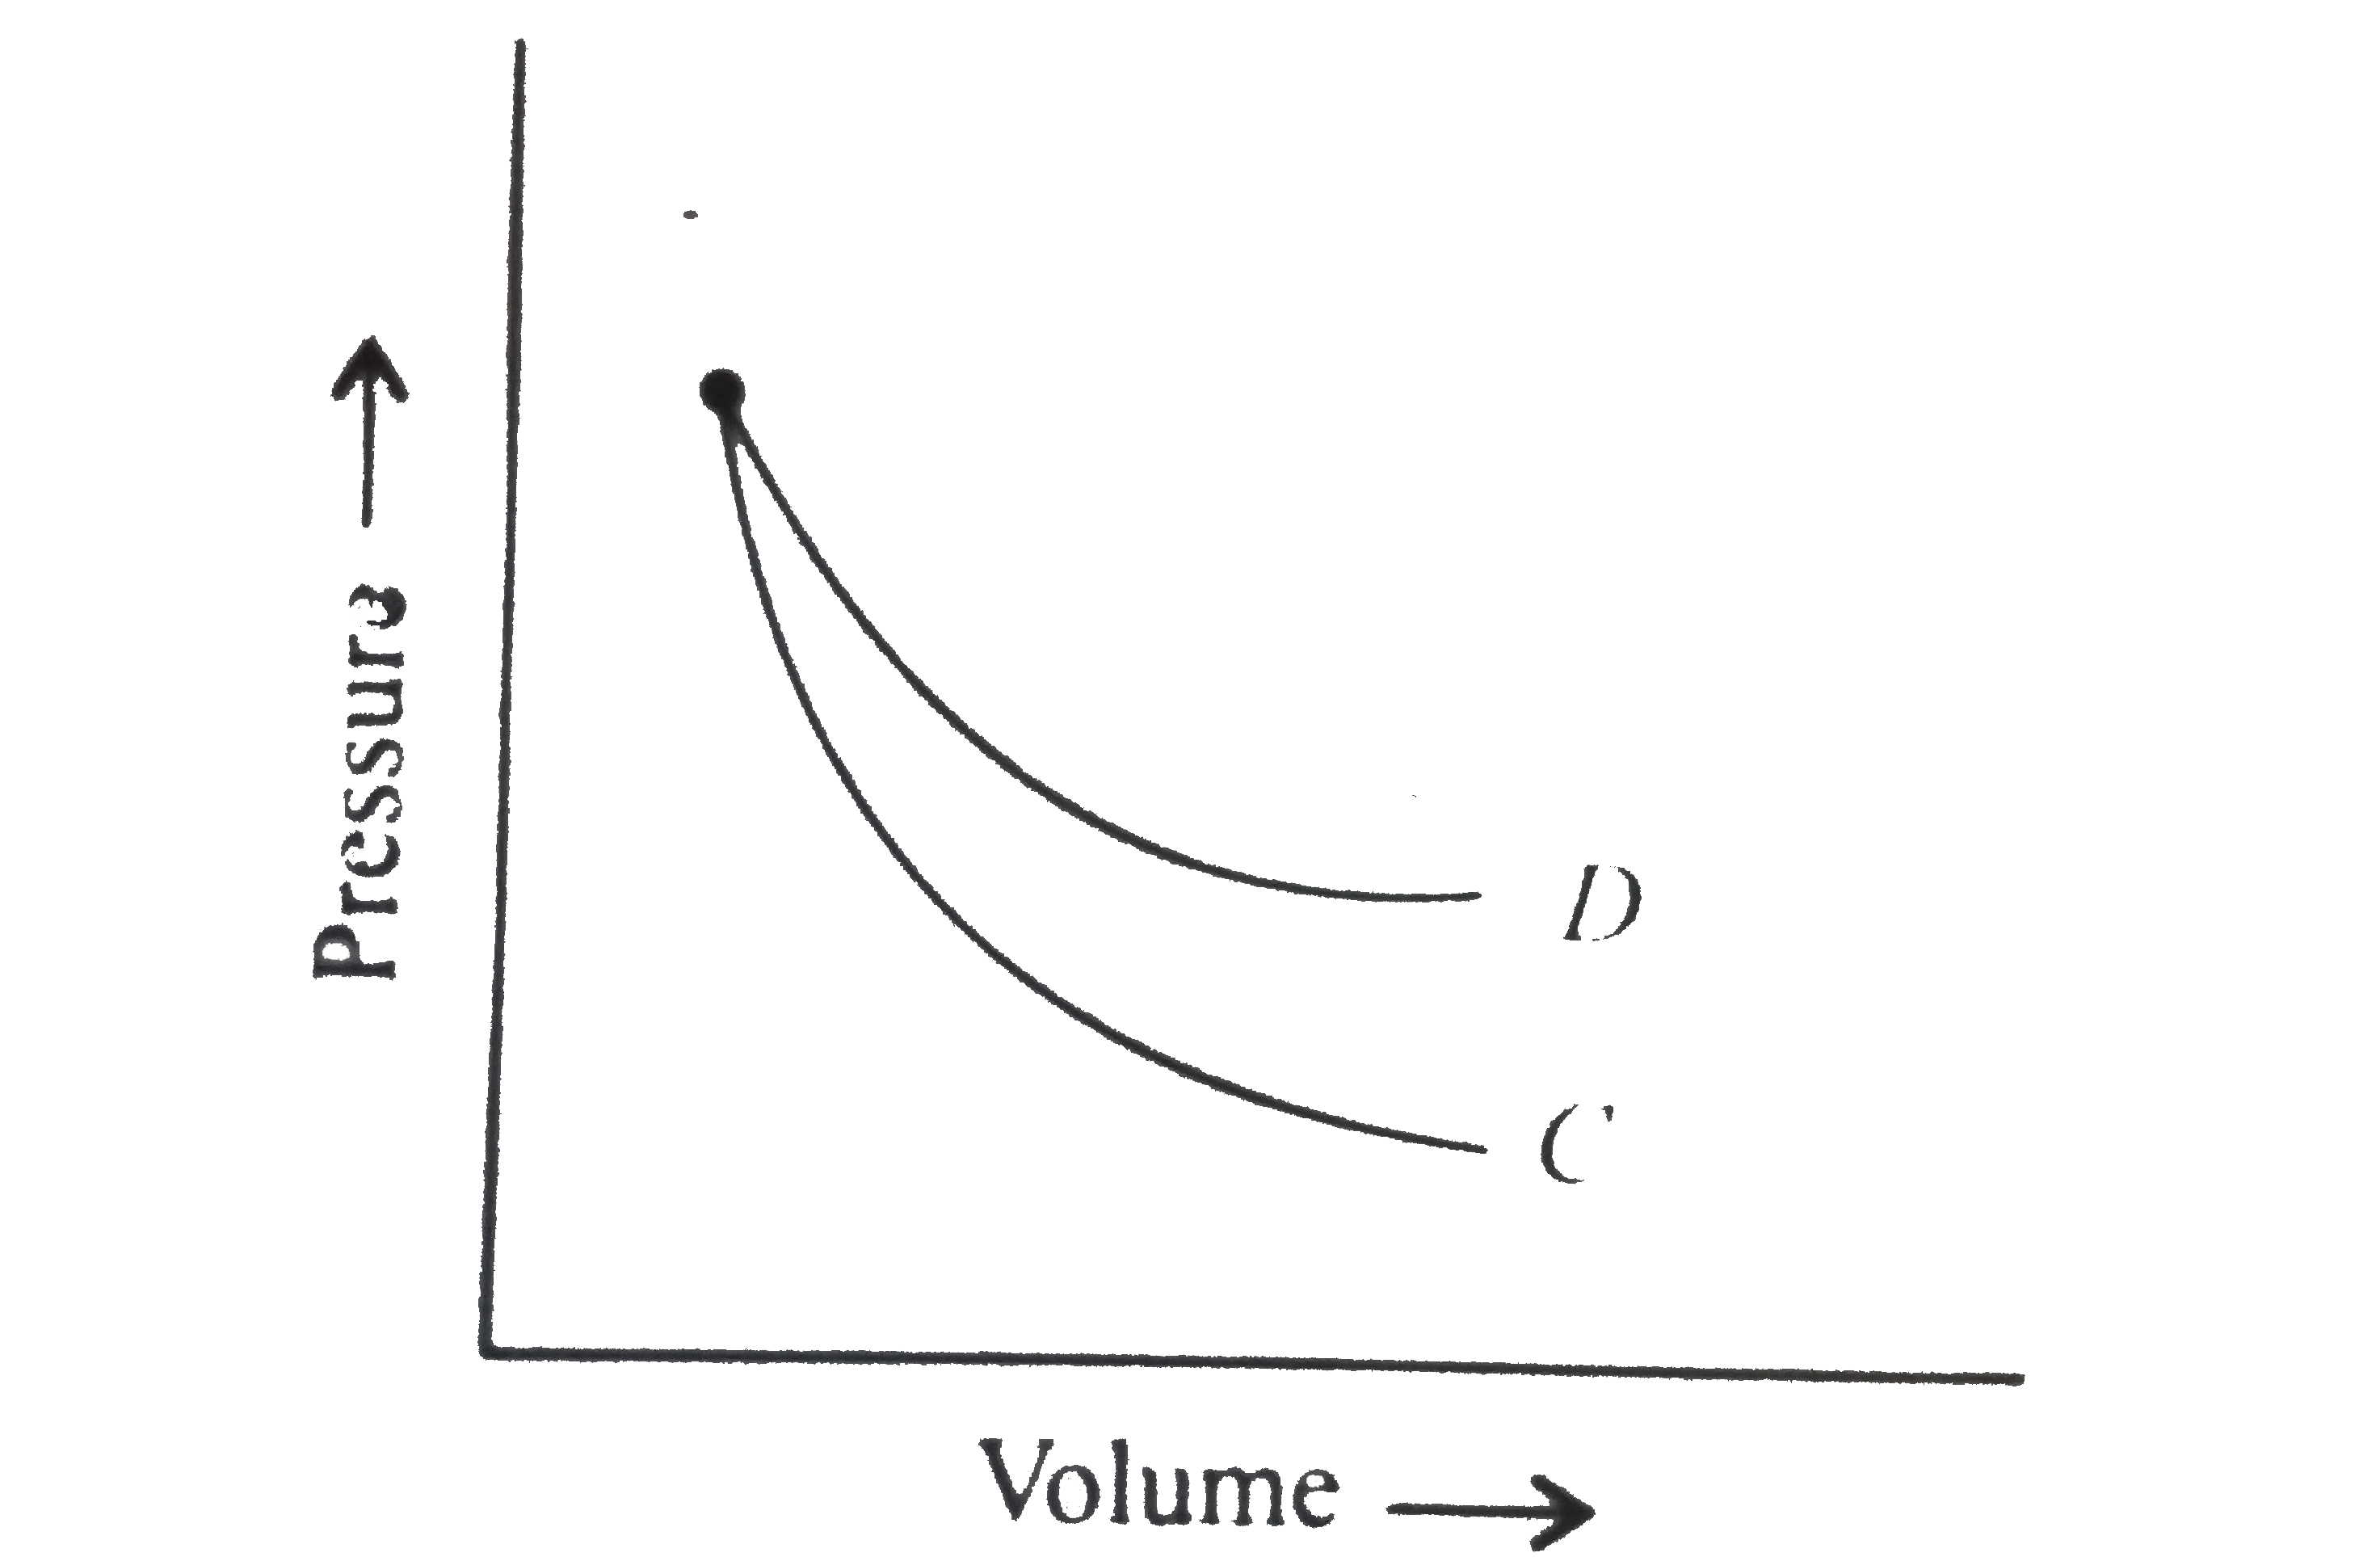
Plot D and Plot C should correspond to
He and O2
He and Ar
O2 and He
O2 and N2
Slope of the adiabatic curve ∝γ
Slope of B> slope of A
He(γ=1.66),O2(γ=1.44)
Topper's Solved these Questions
- THERMODYNAMICSBOOK - CENGAGE CHEMISTRY ENGLISHCHAPTER - THERMODYNAMICSEXERCISE - Exercises (Multiple Correct)
50 Videos
- THERMODYNAMICSBOOK - CENGAGE CHEMISTRY ENGLISHCHAPTER - THERMODYNAMICSEXERCISE - Multiple correct Answer Type
2 Videos
- THERMODYNAMICSBOOK - CENGAGE CHEMISTRY ENGLISHCHAPTER - THERMODYNAMICSEXERCISE - Paragraph for Problem
1 Videos
- STOICHIOMETRYBOOK - CENGAGE CHEMISTRY ENGLISHCHAPTER - STOICHIOMETRYEXERCISE - Archives Subjective
33 Videos
Similar Questions
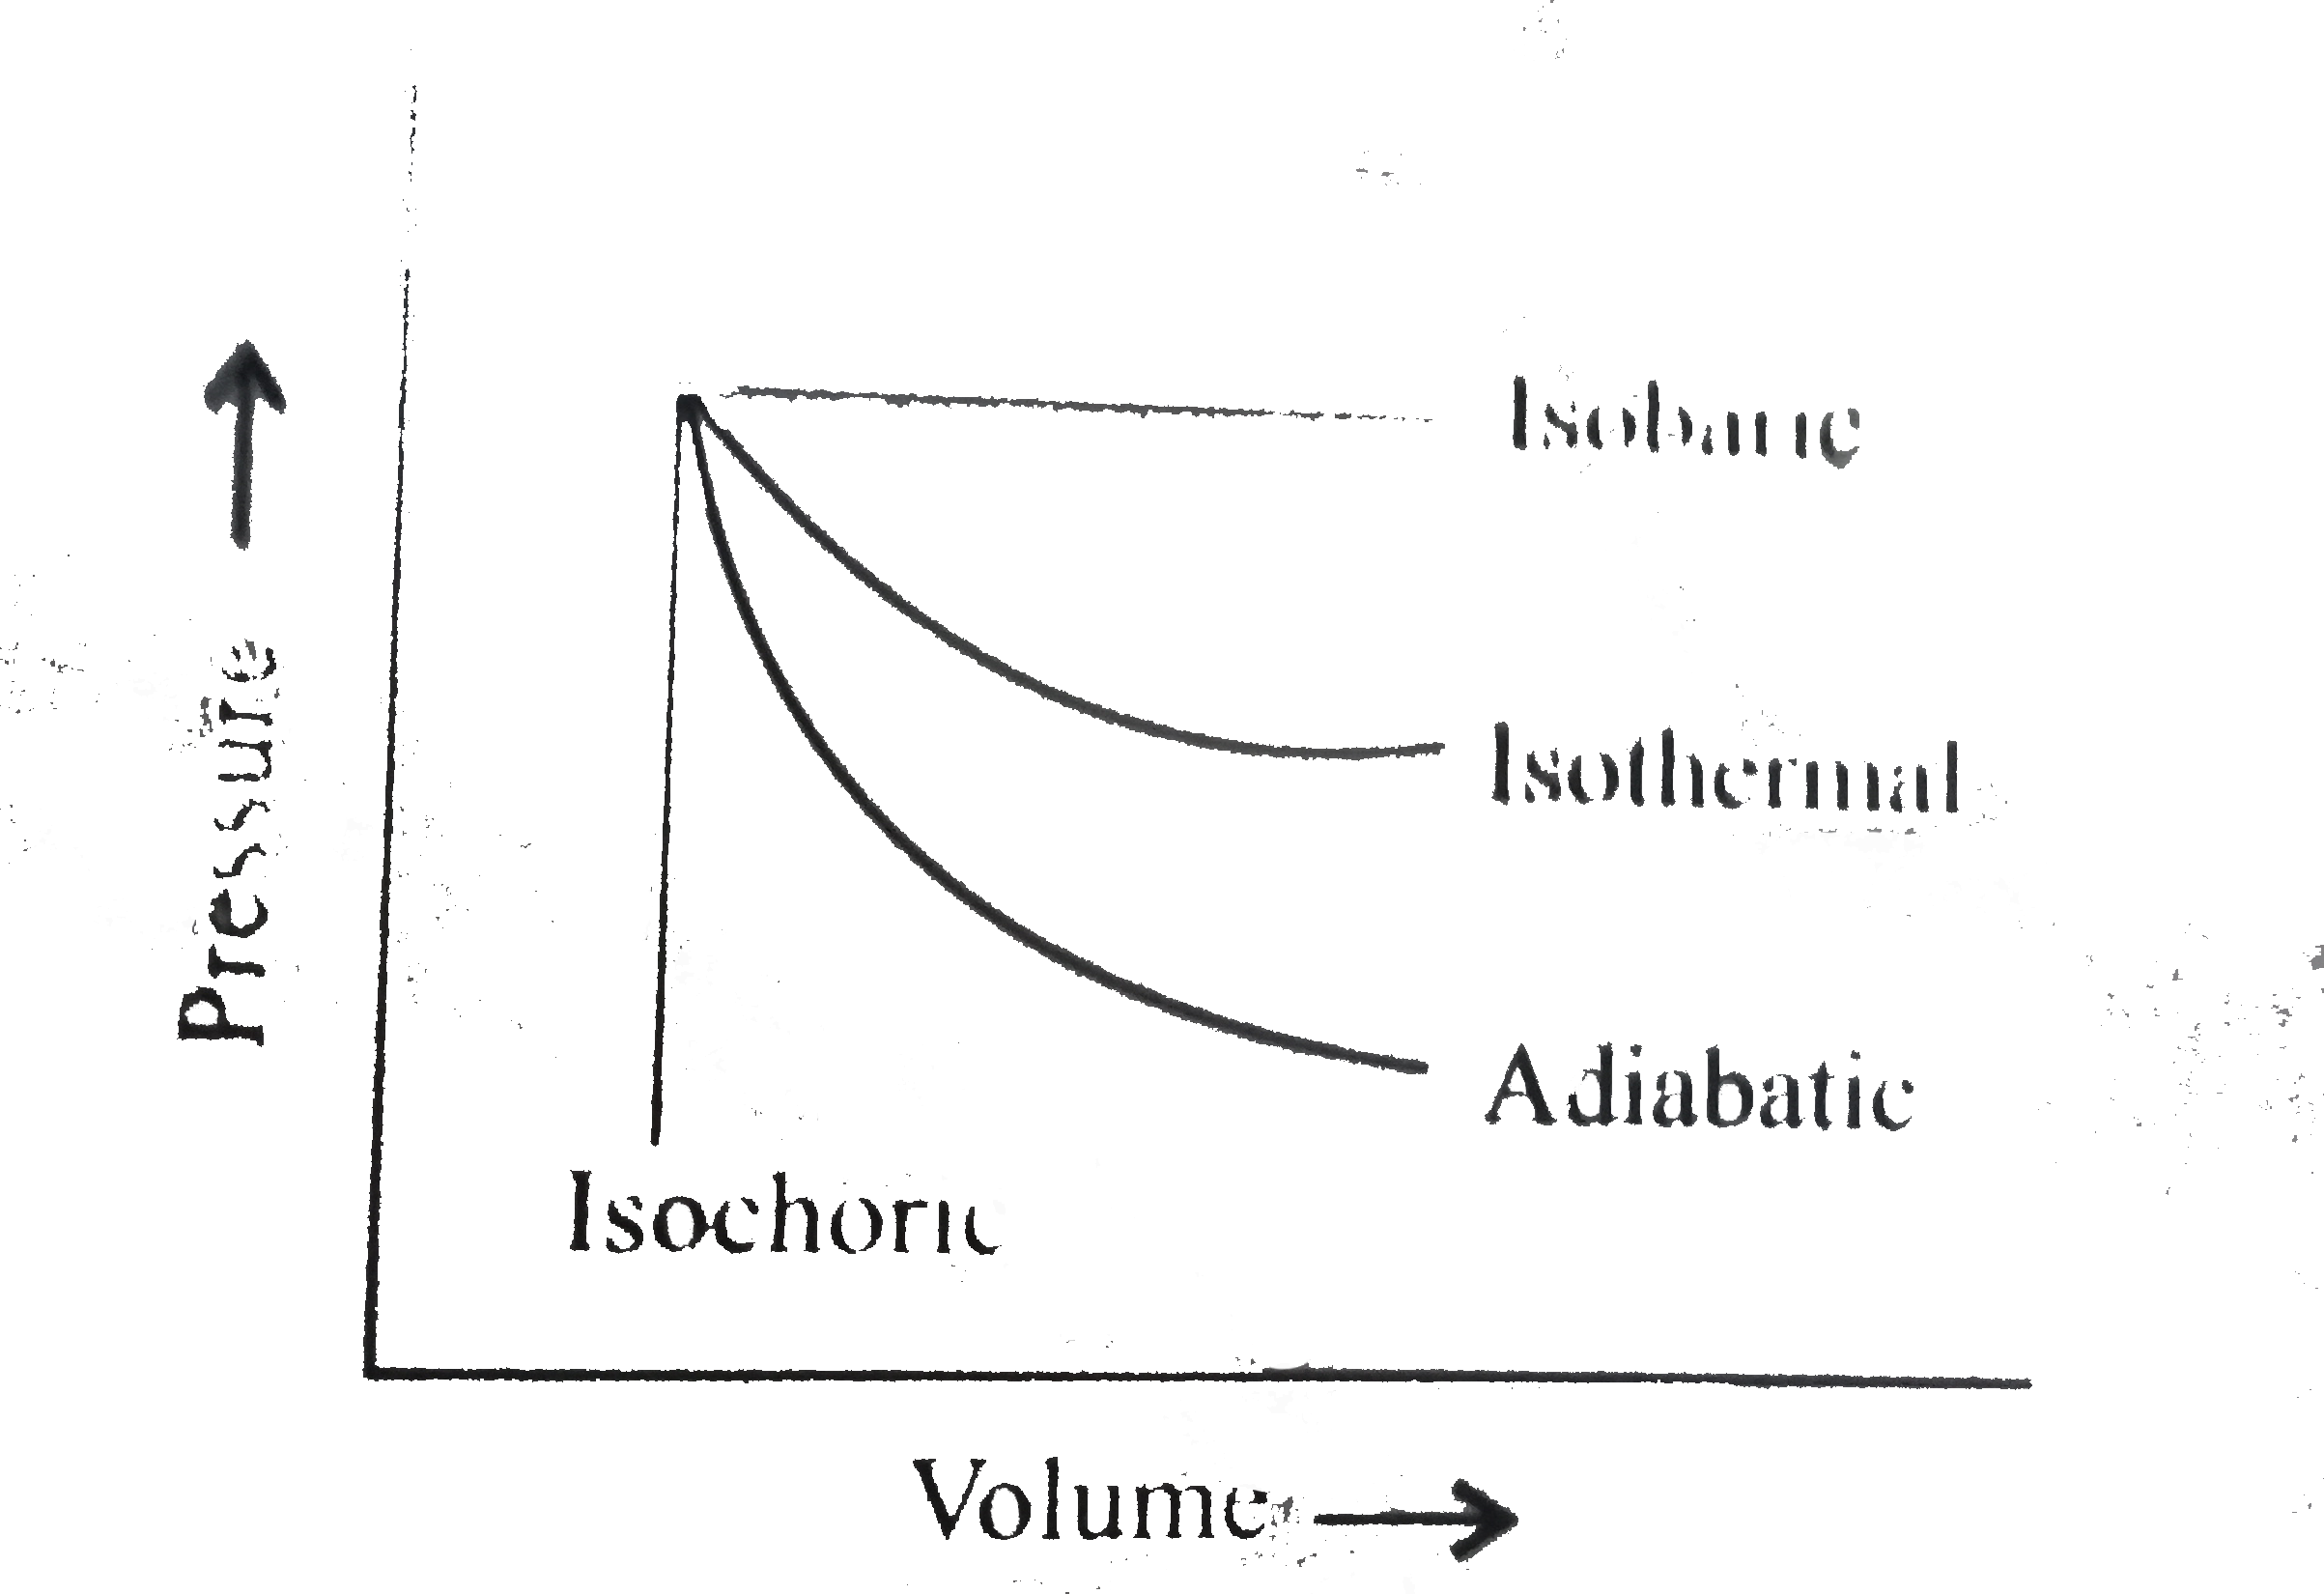
The pressure-volume of varies thermodynamic process is shown in graphs:
Work is the mole of transference of energy. It has been observed that reversible work done by the system is the maximum obtainable work.
wrev>wirr
The works of isothermal and adiabatic processes are different from each other.
wisothermal reversible=−2.303nRTlog10(V2V1)
=2.303nRTlog10(P2P1)
wadiabatic reversible=CV(T1−T2)
Calculate work done when 1 mole of an ideal gas is expanded reversibly from 30L to 60L at a constant temperature of 300K
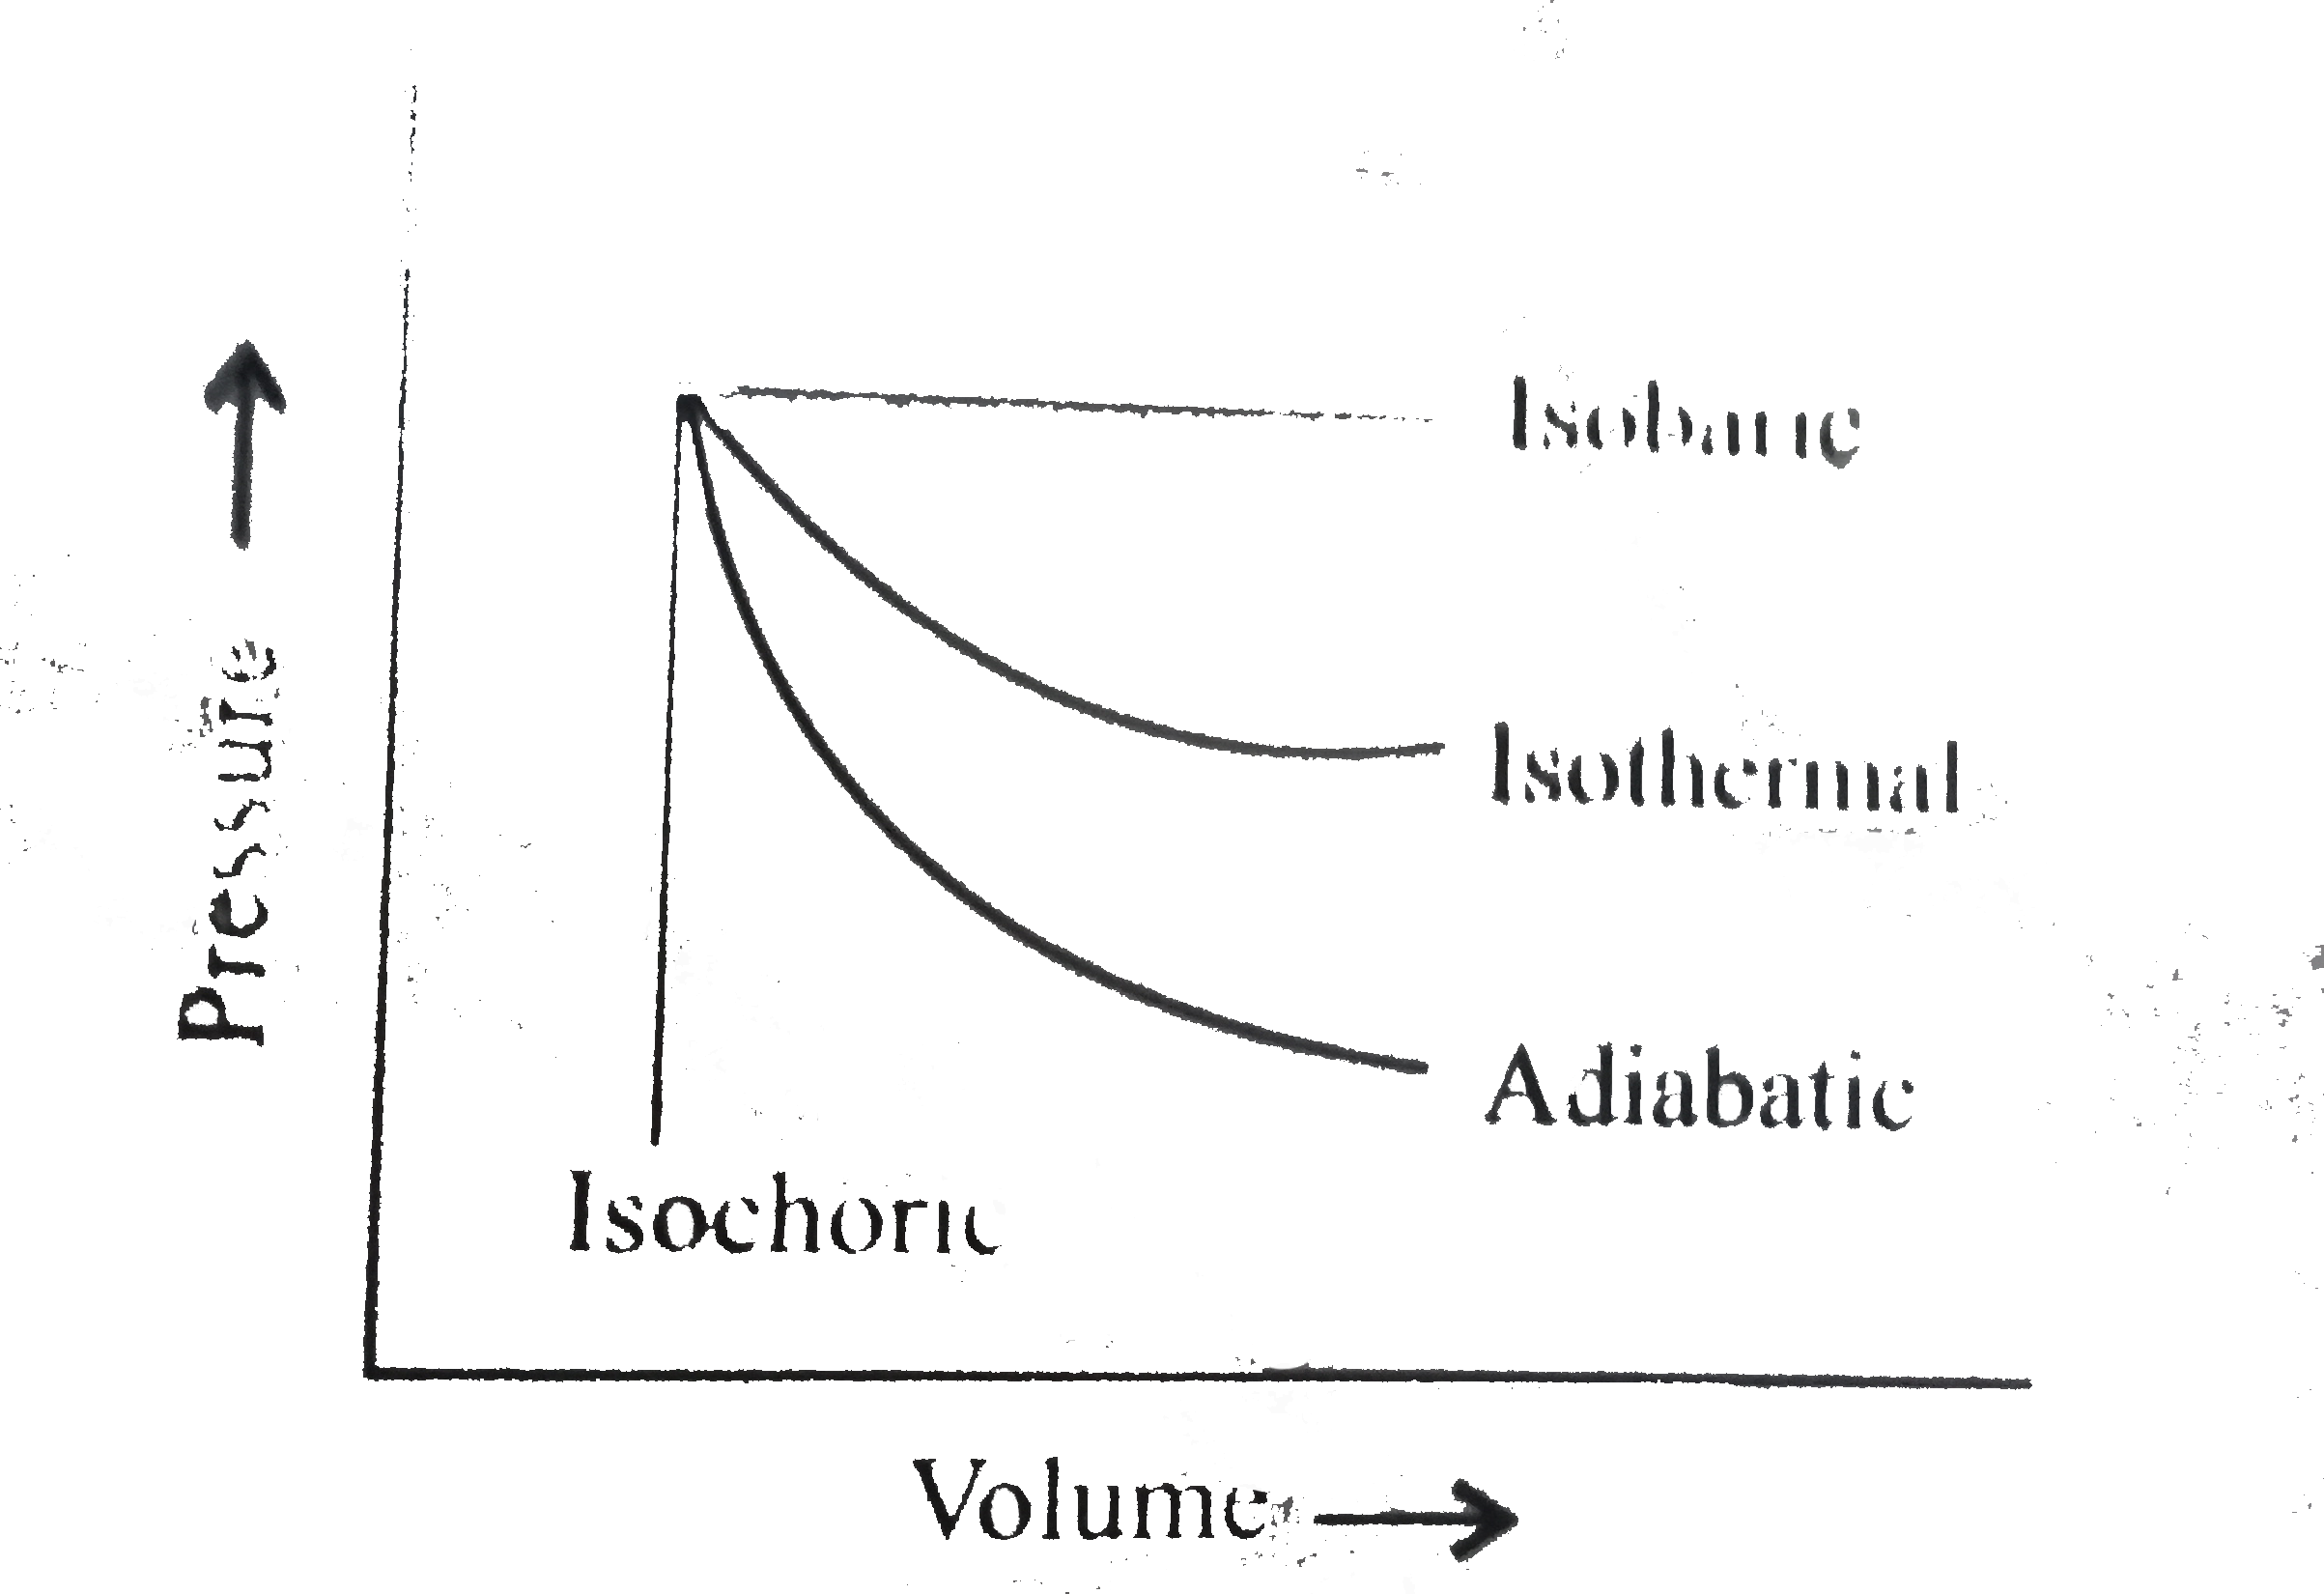
View SolutionThe pressure-volume of varies thermodynamic process is shown in graphs:
Work is the mole of transference of energy. It has been observed that reversible work done by the system is the maximum obtainable work.
wrev>wirr
The works of isothermal and adiabatic processes are different from each other.
wisothermal reversible=2.303nRTlog10(V2V1)
=2.303nRTlog10(P2P1)
wadiabatic reversible=CV(T1−T2)
A thermodynamic system goes in a cyclic process as represented in the following P−V diagram:
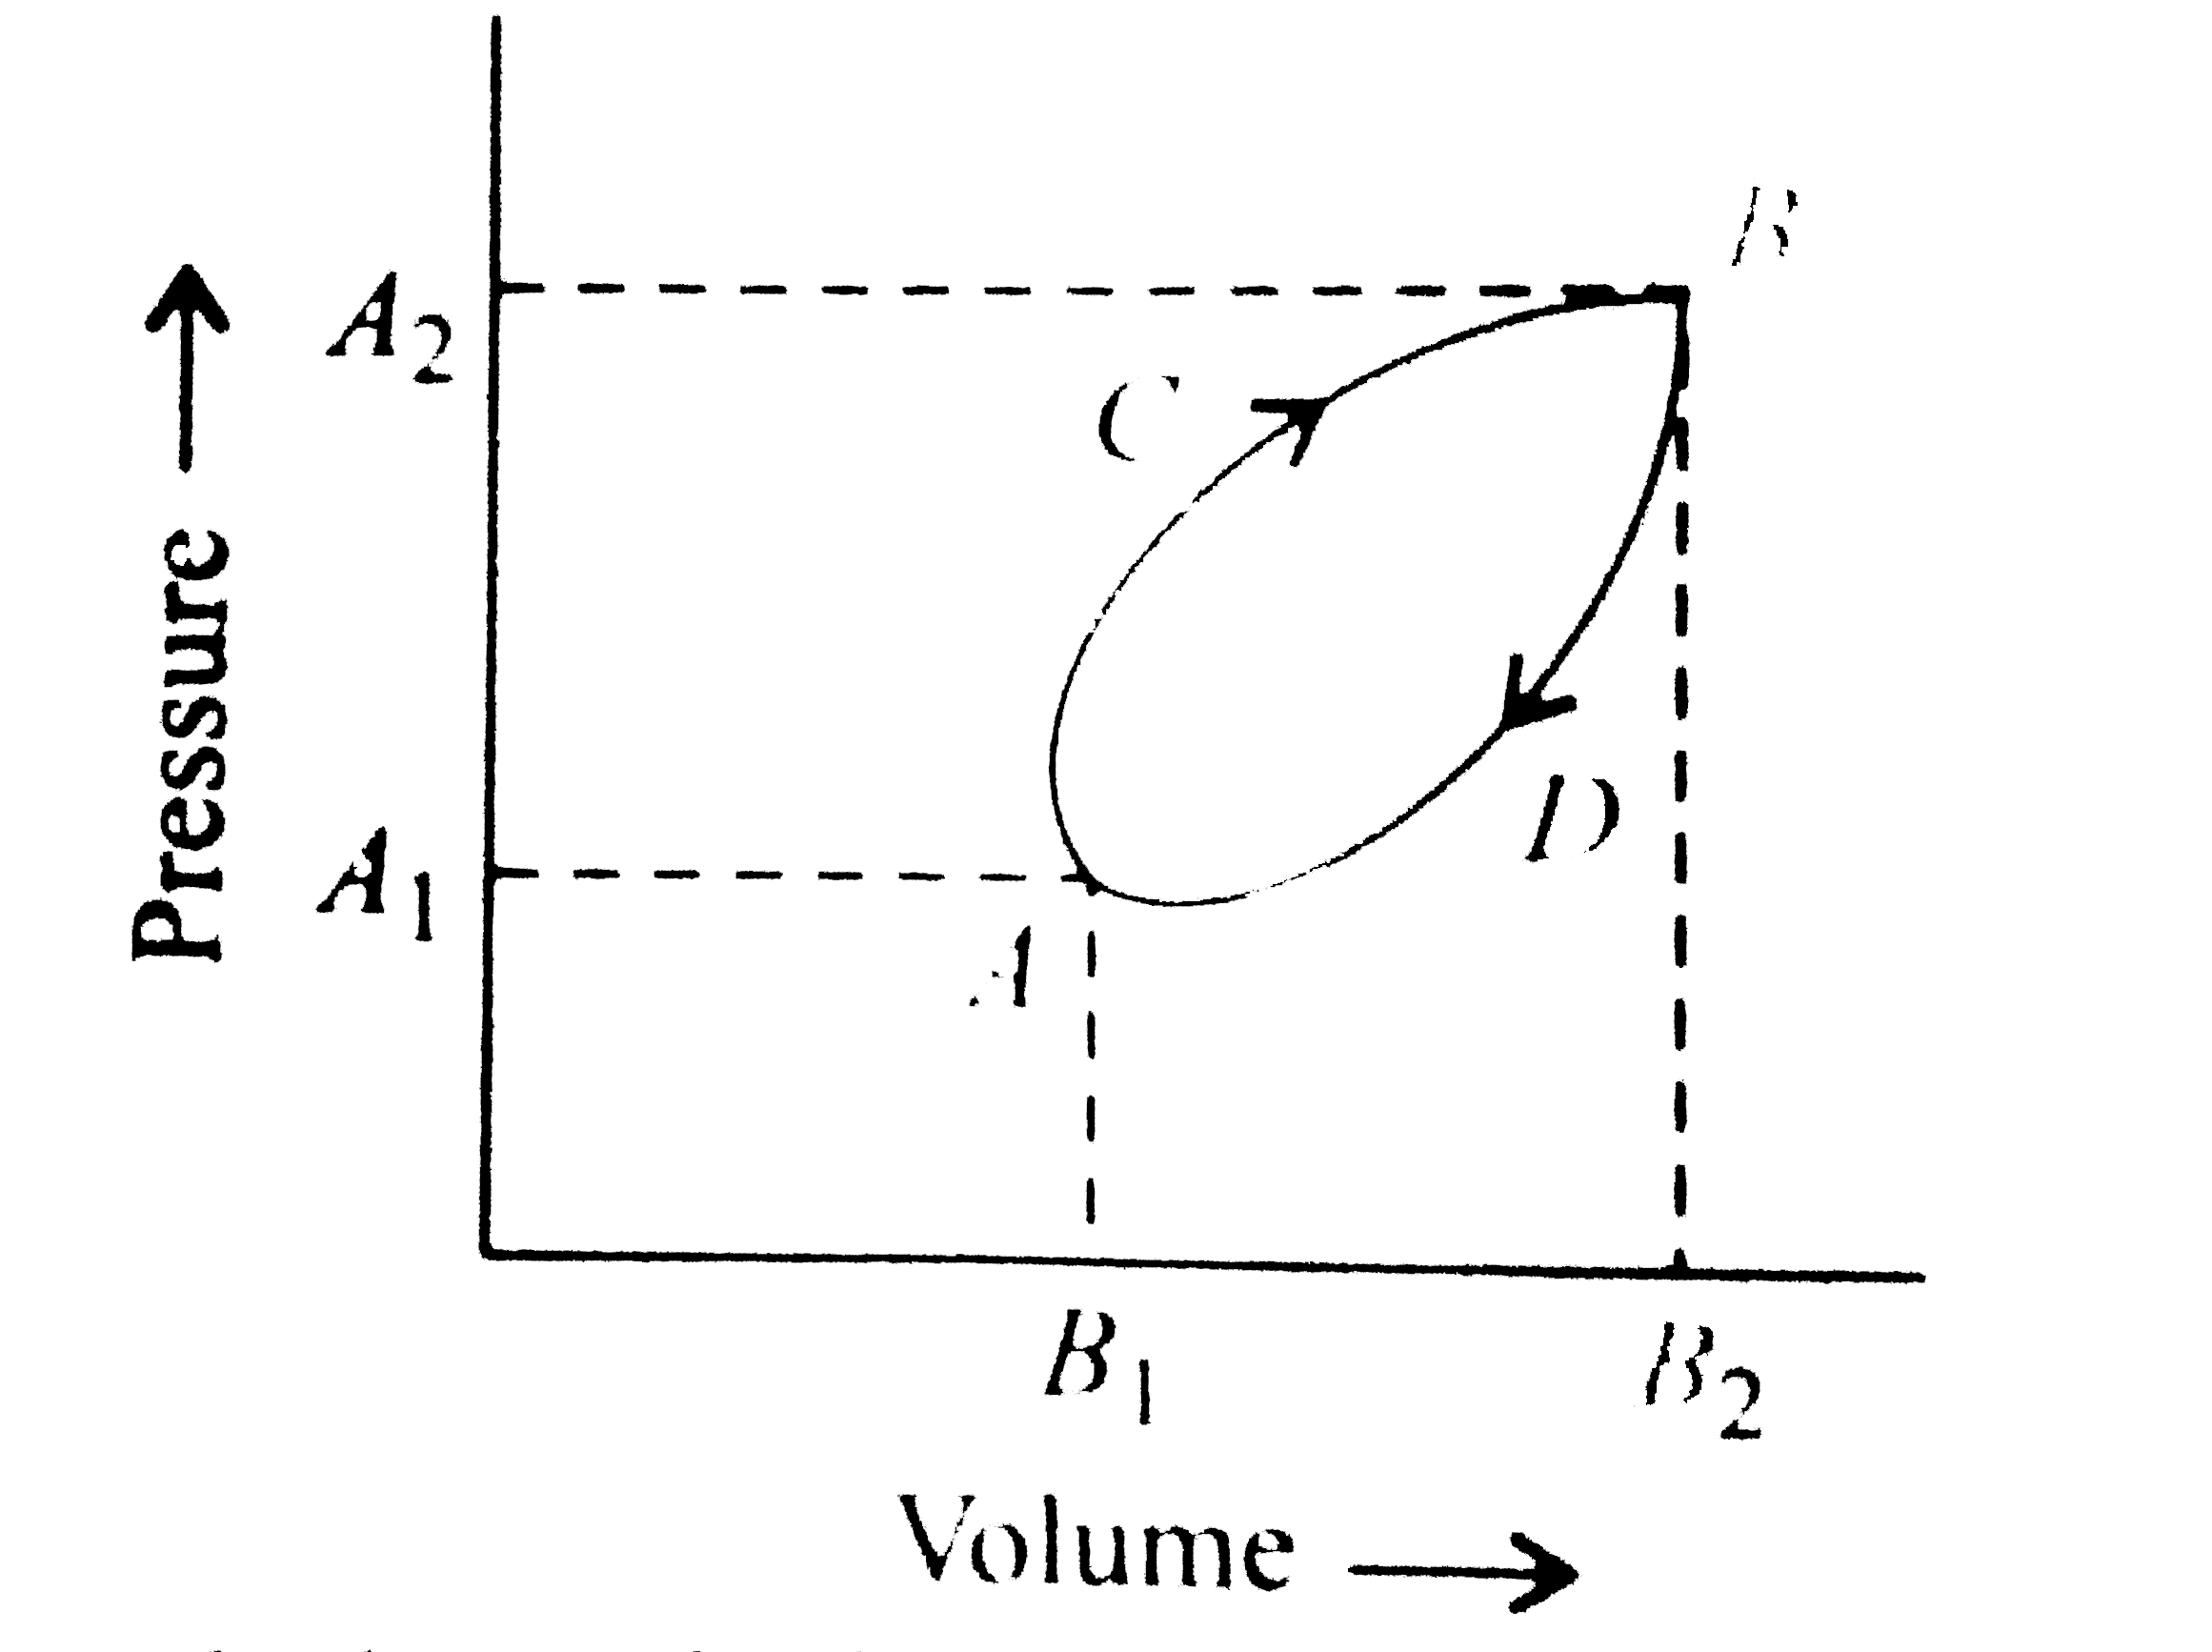
The network done during the complete cycle is given by the area
View SolutionThe pressure-volume of varies thermodynamic process is shown in graphs:
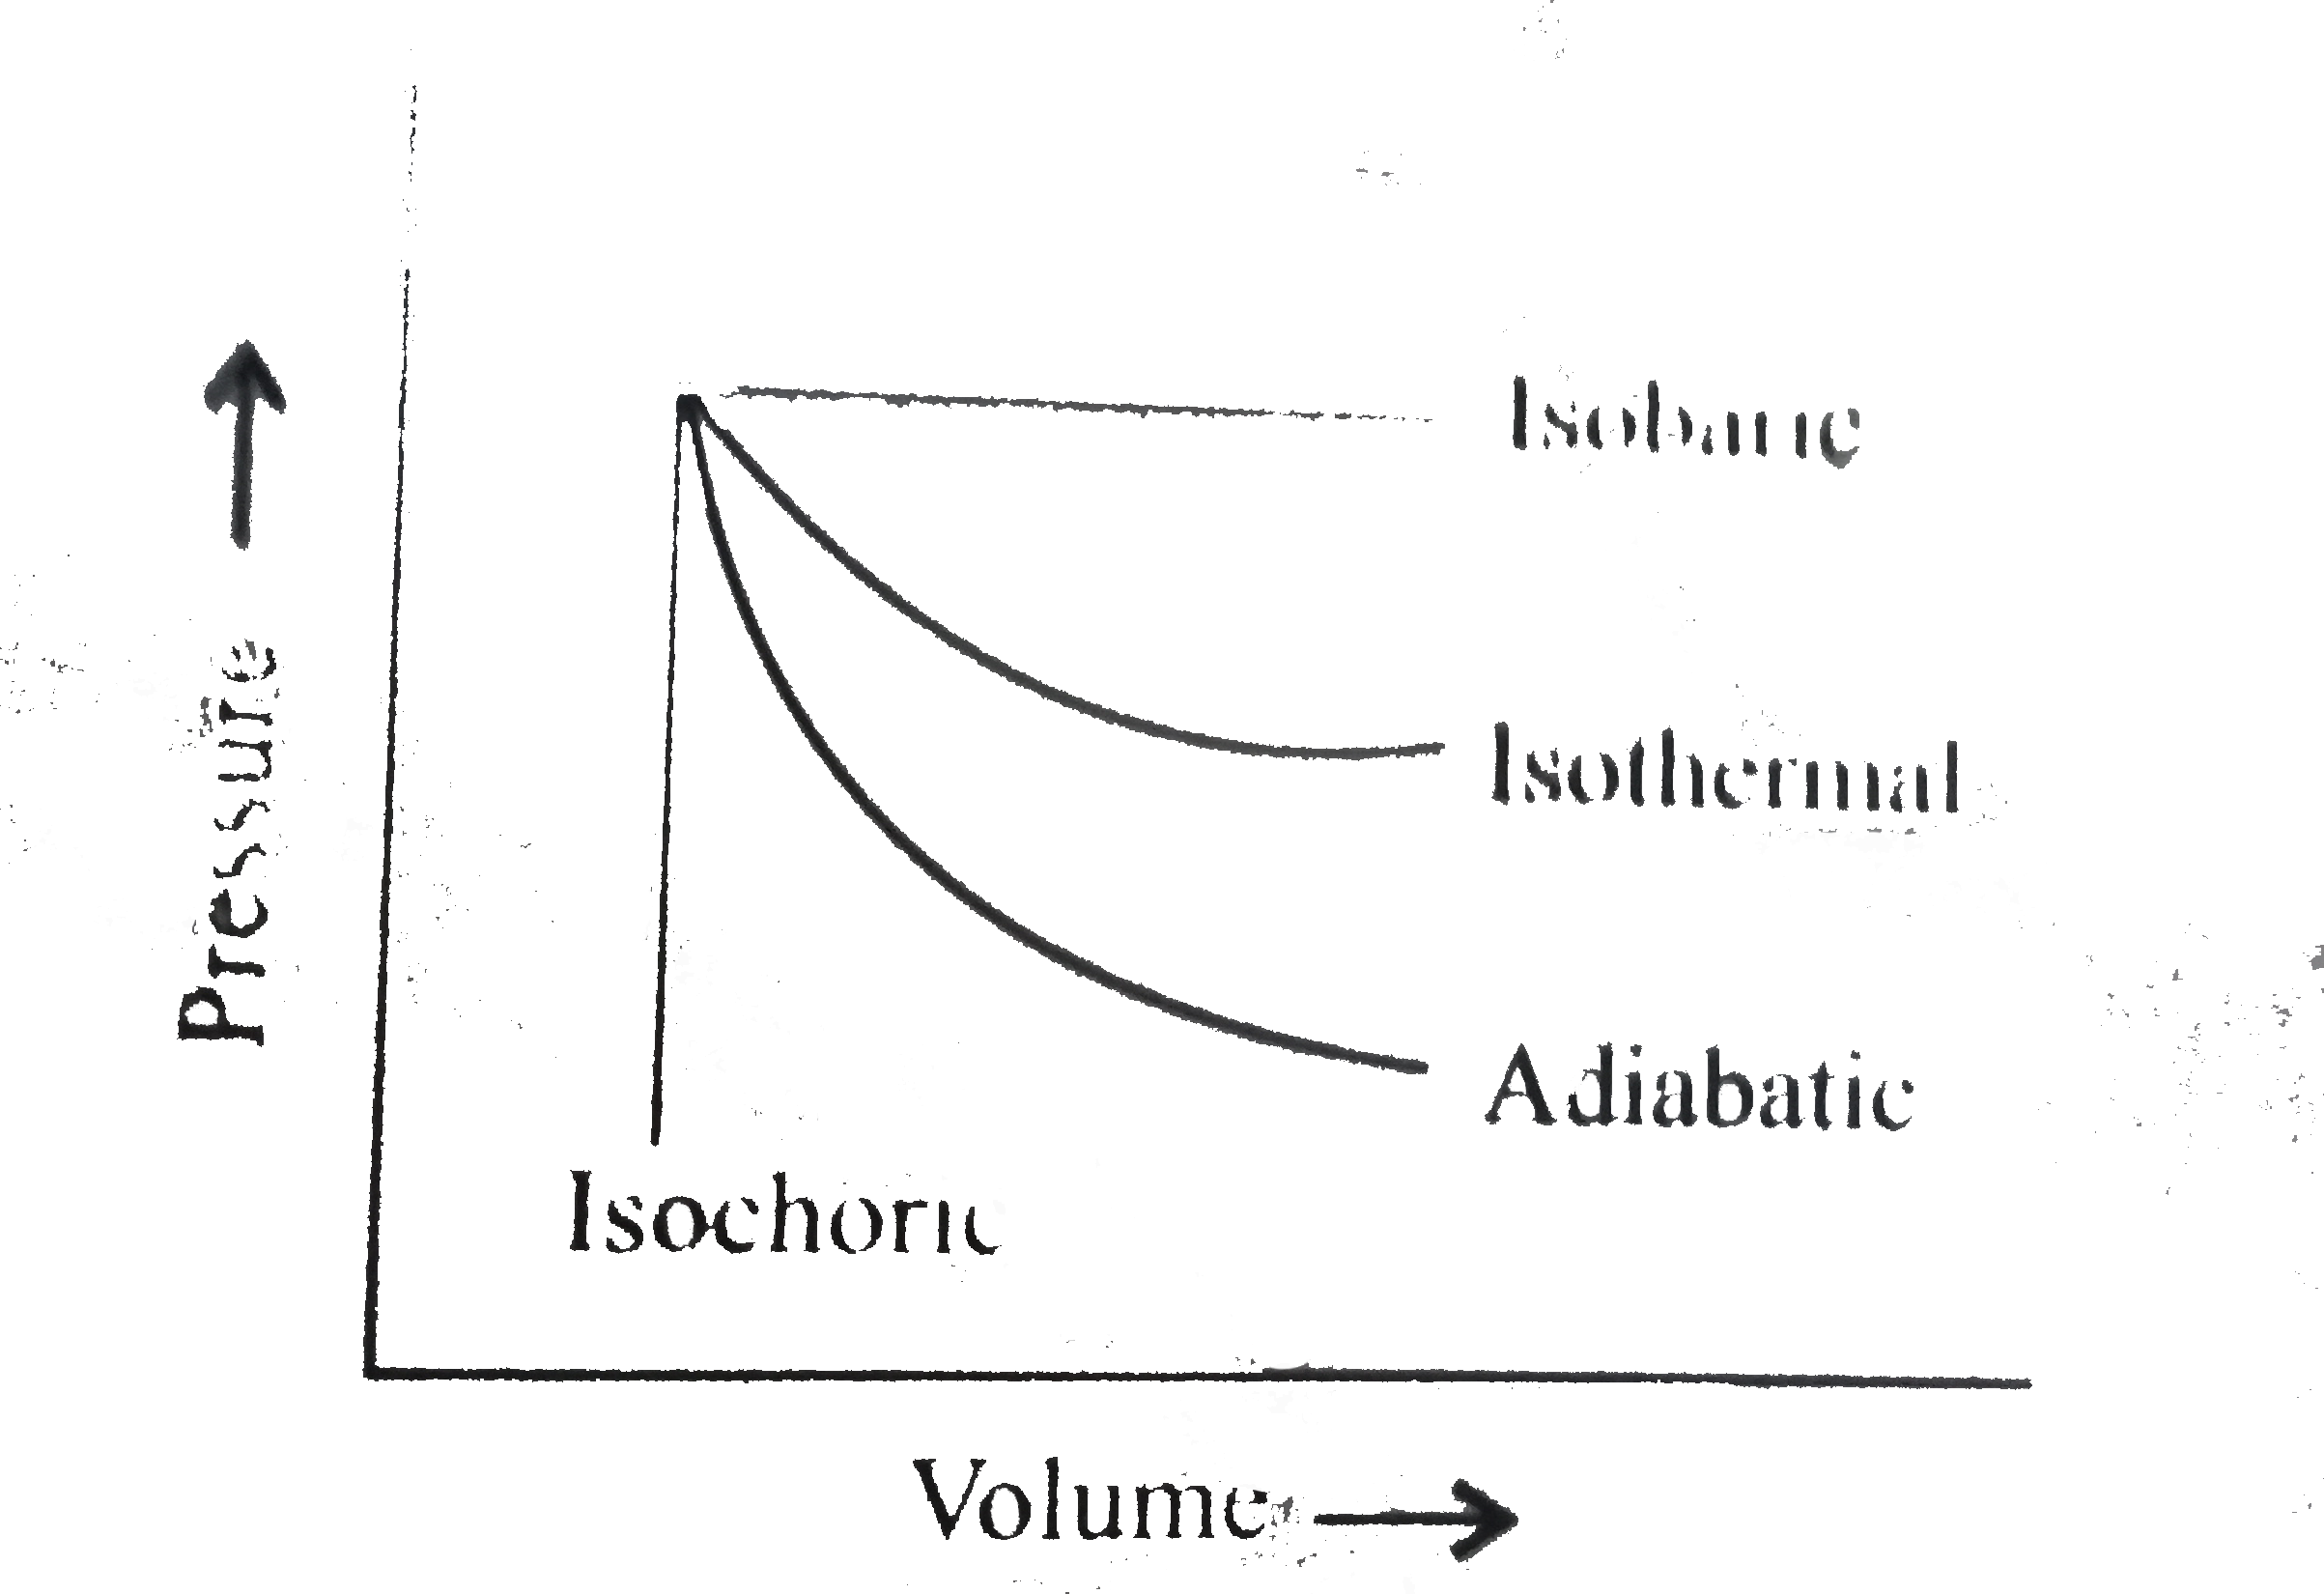
Work is the mole of transference of energy. It has been observed that reversible work done by the system is the maximum obtainable work.
wrev>wirr
The works of isothermal and adiabatic processes are different from each other.
wisothermal reversible=2.303nRTlog10(V2V1)
=2.303nRTlog10(P2P1)
wadiabatic reversible=CV(T1−T2)
If w1,w2,w3 and w4 are work done in isothermal, adiabatic, isobaric, and isochoric reversible processes, respectively then the correct sequence (for expansion) would be
View SolutionThe pressure-volume of varies thermodynamic process is shown in graphs:
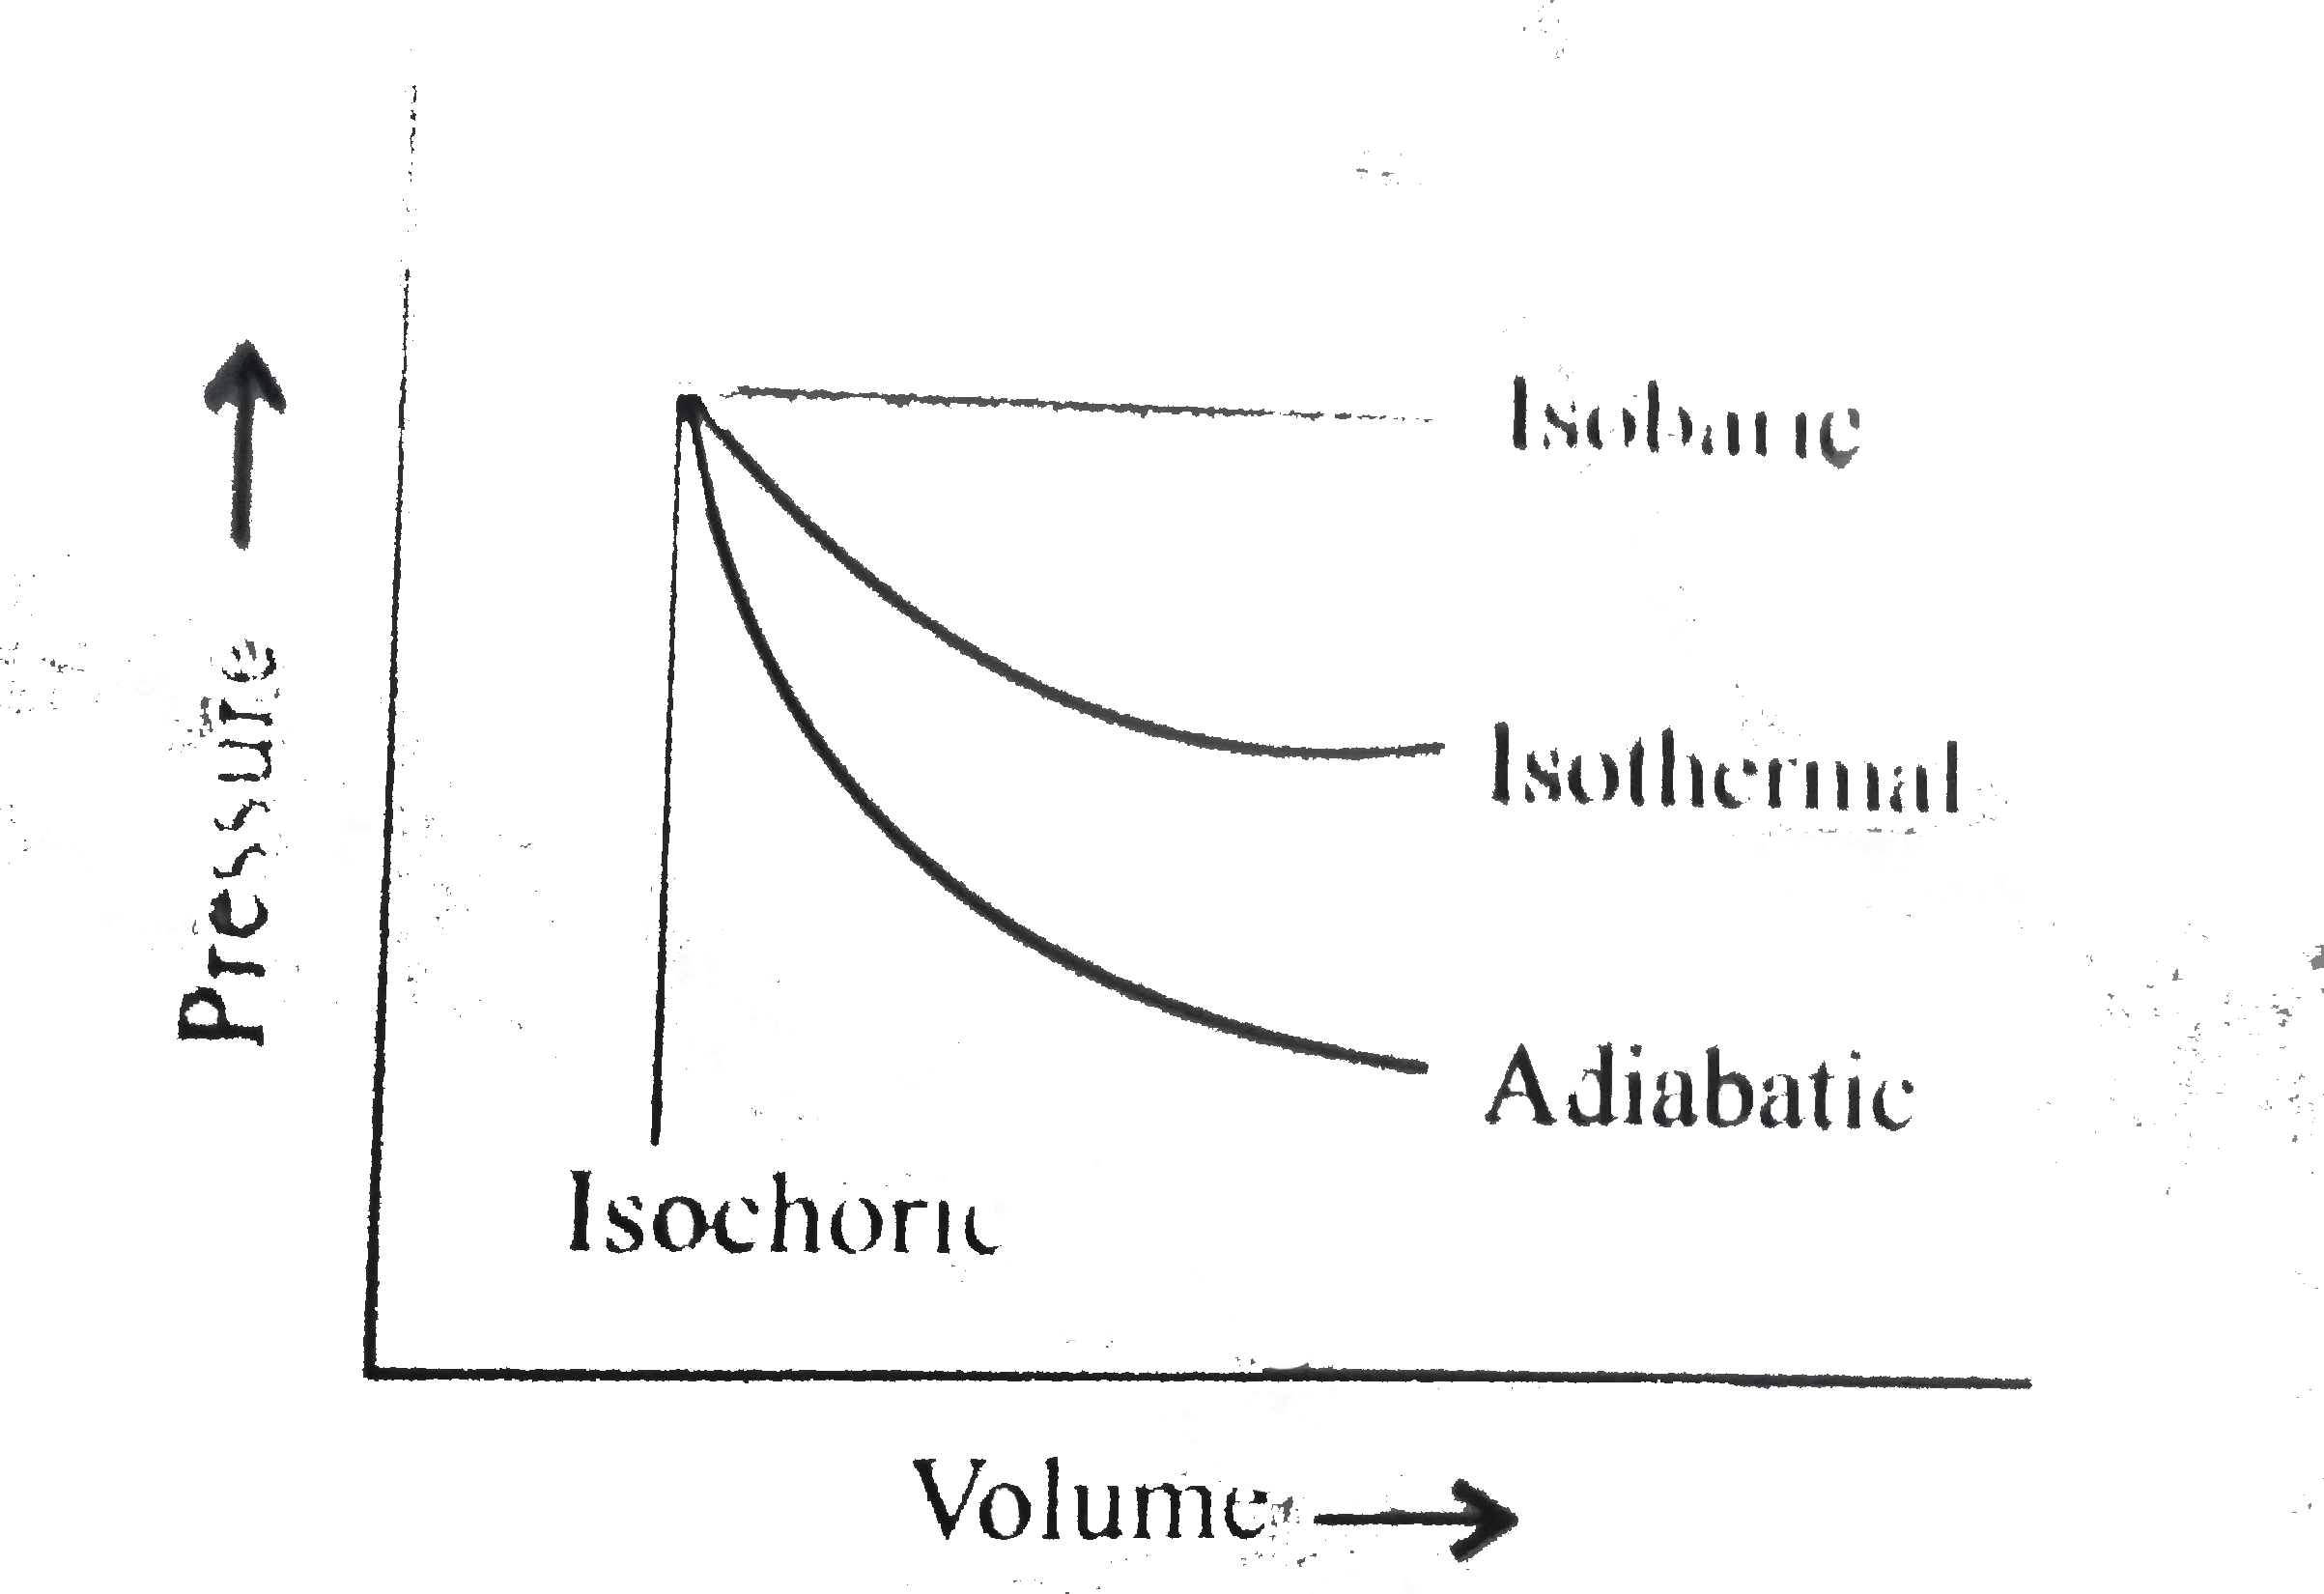
Work is the mole of transference of energy. It has been observed that reversible work done by the system is the maximum obtainable work.
wrev>wirr
The works of isothermal and adiabatic processes are different from each other.
wisothermal reversible=2.303nRTlog10(V2V1)
=2.303nRTlog10(P2P1)
wadiabatic reversible=CV(T1−T2)
The q value and work done in isothermal reversible expansion of one mole of an ideal gas from initial pressure of 1 bar to final pressure of 0.1 bar at constant temperature 273K are:
View Solutionif work is done by the system then W is
View SolutionA gas expands isothermally and reversibly. The work done by the gas is
View SolutionThe work done by 1 mole of ideal gas during an adiabatic process is (are ) given by :
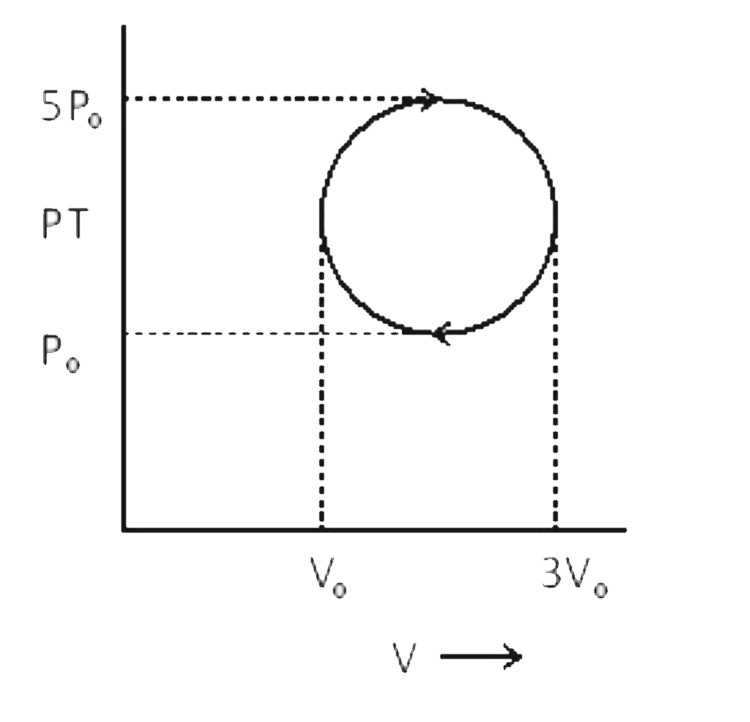
View SolutionP – V graph for a cyclic process is shown in figure . Work done is given by
View SolutionThe curves A and B in the figure shown P-V graphs for an isothermal and an adiabatic process for an idea gas. The isothermal process is represented by the curve A.
View SolutionThe curves A and B in the figure shown P-V graphs for an isothermal and an adiabatic process for an idea gas. The isothermal process is represented by the curve A.

View Solution
