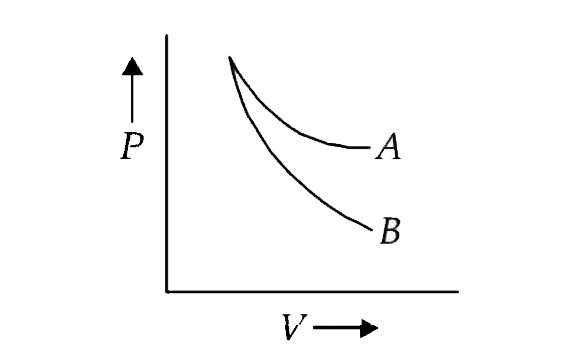
The curves A and B in the figure shown P-V graphs for an isothermal and an adiabatic process for an idea gas. The isothermal process is represented by the curve A.

Video Solution
Text Solution
The slope of p−V curve is more for adiabatic process than for isothermal process. From the graph it is clear that slope for B is greater than the slope for A .
|
Topper's Solved these Questions
- ARCHIVES 1 VOLUME 6Book:CENGAGE PHYSICS ENGLISHChapter:ARCHIVES 1 VOLUME 6Exercise:Single Correct
Explore 54 Videos
- ARCHIVES 1 VOLUME 6Book:CENGAGE PHYSICS ENGLISHChapter:ARCHIVES 1 VOLUME 6Exercise:Multi Correct
Explore 13 Videos
- ARCHIVES 1 VOLUME 6Book:CENGAGE PHYSICS ENGLISHChapter:ARCHIVES 1 VOLUME 6Exercise:Integer
Explore 4 Videos
- ARCHIVES 2 VOLUME 6Book:CENGAGE PHYSICS ENGLISHChapter:ARCHIVES 2 VOLUME 6Exercise:Integer
Explore 4 Videos
Similar Questions
Knowledge Check
The specific heat of a gas in an isothermal process is
AinfiniteBzeroCnegativeDremains constant
For an isothermal process
View SolutionIf heat is supplied to an ideal gas in an isothermal process.
View SolutionCan a process on an ideal gas be both adiabatic and isothermal. ?
View SolutionWhich of the following graph does not belong to isothermal process for an ideal gas?
View SolutionIn an isothermal process
View SolutionShow that the slope of p−V diagram is greater for an adiabatic process as compared to an isothermal process.
View SolutionChange in internal energy in an isothermal process for ideal gas is
View Solution
