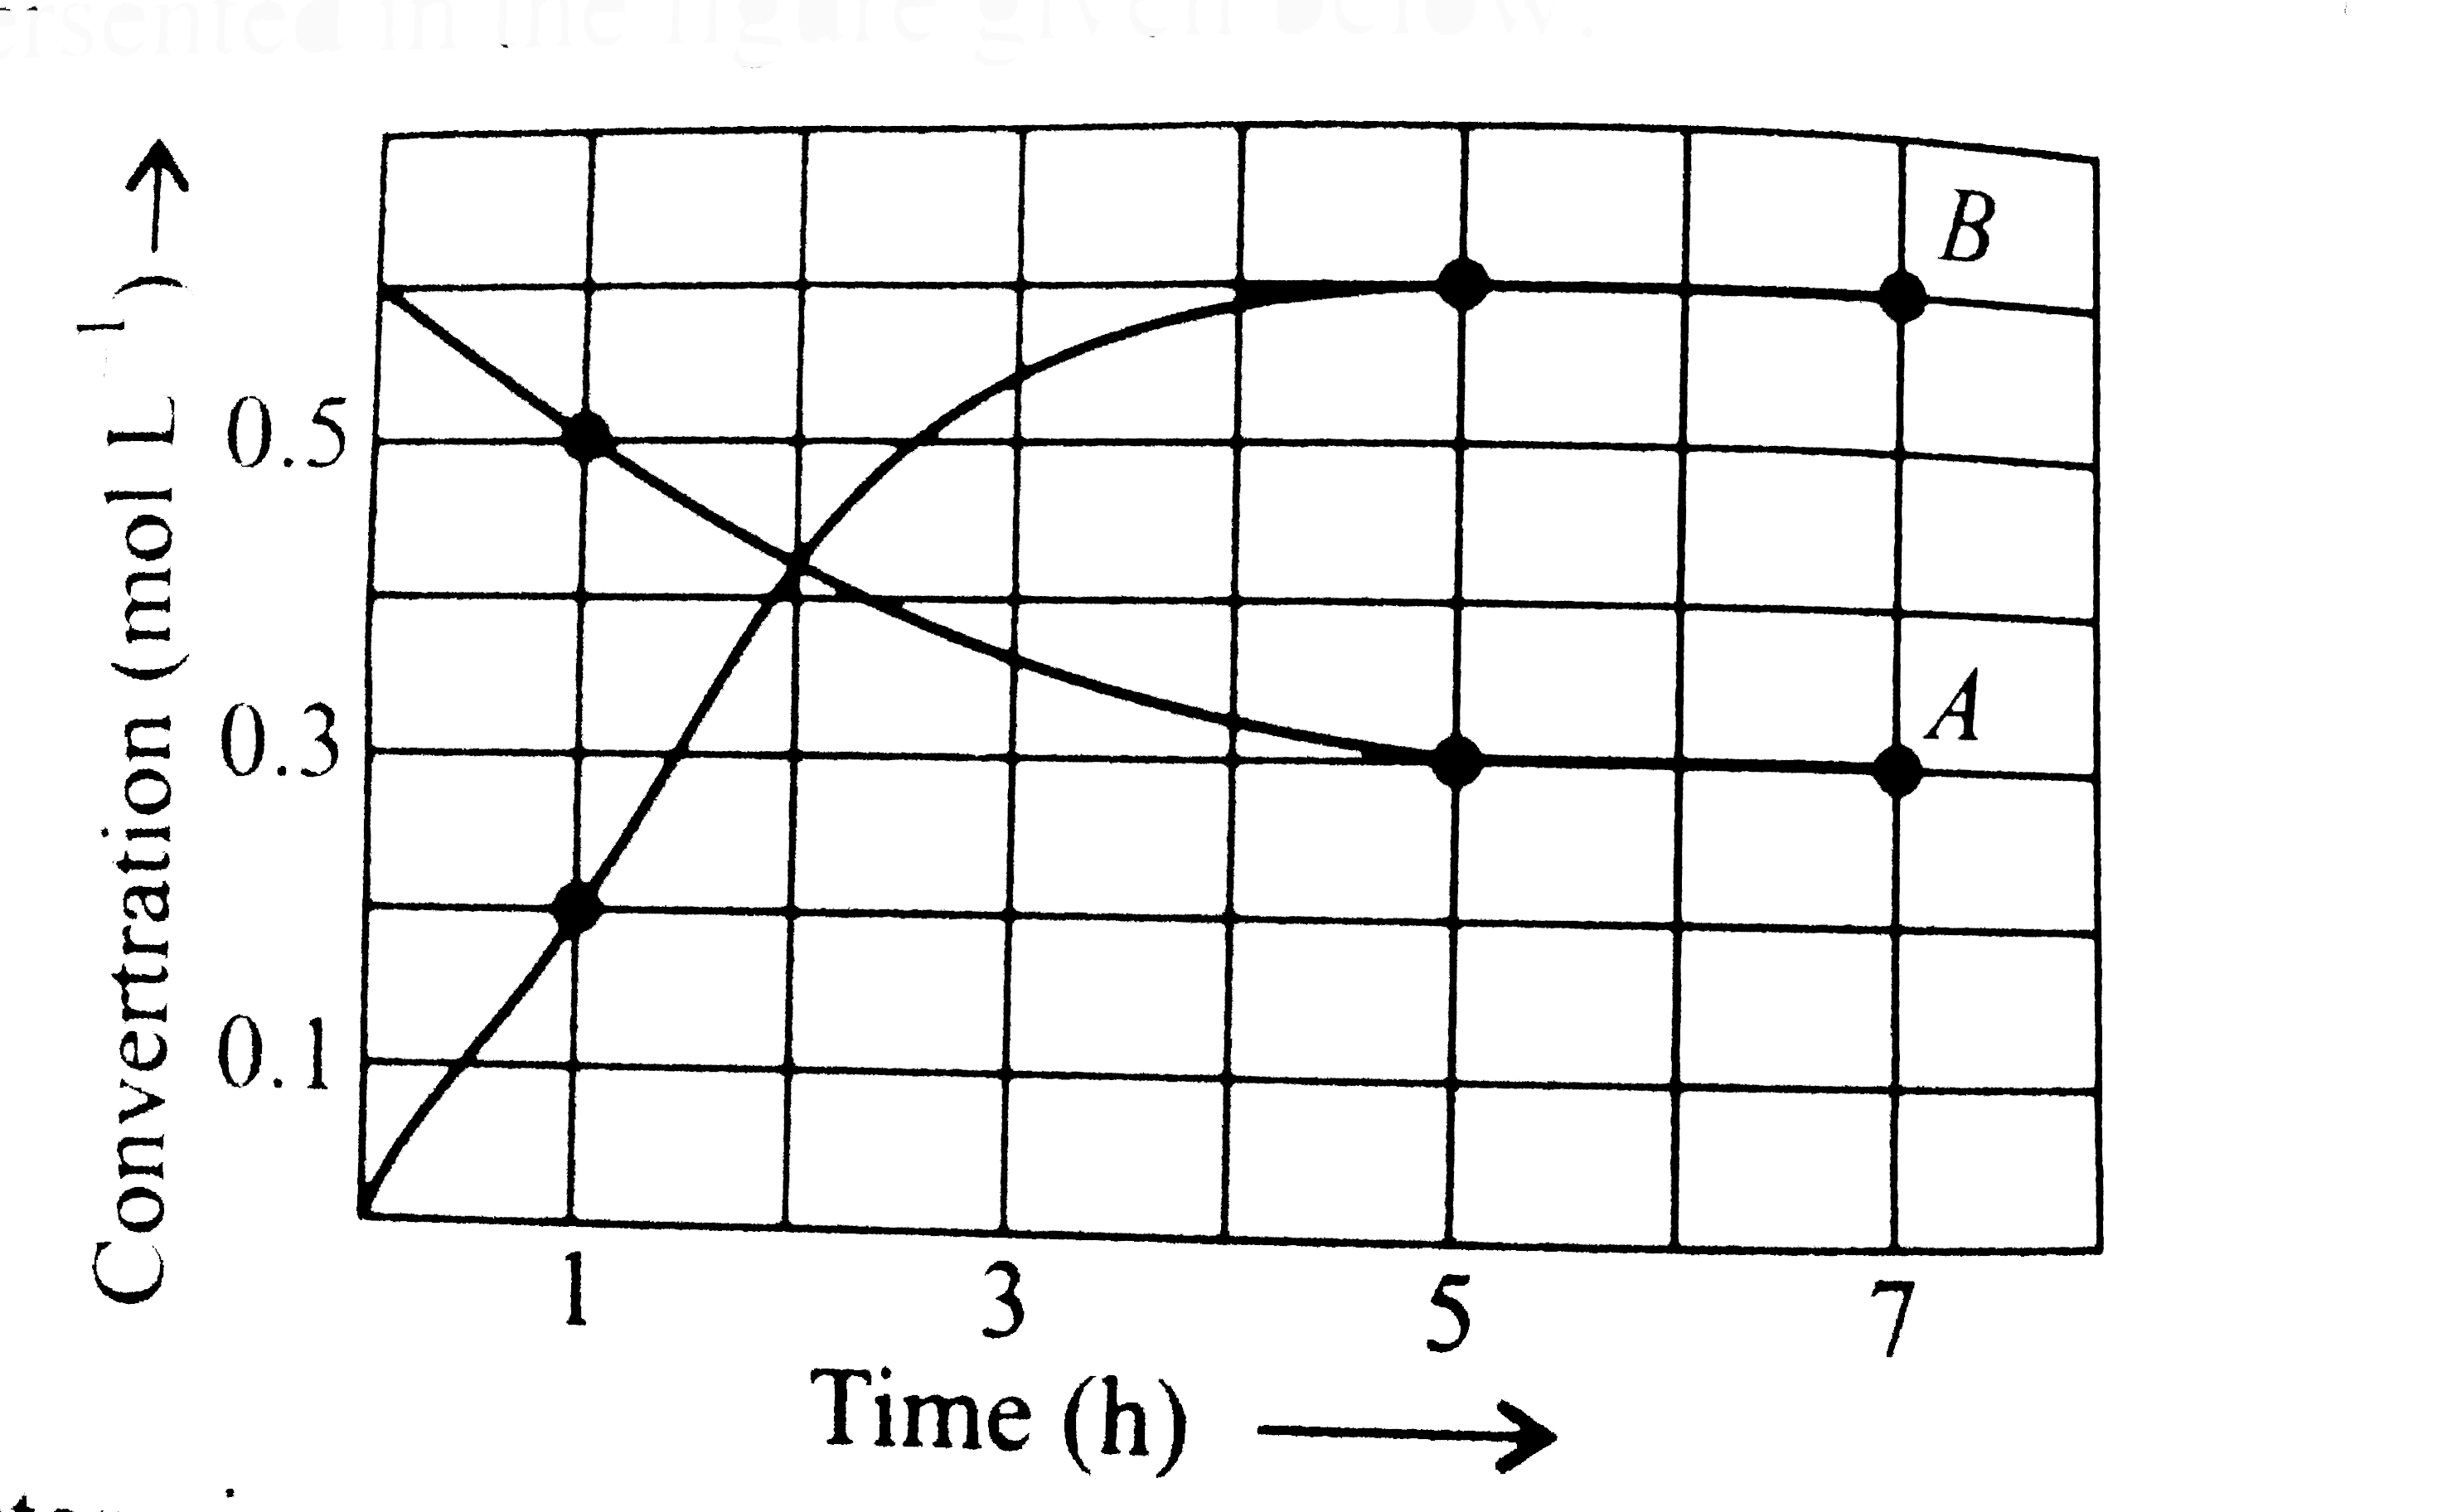
The progress of the reaction A⇔nB with time is persented in the figure given below:
Determine
a. The value of n.
b. The equilibrium constant K.
c. The initial rate of concentration of A.
a. A⇔nB
From the graph, it is clear that in 4 h, decrease in concentration of A=0.2molL−1, increase in concentration of B=0.4molL−1, increase in concentration of B is double as compared to decrease in concentration of A.
Therefore, n=2
b. A⇔2B
At equilibrium,
[A]=0.3
At equilibrium,
[B]=0.6
Kc=[B]2[A]=0.620.3=1.2
c. For the first half hour, change in concentration of A is 0.6−0.5=0.1molL−1
Initial rate of conversion of A into B is
Δ[A]Δt=0.11=0.1molL−1h−1
Topper's Solved these Questions
- CHEMICAL EQUILIBRIUMBOOK - CENGAGE CHEMISTRY ENGLISHCHAPTER - CHEMICAL EQUILIBRIUMEXERCISE - Subjective type
1 Videos
- CHEMICAL EQUILIBRIUMBOOK - CENGAGE CHEMISTRY ENGLISHCHAPTER - CHEMICAL EQUILIBRIUMEXERCISE - Archives (True/False)
4 Videos
- CHEMICAL BONDING AND MOLECULAR STRUCTUREBOOK - CENGAGE CHEMISTRY ENGLISHCHAPTER - CHEMICAL BONDING AND MOLECULAR STRUCTUREEXERCISE - Archives Subjective
15 Videos
- CLASSIFICATION AND NOMENCLATURE OF ORGANIC COMPOUNDSBOOK - CENGAGE CHEMISTRY ENGLISHCHAPTER - CLASSIFICATION AND NOMENCLATURE OF ORGANIC COMPOUNDSEXERCISE - Analytical and Descriptive Type
3 Videos
Similar Questions
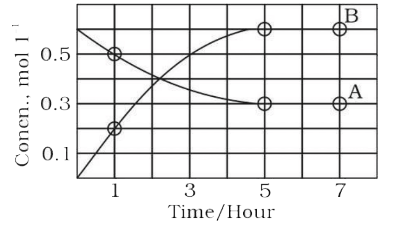
The progress of the reaction, A ⇌ nB with time, is presented in figure given below. Determine.
(i) The value of n,
(ii) The equilibrium constant K, and
(iii) the initial rate of conversion of A.
View SolutionThe progress of the reaction A→nB with time t is shown in Fig.
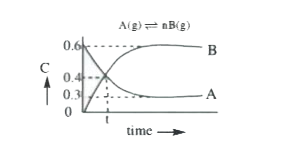
From this information answer the following questions
The value of n. is
View Solution
Knowledge Check
Assertion : The equilibrium constant for the reverse reaction is equal to the inverse of the equilibrium constant for the forward reaction .
Reason : The value of equilibrium constant is independent of initial concentrations of the reactants and products.AIf both assertion and reason are true and reason is the correct explanation of assertion.BIf both assertion and reason are true but reason is not the correct explanation of assertion.CIf assertion is true but reason is false.DIf both assertion and reason are false.
Determine the values of equilibrium constant (KC)andΔGo for the following reaction :
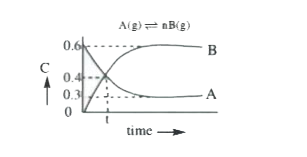
View SolutionThe progress of the reaction A→nB with time t is shown in Fig.
From this information answer the following questions
The equilibrium constant KC is
View SolutionFor the reaction A+B⇔C, the rate constants for the forward and the reverse reactions are 4×10² and 2×10² respectively. The value of equilibrium constant K for the reaction would be
View SolutionFor a reaction A+2B→2C, the kinetic data is given below:
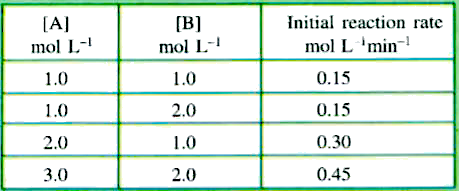
Determine the order of the reaction and write the rate law.
View SolutionThe unit of equilibrium constant Kc for the reaction A+B⇔C would be
View SolutionKp for the reaction A⇔B is 4. If initially only A is present then what will be the partial pressure of B after equilibrium ?
View SolutionThe reaction A+B⇔C+D is studied in a one litre vessel at 250∘C . The initial concentration of A was 3n and that of B was n. When equilibrium was attained, equilibrium concentration of C was found to the equal to the equilibrium concentration of B. What is the concentration of D at equilibrium ?
View Solution
