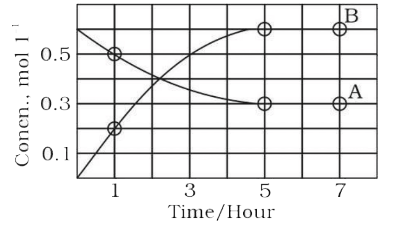
The progress of the reaction, A ⇌ nB with time, is presented in figure given below. Determine.
(i) The value of n,
(ii) The equilibrium constant K, and
(iii) the initial rate of conversion of A.
(i) 2 (ii) 1.2 (iii) 0.1 mole–1hr–1
(i) According to the figure, in the given time of 4 hours (1 to 5) concentration of A falls from 0.5 to 0.3 M, while in the same time concentration of B increases from 0.2 M to 0.6 M.
Decrease in concentration of A in 4 hours
=0.5−0.3=0.2M
Increase in concentration of B in 4 hours
=0.6−0.2=0.4M
Thus increase in concentration of B in a given time is twice then the decrease in concentration of A. Thus n 2.
(ii) K=[B2]eq[A]eq=(0.6)20.3=1.2M
(iii) Initial rate of conversion of A
= Change in conc. of A during 1 h
=0.6−0.51=0.1 mole−1hr−1
Topper's Solved these Questions
- CHEMICAL KINETICS BOOK - VMC MODULES ENGLISHCHAPTER - CHEMICAL KINETICS EXERCISE - JEE Main (Archive)
56 Videos
- CHEMICAL EQUILIBRIUMBOOK - VMC MODULES ENGLISHCHAPTER - CHEMICAL EQUILIBRIUMEXERCISE - IN-CHAPTER EXERCISE - G
10 Videos
- CHEMICAL THERMODYNAMICS BOOK - VMC MODULES ENGLISHCHAPTER - CHEMICAL THERMODYNAMICS EXERCISE - IN - CHAPTER EXERCISE - L
10 Videos
Similar Questions
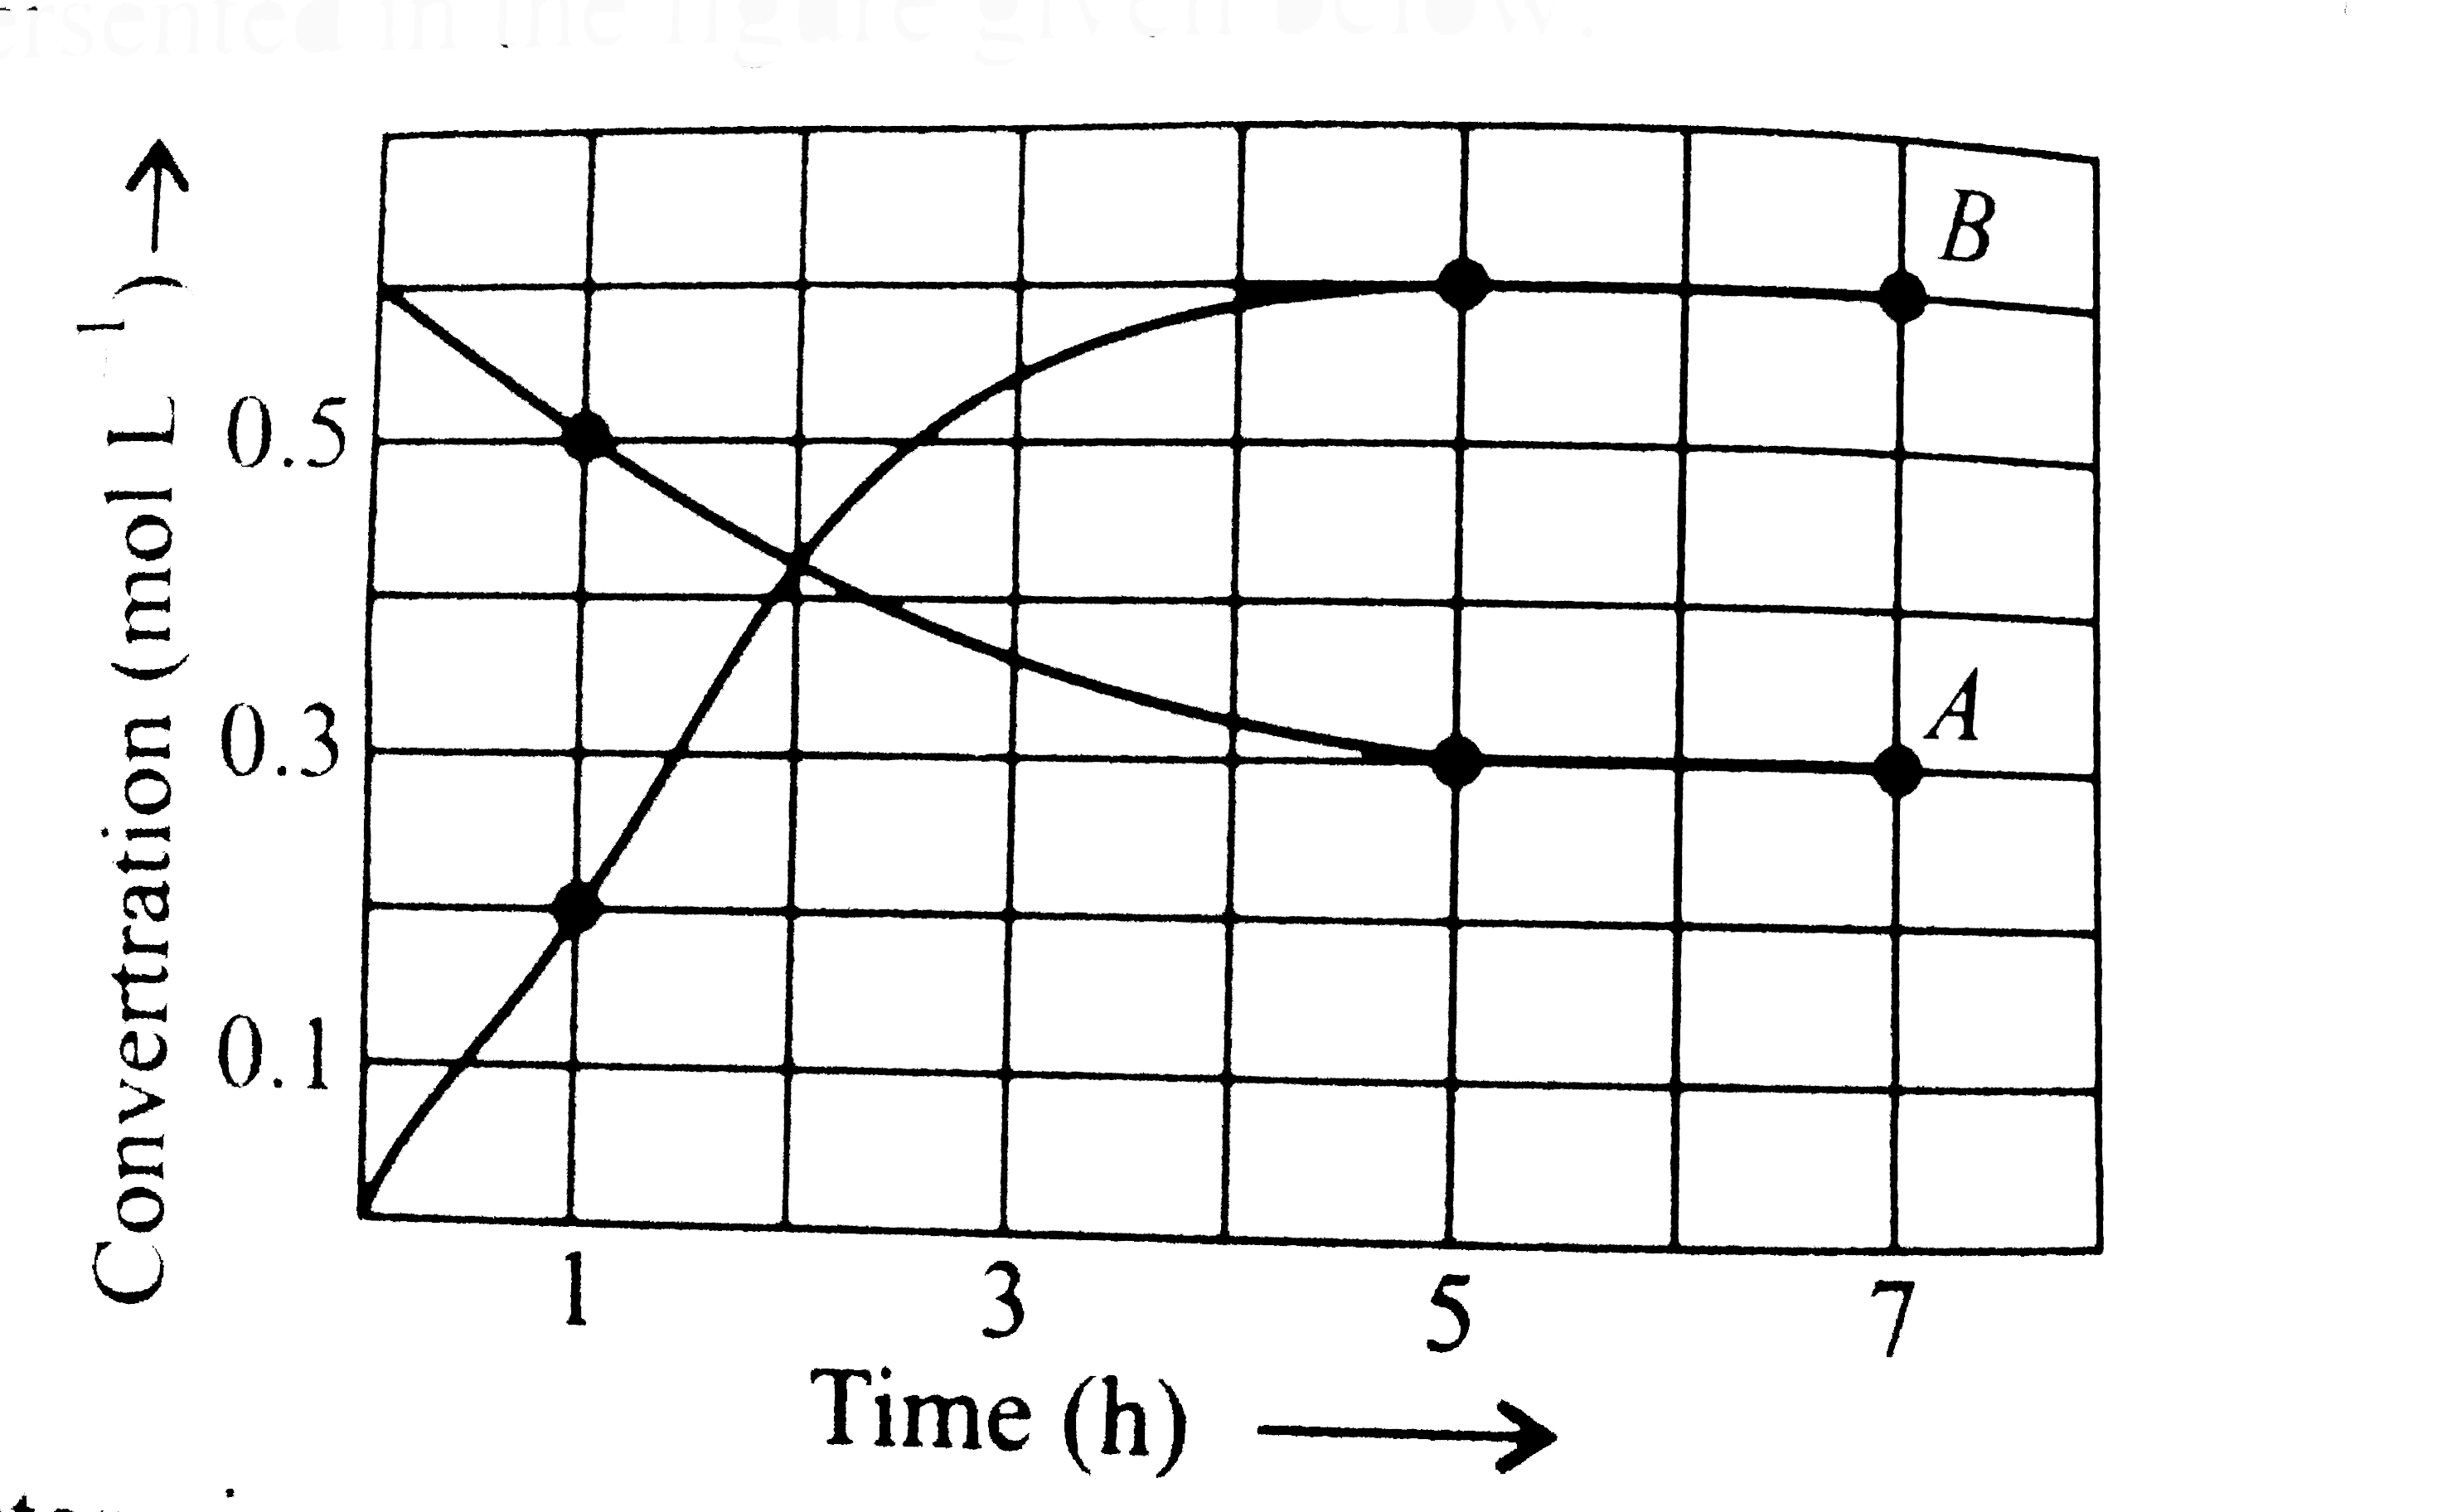
The progress of the reaction A⇔nB with time is persented in the figure given below:
Determine
a. The value of n.
b. The equilibrium constant K.
c. The initial rate of concentration of A.
View SolutionThe progress of the reaction A→nB with time t is shown in Fig.
From this information answer the following questions
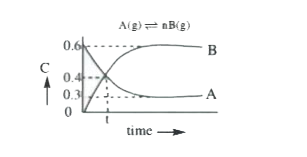
The equilibrium constant KC is
View SolutionDetermine the values of equilibrium constant (KC)andΔGo for the following reaction :
View SolutionThe progress of the reaction A→nB with time t is shown in Fig.
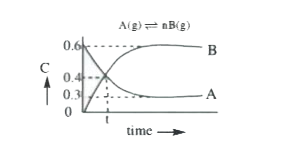
From this information answer the following questions
The value of n. is
View SolutionFor the reaction A+B⇔C, the rate constants for the forward and the reverse reactions are 4×10² and 2×10² respectively. The value of equilibrium constant K for the reaction would be
View SolutionAssertion:- The reaction quotient Q, has the same presentation form as the equilibrium constant K and Q is evaluated using any given concentrations of the species involved in the reaction, and not necesssarily equilibrium concenetrations.
Reason:- If the numerical value of Q is not the same as the value of equilibrium constant, that time reaction will never proceed.
View Solution(i) List the applications of equilibrium constants.
(ii) Predict the extent of reaction when the value of equilibrium constant is very high.
View SolutionThe probability distribution of a random variable X is given below

(i) Determine the value of K .
(ii) Determine P(X≤2)andP(X>2).
(iii) Find P(X≤2)+P(X>2).
View SolutionDefine the following terms :
(i) Half- life of a reaction (t1/2)
(ii) Rate constant (k).
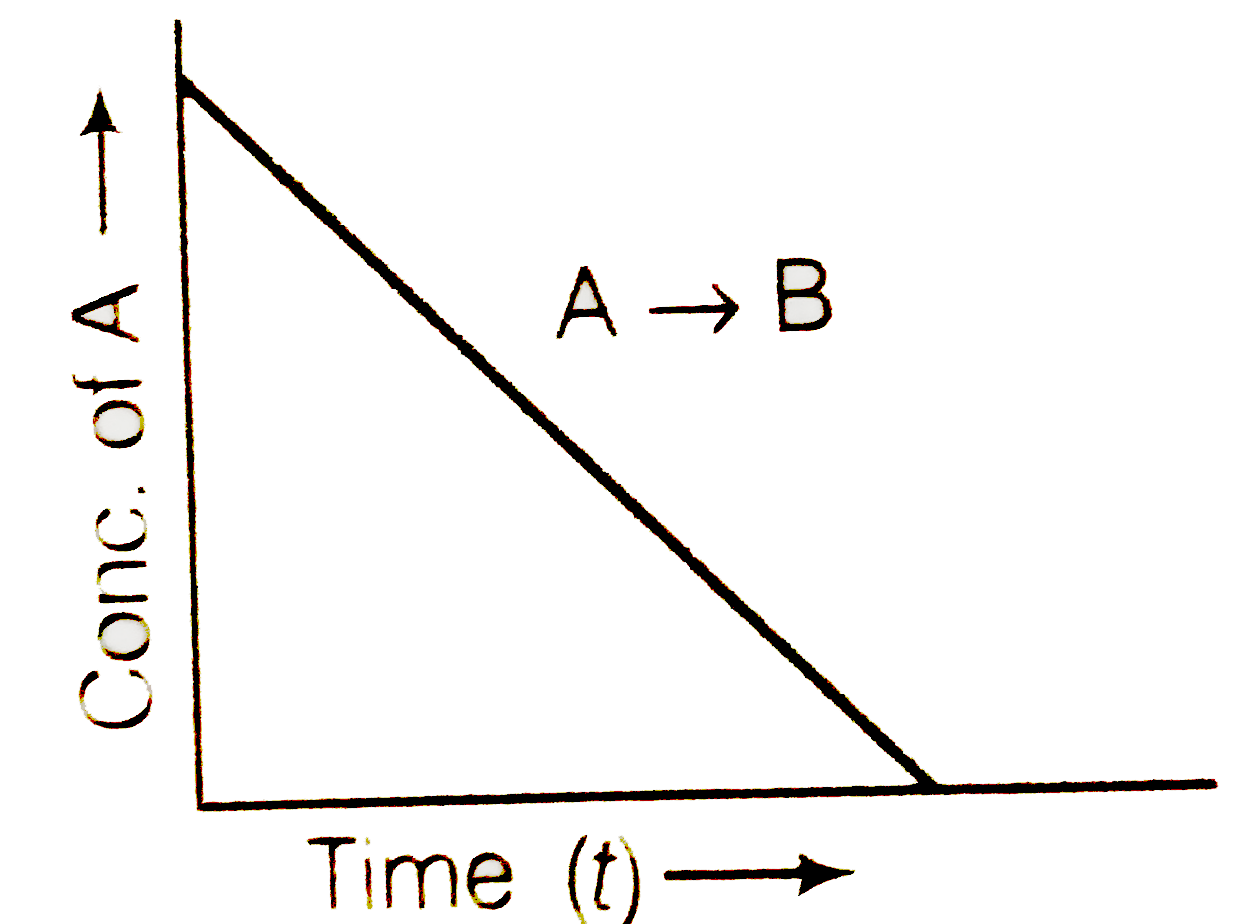
View SolutionFor a general reaction A→B, plot of concentration of A vs time is given in figure. Answer the following questions on the basis of this graph.
(i) what is the order of the reaction?
(ii) What is the slope of the curve ?
(iii) What are the units of rate constant?
View Solution
