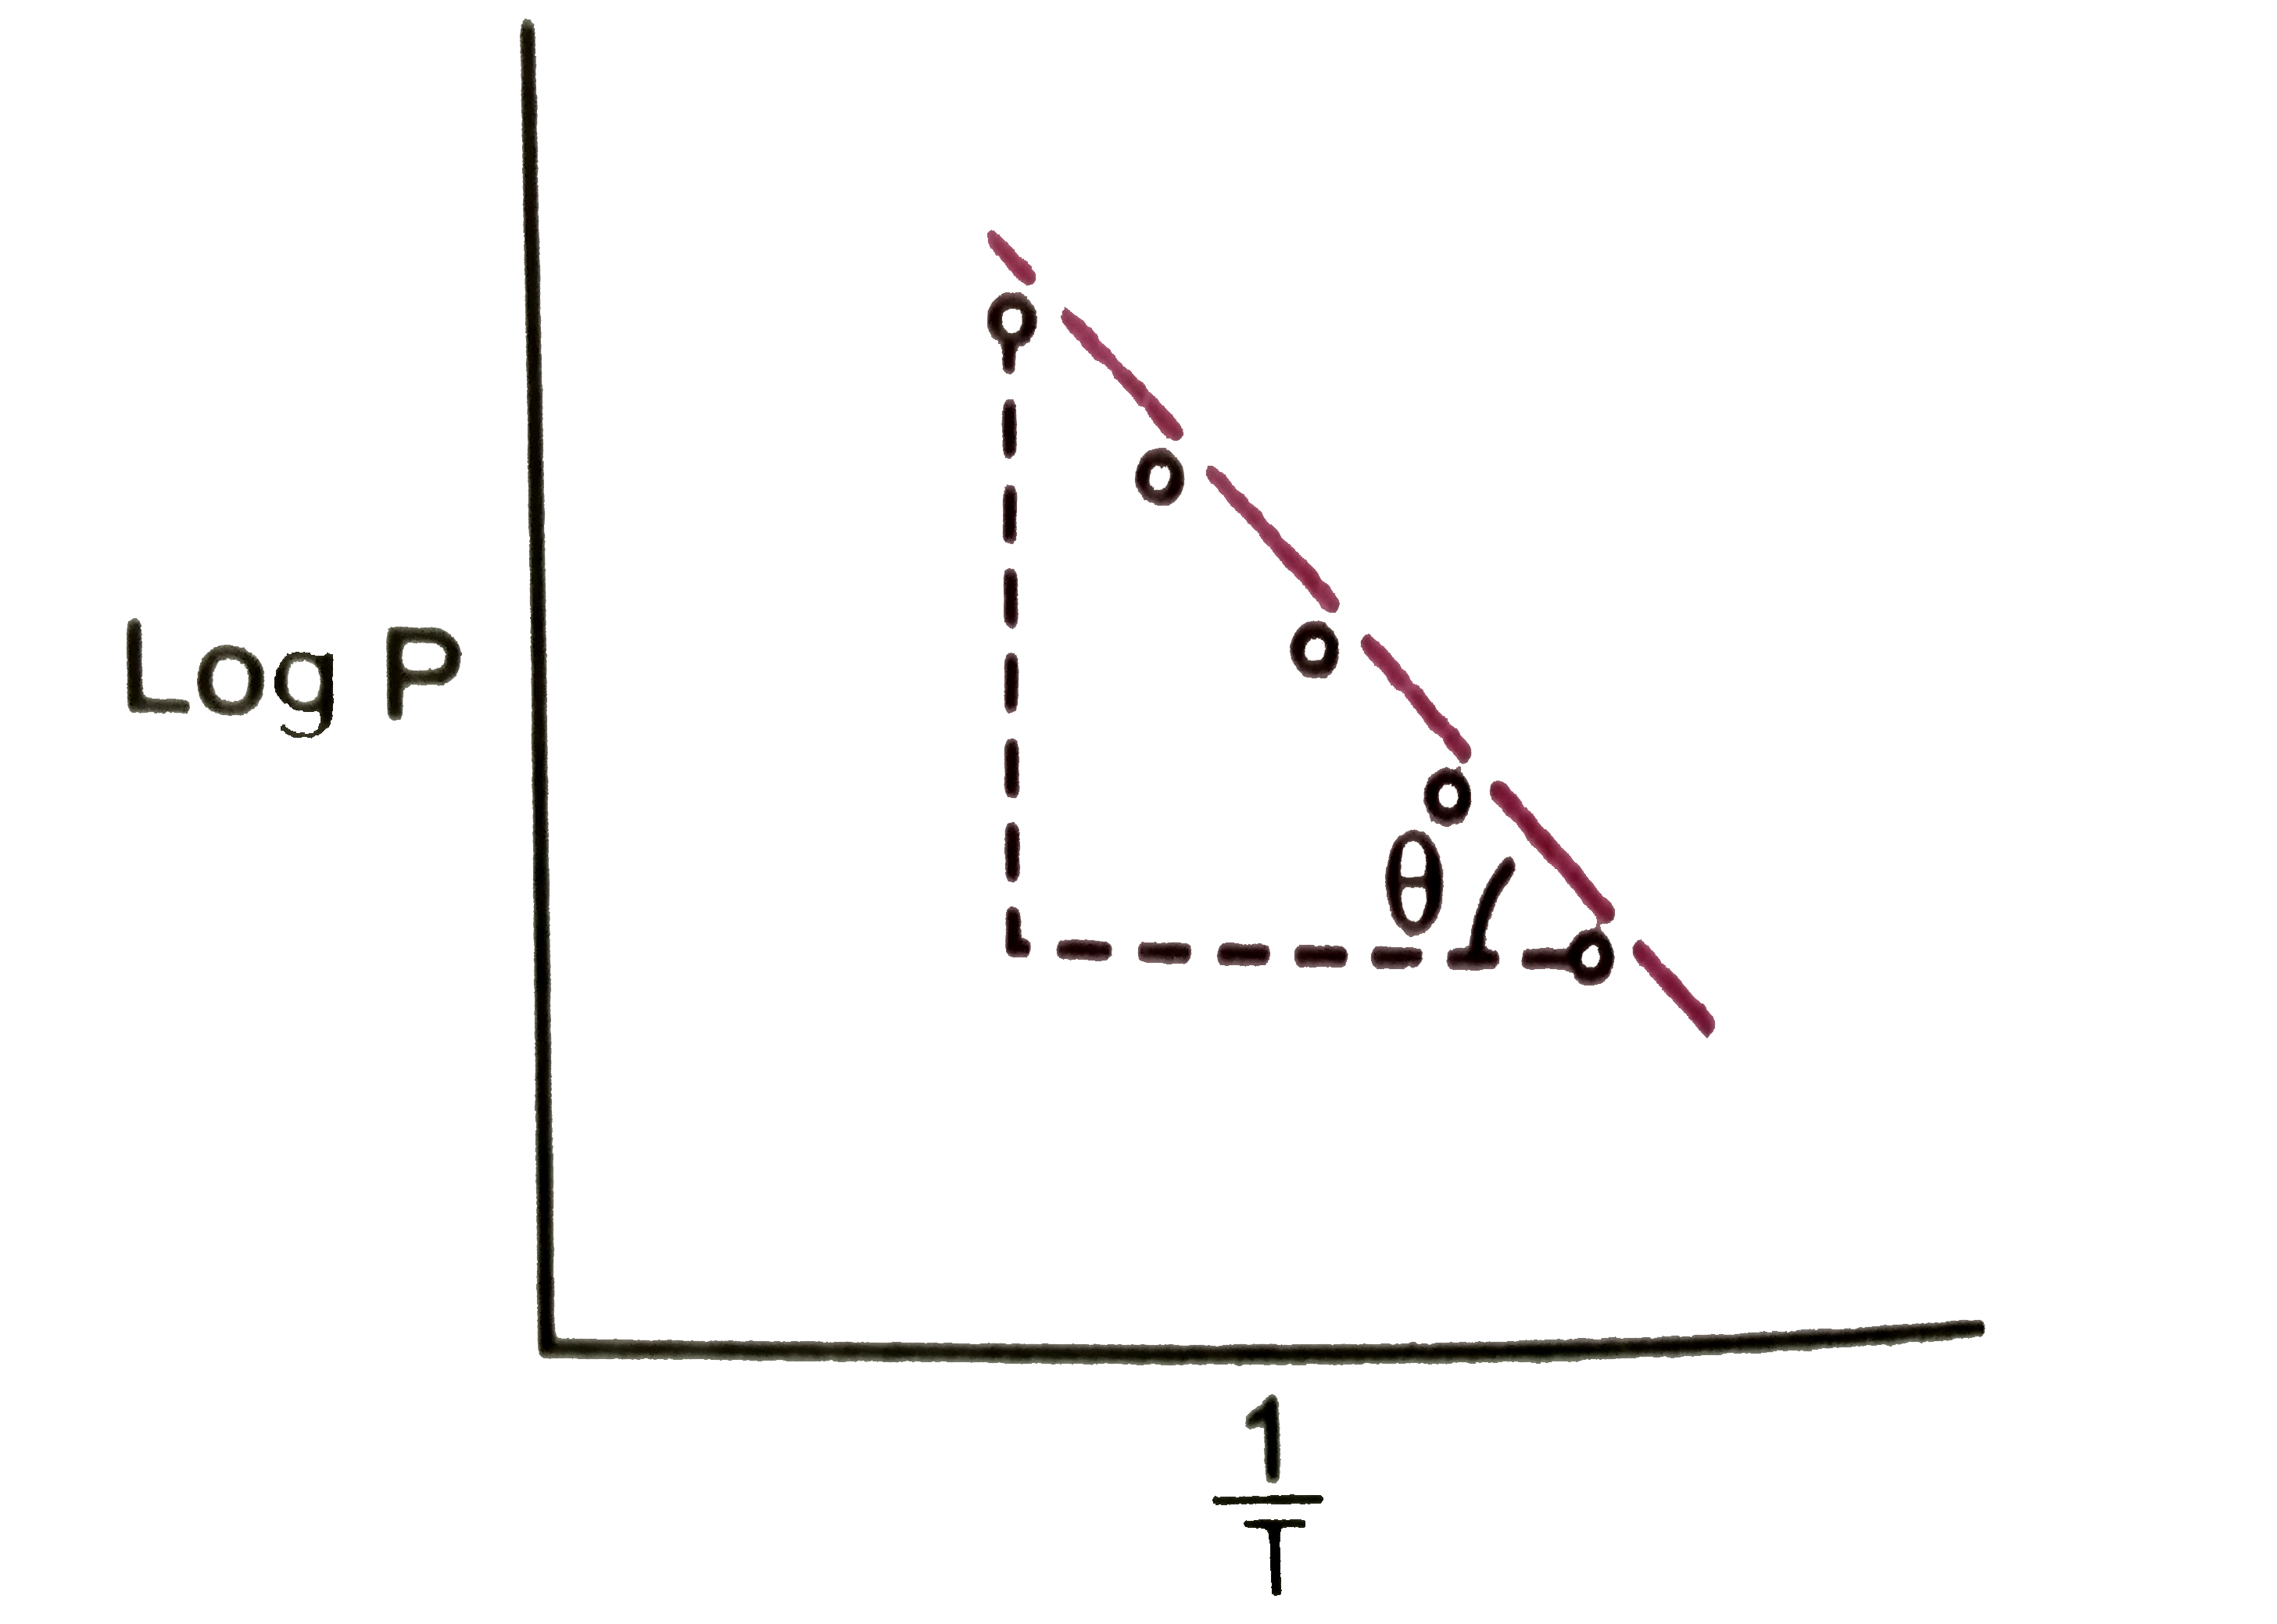
The variation of vapour pressure with temperature for a liquid was studied by plotting log P versus 1/T as shown in the Fig. The slope of the line (tanθ) was found to be -2 K. Then latent heat of vaporisation of the given liquid is

4.606 cal mol−1
2.303 cal mol−1
9.212 cal mol−1
8.314 cal mol−1
The correct Answer is:C
According to Clausis-Clapeyron equation,
logP=logA−ΔvapH2.303RT
Thus, plot of log P vs 1T is a straight line with slope =−ΔvapH2.303R=−2R (Given). Hence,
ΔvapH=2×2.303×2cal K−1
=9.212calmol−1
Topper's Solved these Questions
- STATES OF MATTER : GASES AND LIQUIDESBOOK - PRADEEPCHAPTER - STATES OF MATTER : GASES AND LIQUIDESEXERCISE - COMPETITION FOCUS (Miscellaneous)
6 Videos
- STATES OF MATTER : GASES AND LIQUIDESBOOK - PRADEEPCHAPTER - STATES OF MATTER : GASES AND LIQUIDESEXERCISE - II. Multiple Choice Questions
7 Videos
- STATES OF MATTER : GASES AND LIQUIDESBOOK - PRADEEPCHAPTER - STATES OF MATTER : GASES AND LIQUIDESEXERCISE - COMPETITION FOCUS (Liquefaction of gases and critical temperature)
3 Videos
- SOME p-BLOCK ELEMENTSBOOK - PRADEEPCHAPTER - SOME p-BLOCK ELEMENTSEXERCISE - Competition Focus (JEE( Main and Advanced)/Medical Entrance) VIII. Assertion-Reason Type Questions (Type I)
23 Videos
- STATES OF MATTER: SOLID MATTERBOOK - PRADEEPCHAPTER - STATES OF MATTER: SOLID MATTEREXERCISE - COMPETITION FOCUS (ASSERTION-REASON)
17 Videos
Similar Questions
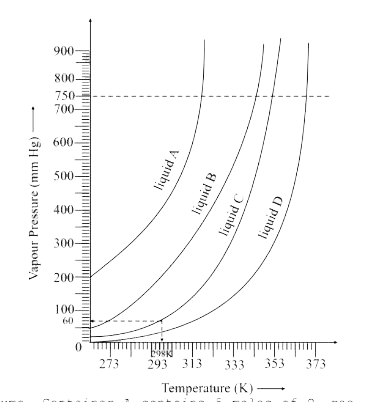
The variation of vapour pressure of different liquids with temperature is shown in figure

Calculate graphically boiling points of liquids A and B.
View SolutionThe variation of vapour pressure of different liquids with temperature is shown in figure

Calculate graphically boiling points of liquids A and B.
View Solution
Knowledge Check
The graph between the log K versus 1T is a straight line. The slope of the line is
A−2.303REaB−Ea2.303RC2.303REaDEa2.303RFor a first order reaction, the plot of log k against 1/T is a straight line. The slope of the line is equal to
AEaRB2.303Ea×RCEa2.303D−Ea2.303RThe vapour pressure of a liquid varies with temperature as log P=−AT+I. The plot of
Alog P against T will be a straight lineBlog P against 1/T will be straight lineClog P against I will be a parabolaDNone of these
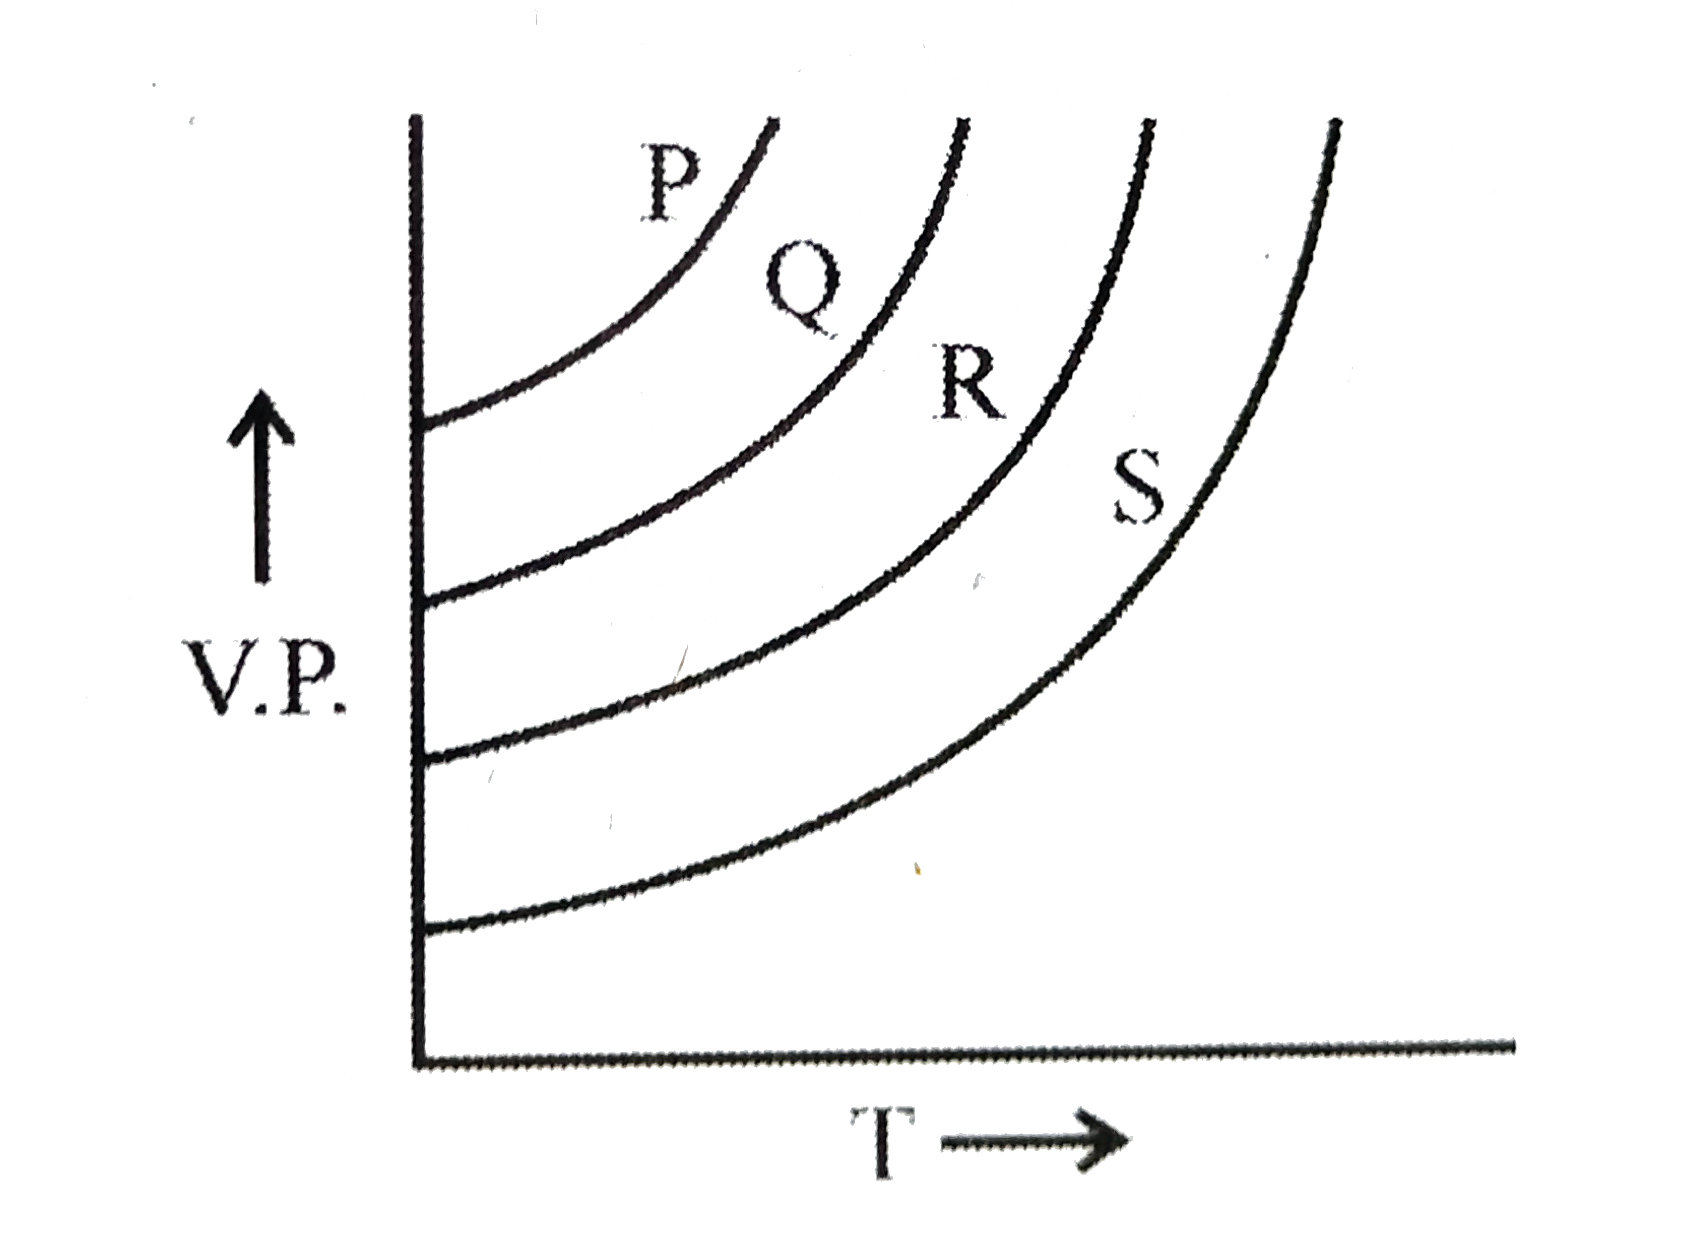
The given graph shows the vapour pressure -temperature curves for some liquids.Liquids P,Q,R and S respectively are

View SolutionThe variation of vapour pressure of different liquids with temperature is shown in figure

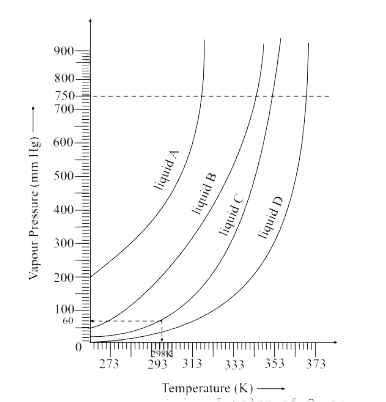
If we take liquid C in a closed vessel and heat it continuously. At what temperature will it boil?
View SolutionThe variation of vapour pressure of different liquids with temperature is shown in figure

If we take liquid C in a closed vessel and heat it continuously. At what temperature will it boil?
View SolutionThe vapour pressure of a liquid varies with temperature as log P=−AT+I. The plot of
View SolutionIn accordance to Arrhenius equation, the plot of log k against 1T is a straight line. The slope of the line is equal to
View Solution
