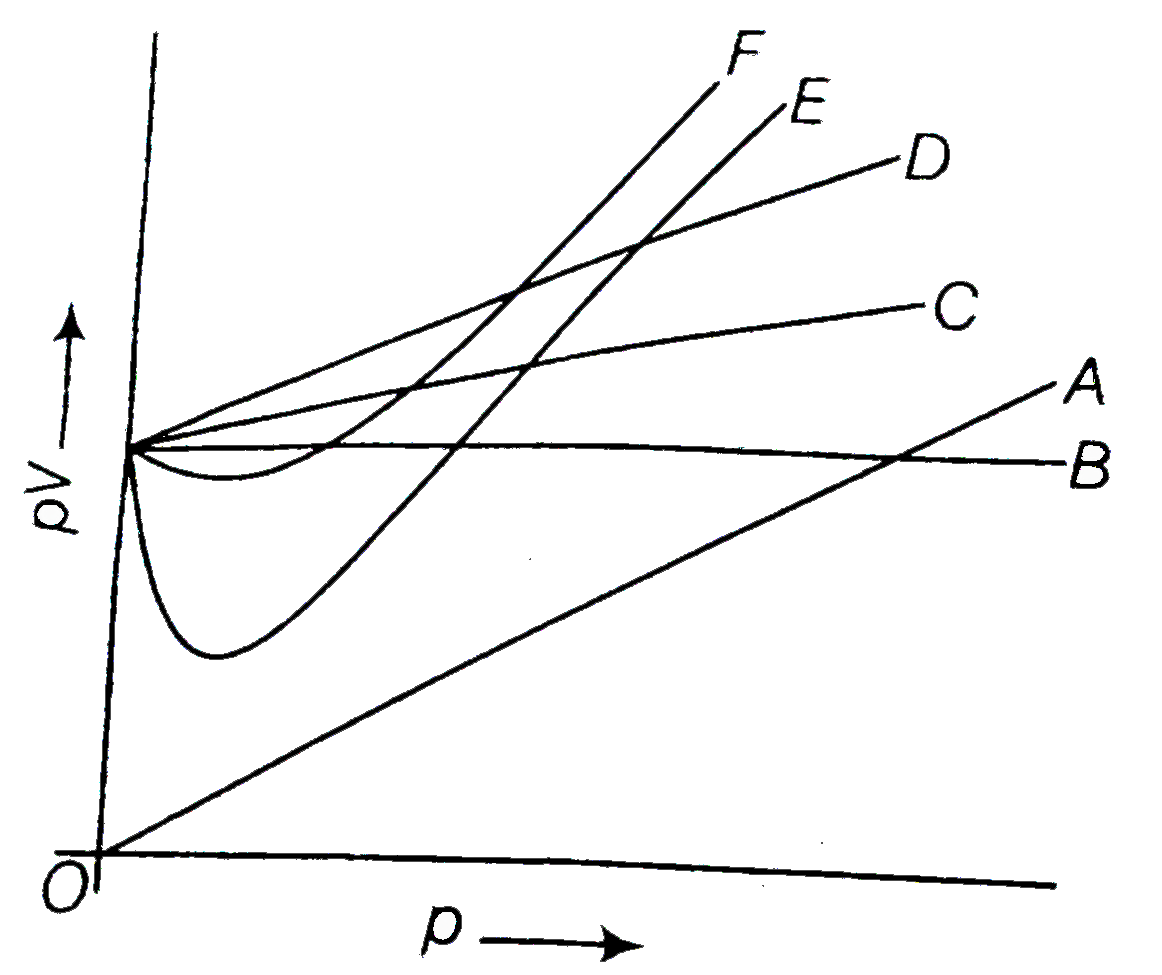
Which curve in Fig. represents the curve of ideal gas ?

A
only B
B
C and D
C
E and F
D
A and B
Text Solution
The correct Answer is:A
For ideal gas pV is constant at all the pressure. So, only B is representing the ideal gas.
|
Topper's Solved these Questions
- STATES OF MATTER BOOK - KUMAR PRAKASHANCHAPTER - STATES OF MATTER EXERCISE - SECTION - D SOLUTION OF NCERT EXEMPLAR PROBLEMS (Short Answer Type Questions)
23 Videos
- STATES OF MATTER BOOK - KUMAR PRAKASHANCHAPTER - STATES OF MATTER EXERCISE - SECTION - D SOLUTION OF NCERT EXEMPLAR PROBLEMS (Matching The Columns)
3 Videos
- STATES OF MATTER BOOK - KUMAR PRAKASHANCHAPTER - STATES OF MATTER EXERCISE - SECTION - C MULIPLE CHOICE QUESTIONS (MCQs)
93 Videos
- SOME BASIC CONCEPTS OF CHEMISTRYBOOK - KUMAR PRAKASHANCHAPTER - SOME BASIC CONCEPTS OF CHEMISTRYEXERCISE - Section - D (Solutions of NCERT Exemplar Problems) (Long Answer Type Questions)
4 Videos
- STRUCTURE OF ATOMBOOK - KUMAR PRAKASHANCHAPTER - STRUCTURE OF ATOMEXERCISE - QUESTINS PAPER FROM MODULE (SECTION -D)
2 Videos
Similar Questions
Knowledge Check
Which curve in figure represents the curve of ideal gas ?
 AOnly BBC and DCE and FDA and B
Which curve in figure represents the curve of ideal gas?
 AB onlyBC and D onlyCE and F onlyDA and B only
Which curve in the following graph represents the curve of ideal gas ?
 AB onlyBC and D onlyCE and F onlyDA and B only
Which curve does not represent Boyl's law ?
View SolutionThe given curve represents the variation of temperature as a function of volume for one mole of an ideal gas. Which of the following curves best represents the variation of pressure as a function of volume?

View SolutionWhich curve does not represent Boyle’s law
View SolutionWhich curve does not represent Boyle's law ?
View SolutionWhich of the following represents market demand curve ?

View Solution
