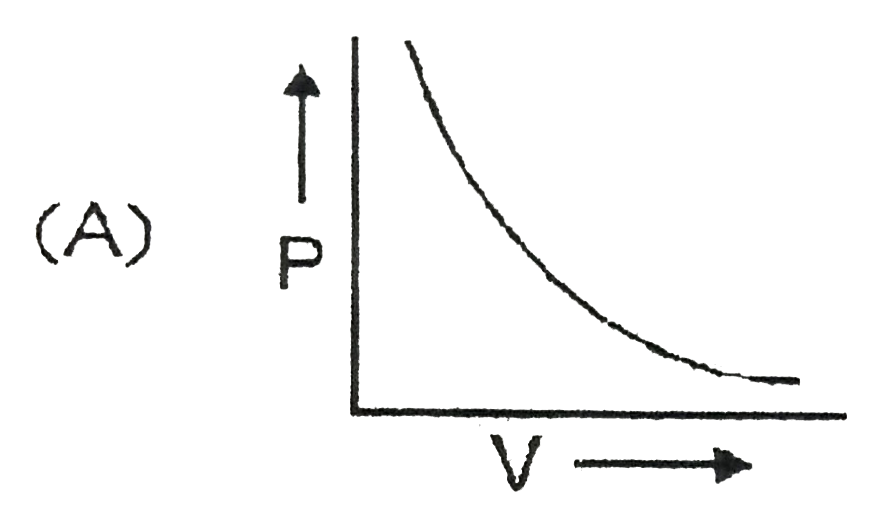
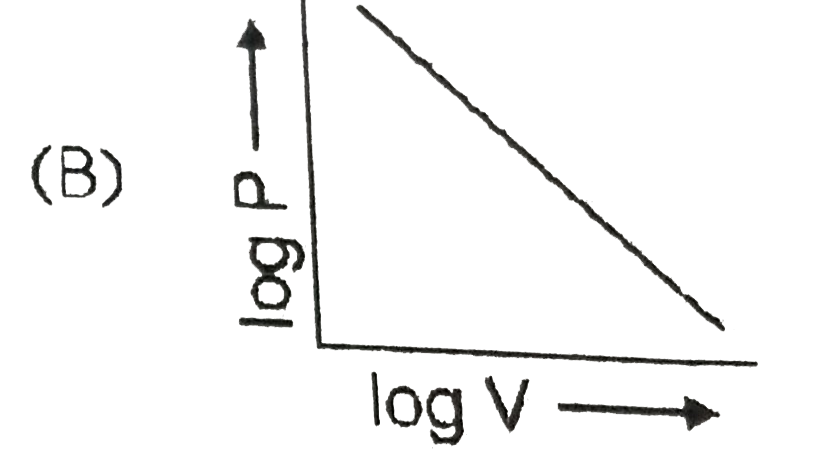
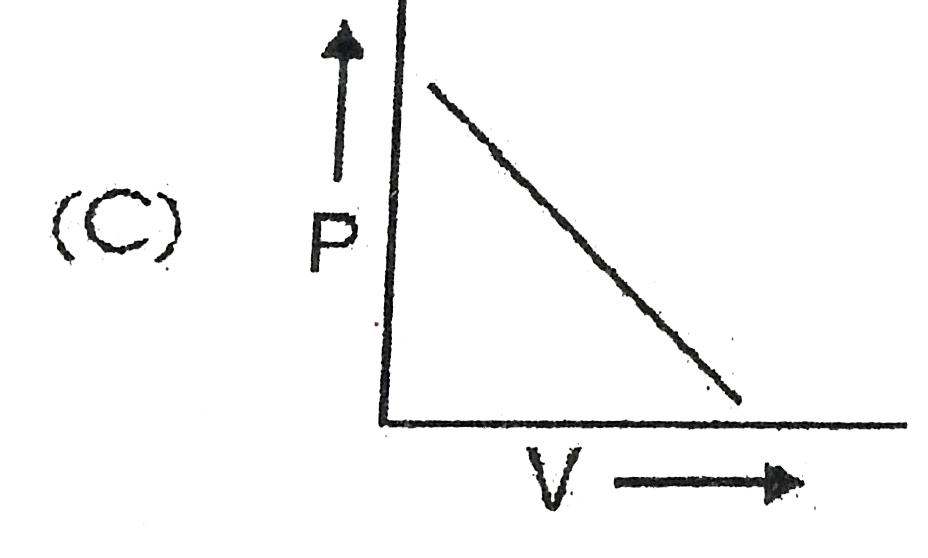
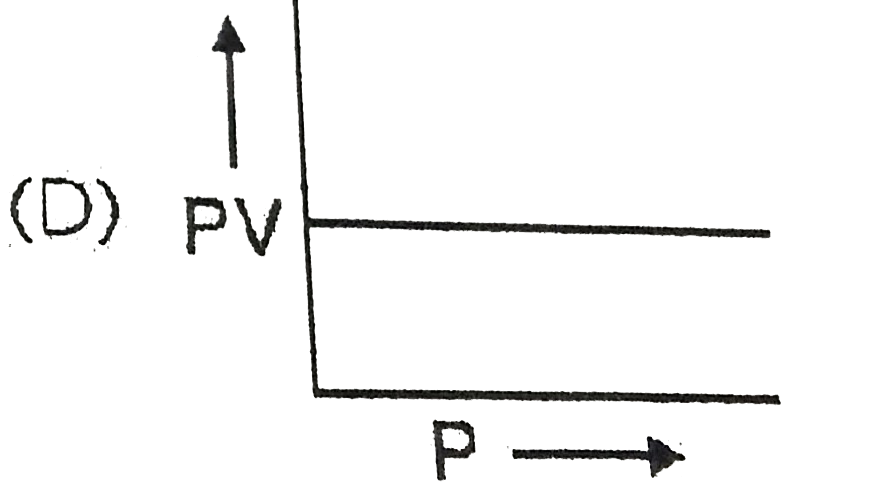
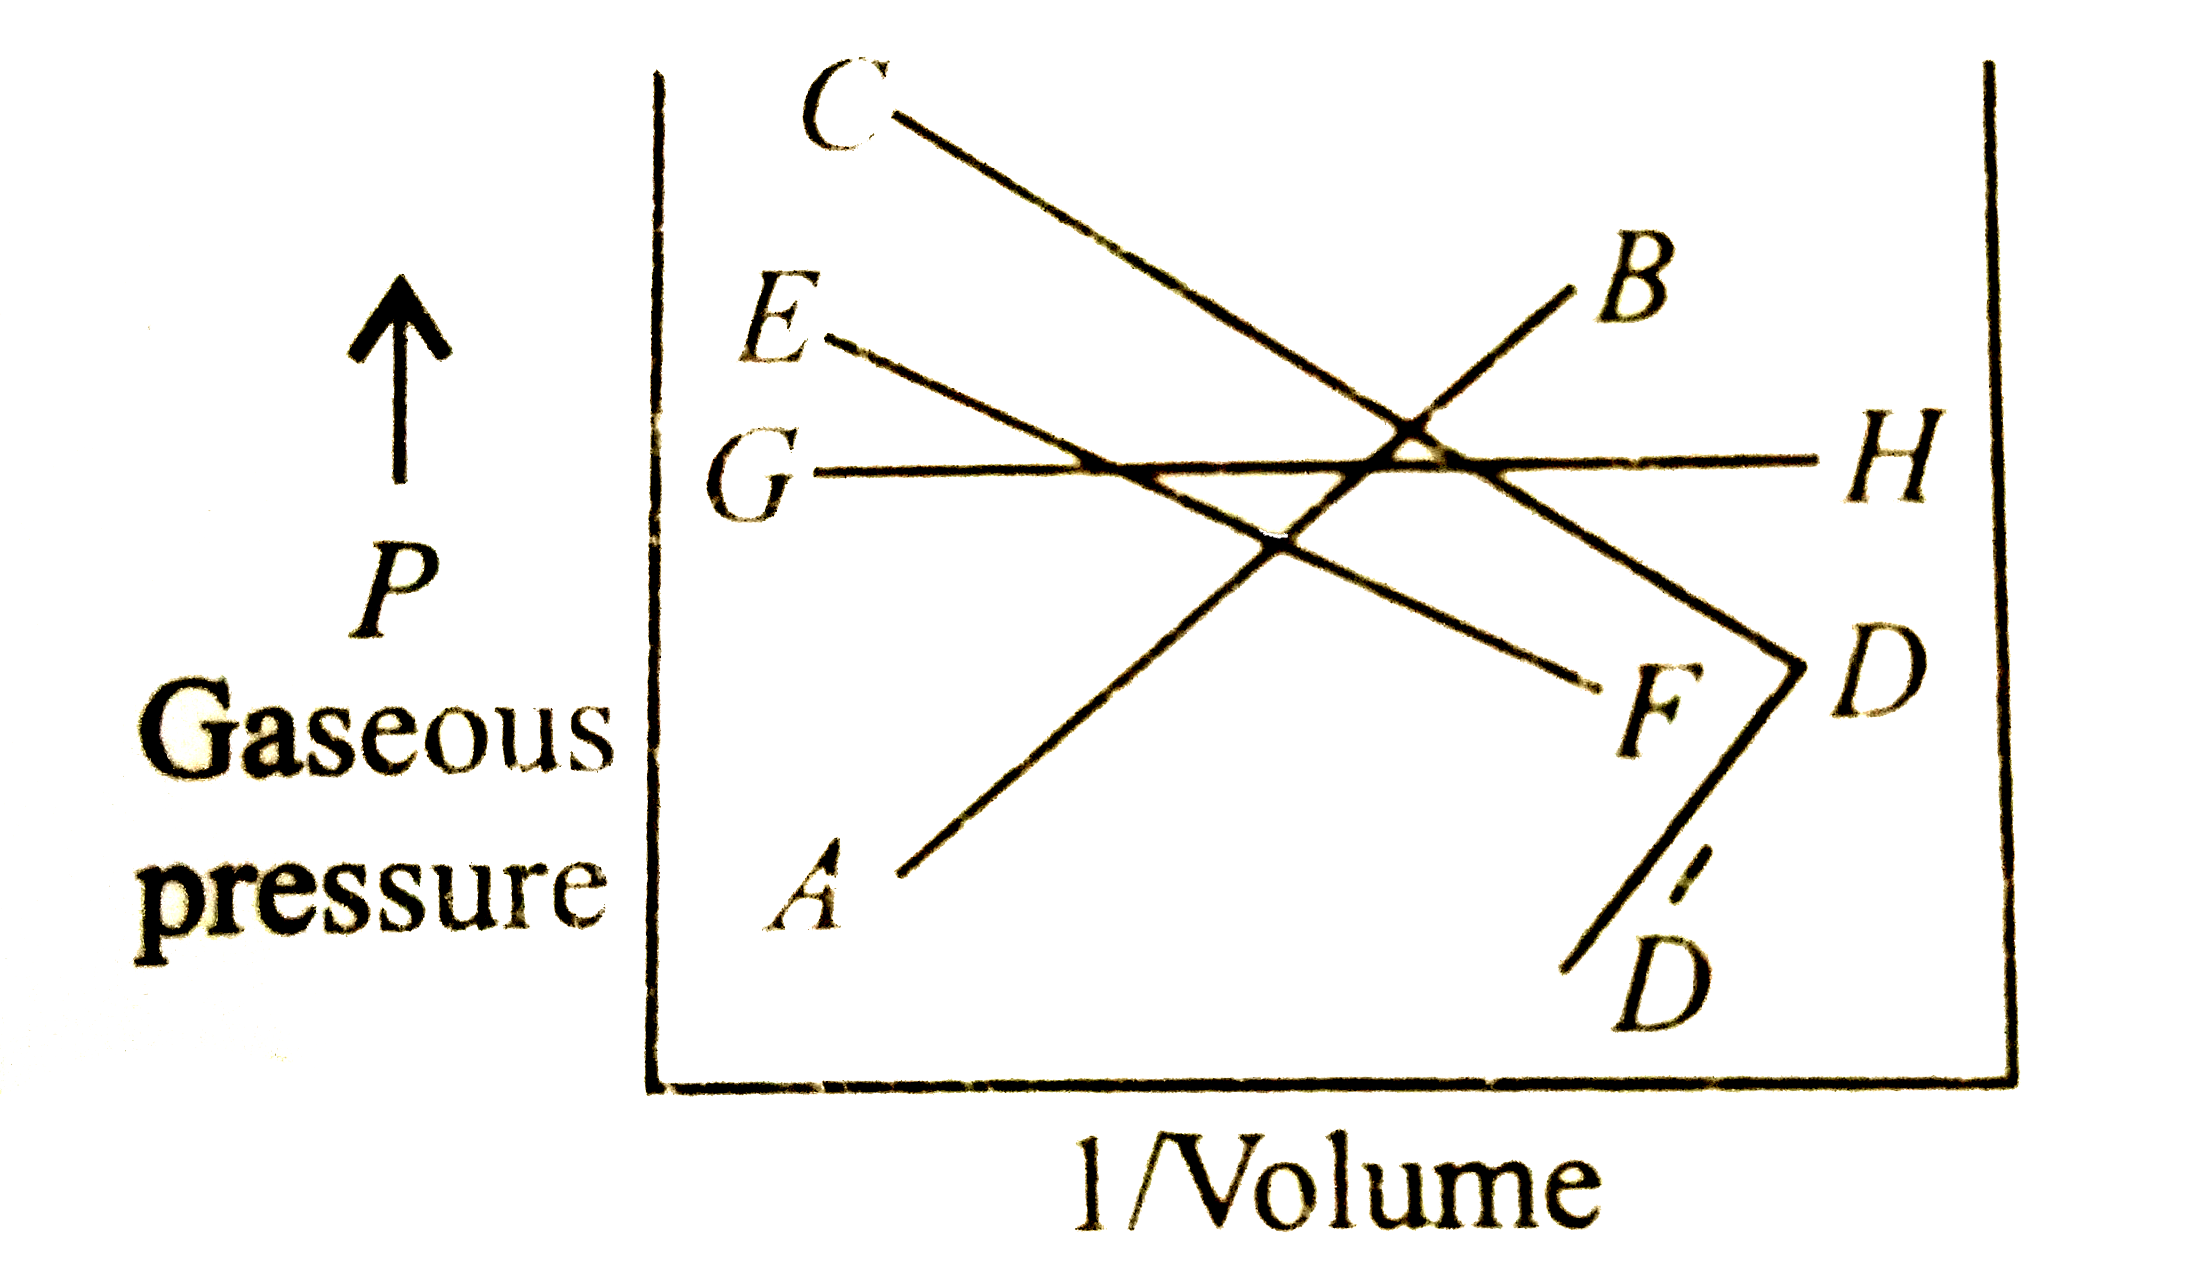
Which curve does not represent Boyl's law ?
The correct Answer is:C
To determine which curve does not represent Boyle's law, we need to understand the fundamental principles of Boyle's law itself. Here’s a step-by-step solution:
Step 1: Understand Boyle's Law
Boyle's law states that at constant temperature, the pressure (P) of a gas is inversely proportional to its volume (V). Mathematically, this can be expressed as:
PV=K
where K is a constant.
Step 2: Analyze the Graphs
We need to analyze the provided graphs to see which one does not represent the relationship defined by Boyle's law.
1. Hyperbolic Curve: A graph of pressure (P) versus volume (V) that shows a hyperbolic relationship indicates that as pressure increases, volume decreases, which is consistent with Boyle's law.
2. Logarithmic Graph: A graph that plots log(P) versus log(V) can also represent Boyle's law, as it will show a linear relationship with a negative slope.
3. Pressure vs. Volume Graph: A direct plot of pressure versus volume should yield a hyperbola. If the graph shows a linear relationship or any other shape that does not reflect the inverse relationship, it does not follow Boyle's law.
4. PV vs. P Graph: Since PV is constant, a graph of PV versus P would yield a constant line, which is also in accordance with Boyle's law.
Step 3: Identify the Incorrect Curve
From the analysis, the curve that does not show the expected hyperbolic relationship or any other representation of the inverse relationship between pressure and volume is the one that does not follow Boyle's law.
Conclusion
The curve that does not represent Boyle's law is Curve C.
---
Boyle's law states that at constant temperature, the pressure (P) of a gas is inversely proportional to its volume (V). Mathematically, this can be expressed as:
PV=K
where K is a constant.
We need to analyze the provided graphs to see which one does not represent the relationship defined by Boyle's law.
From the analysis, the curve that does not show the expected hyperbolic relationship or any other representation of the inverse relationship between pressure and volume is the one that does not follow Boyle's law.
The curve that does not represent Boyle's law is Curve C.
Similar Questions
Knowledge Check
Boyle.s Law is
AP1V1=P2V2BP2V1=P1V2CV1T1=V2T2DV1T1=V2T2
Which of the following curves represent(s) Boyle's law?
View SolutionWhich one of the given pressure versus volume plots represents Boyle's law ?
View SolutionWhich of the following curves does not represent motion in one dimensions?
View SolutionWhich reaction does not represent auto redox or disproptionation?
View SolutionWhich does not represent correct method?
View SolutionWhich does not represent correct method ?
View SolutionWhich of the following graph represents Boyle's law ?
View Solution
