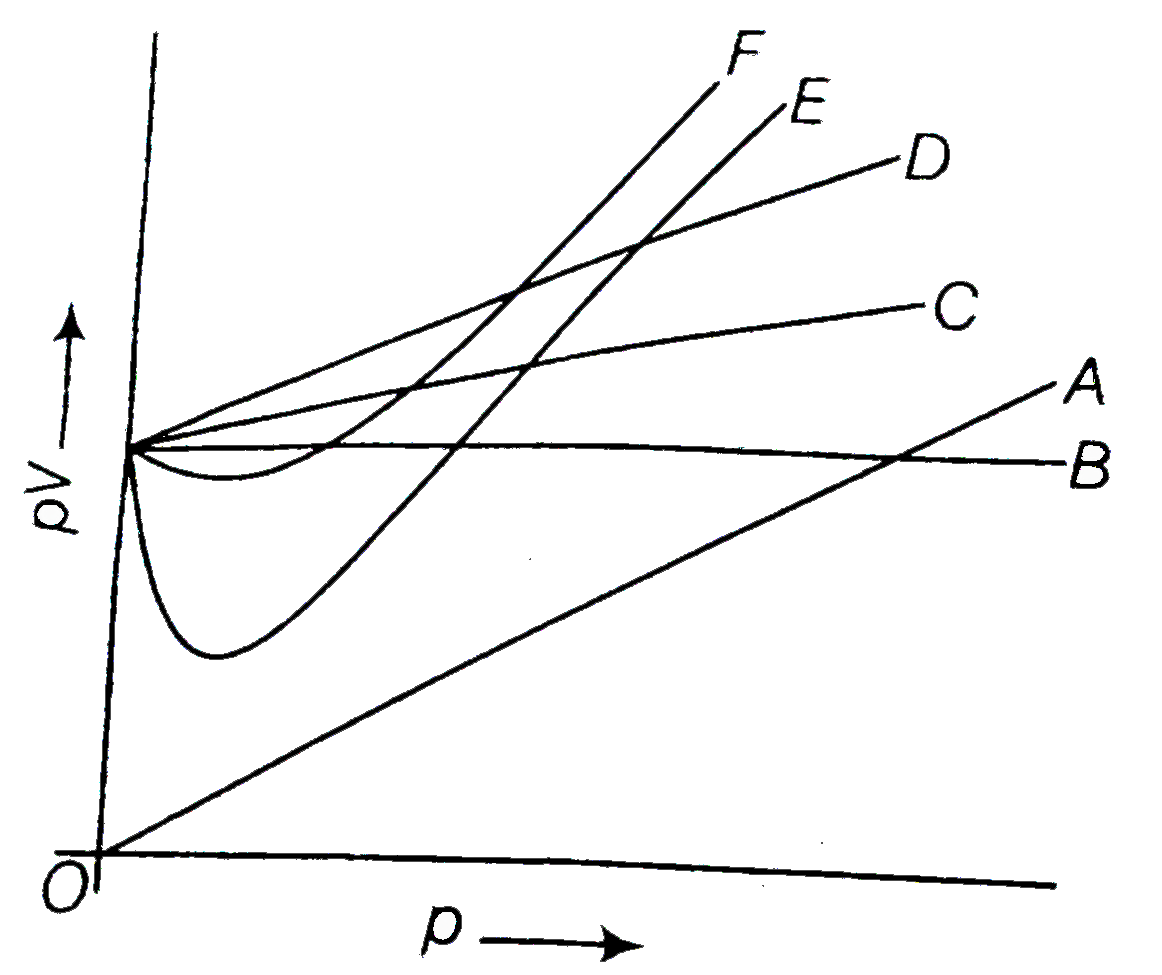
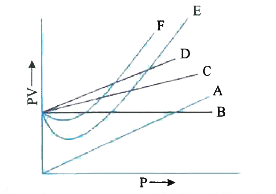
Which curve in figure represents the curve of ideal gas ?
A
B olny
B
C and d only
C
E and F only
D
A and B only.
Video Solution
Text Solution
The correct Answer is:A
Curve 'B' is for an ideal gas since it is a straight line indicating that PV remains constant.
|
Topper's Solved these Questions
- STATES OF MATTER : GASES AND LIQUIDSBOOK - DINESH PUBLICATIONCHAPTER - STATES OF MATTER : GASES AND LIQUIDSEXERCISE - Multiple Choice Question (Select the correct Answer)
13 Videos
- STATES OF MATTER : GASES AND LIQUIDSBOOK - DINESH PUBLICATIONCHAPTER - STATES OF MATTER : GASES AND LIQUIDSEXERCISE - Assignment (Very Short Answer Question)
24 Videos
- STATES OF MATTER : GASES AND LIQUIDSBOOK - DINESH PUBLICATIONCHAPTER - STATES OF MATTER : GASES AND LIQUIDSEXERCISE - Practice
40 Videos
- STATES OF MATTER (SOLID STATE CHEMISTRY)BOOK - DINESH PUBLICATIONCHAPTER - STATES OF MATTER (SOLID STATE CHEMISTRY)EXERCISE - ULTIMATE PREPARATORY PACKAGE
21 Videos
- STRUCTURE OF ATOMBOOK - DINESH PUBLICATIONCHAPTER - STRUCTURE OF ATOMEXERCISE - Reason Type Questions
1 Videos
Similar Questions
Knowledge Check
Given curve represents
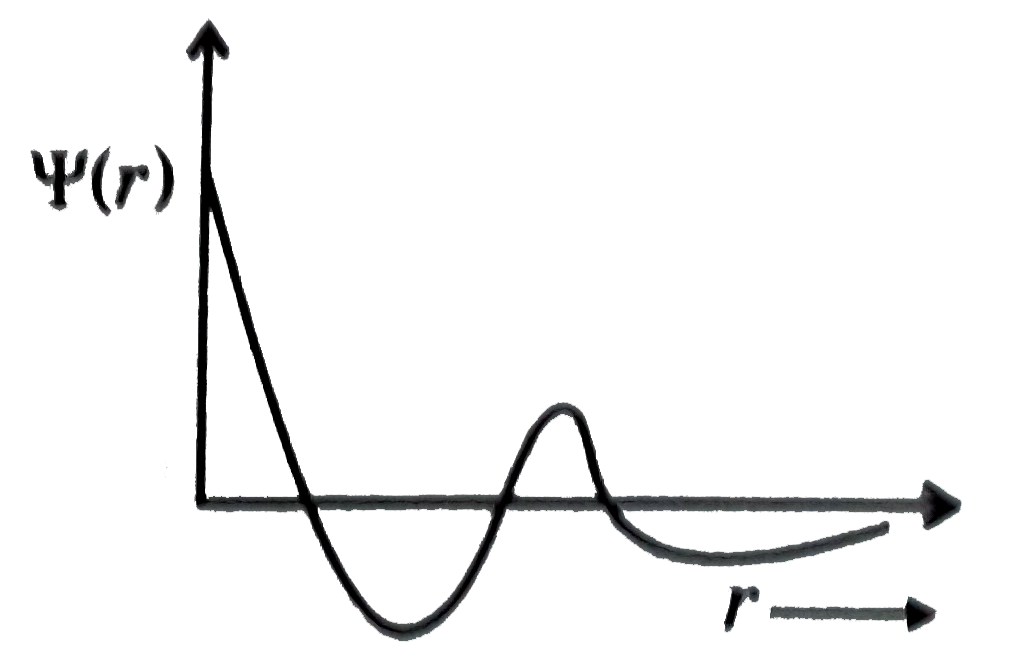 A3s orbitalB4s orbitalC2s orbitalD2s orbital
Which curve in the following graph represents the curve of ideal gas ?
 AB onlyBC and D onlyCE and F onlyDA and B only
Which of the following curves represents the chemical adsorption ?
A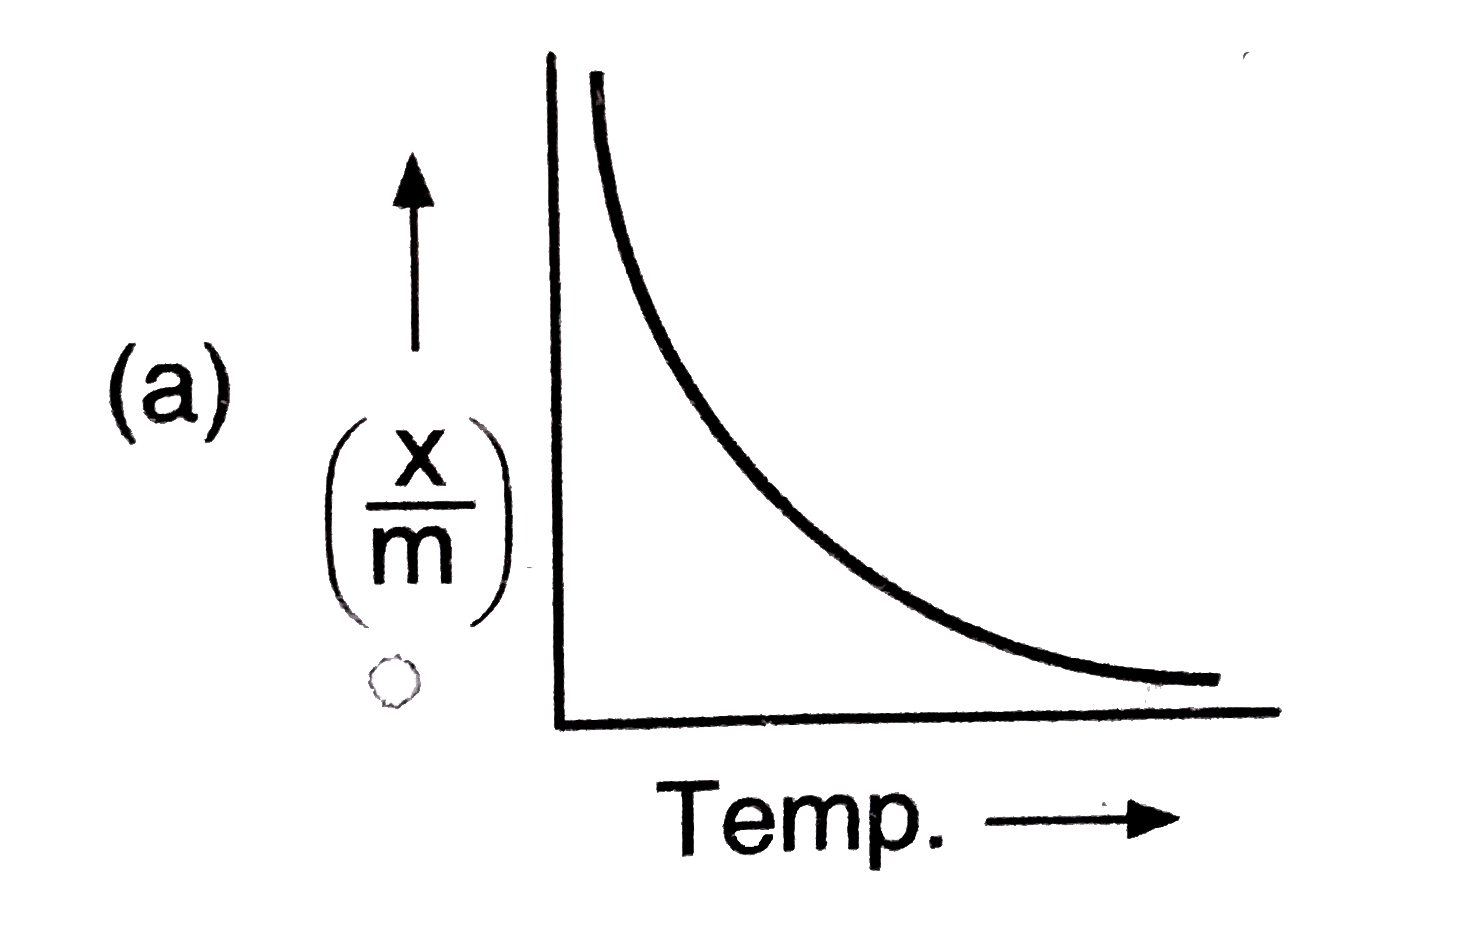 B
B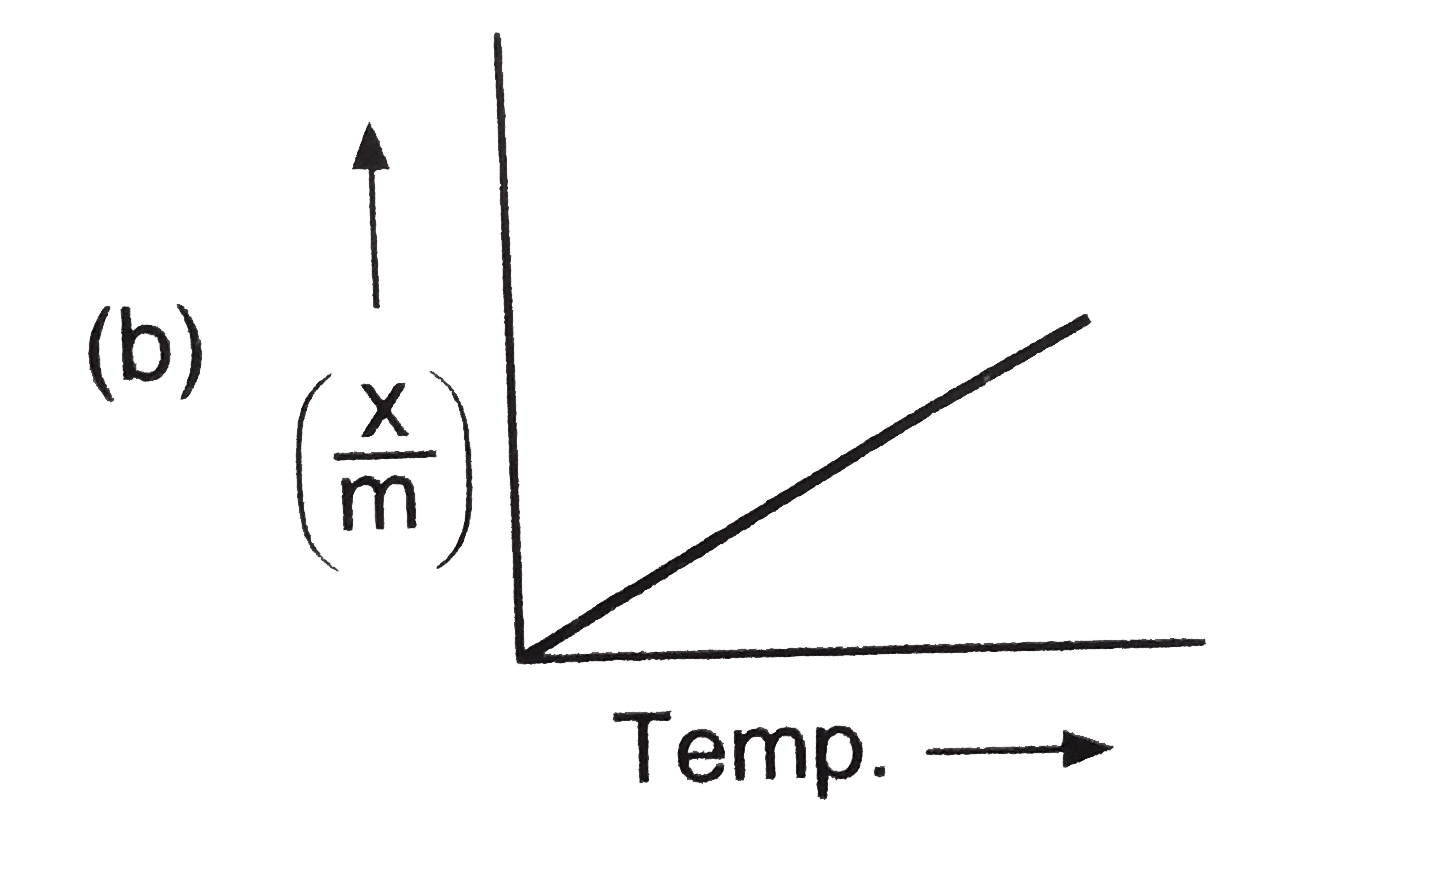 C
C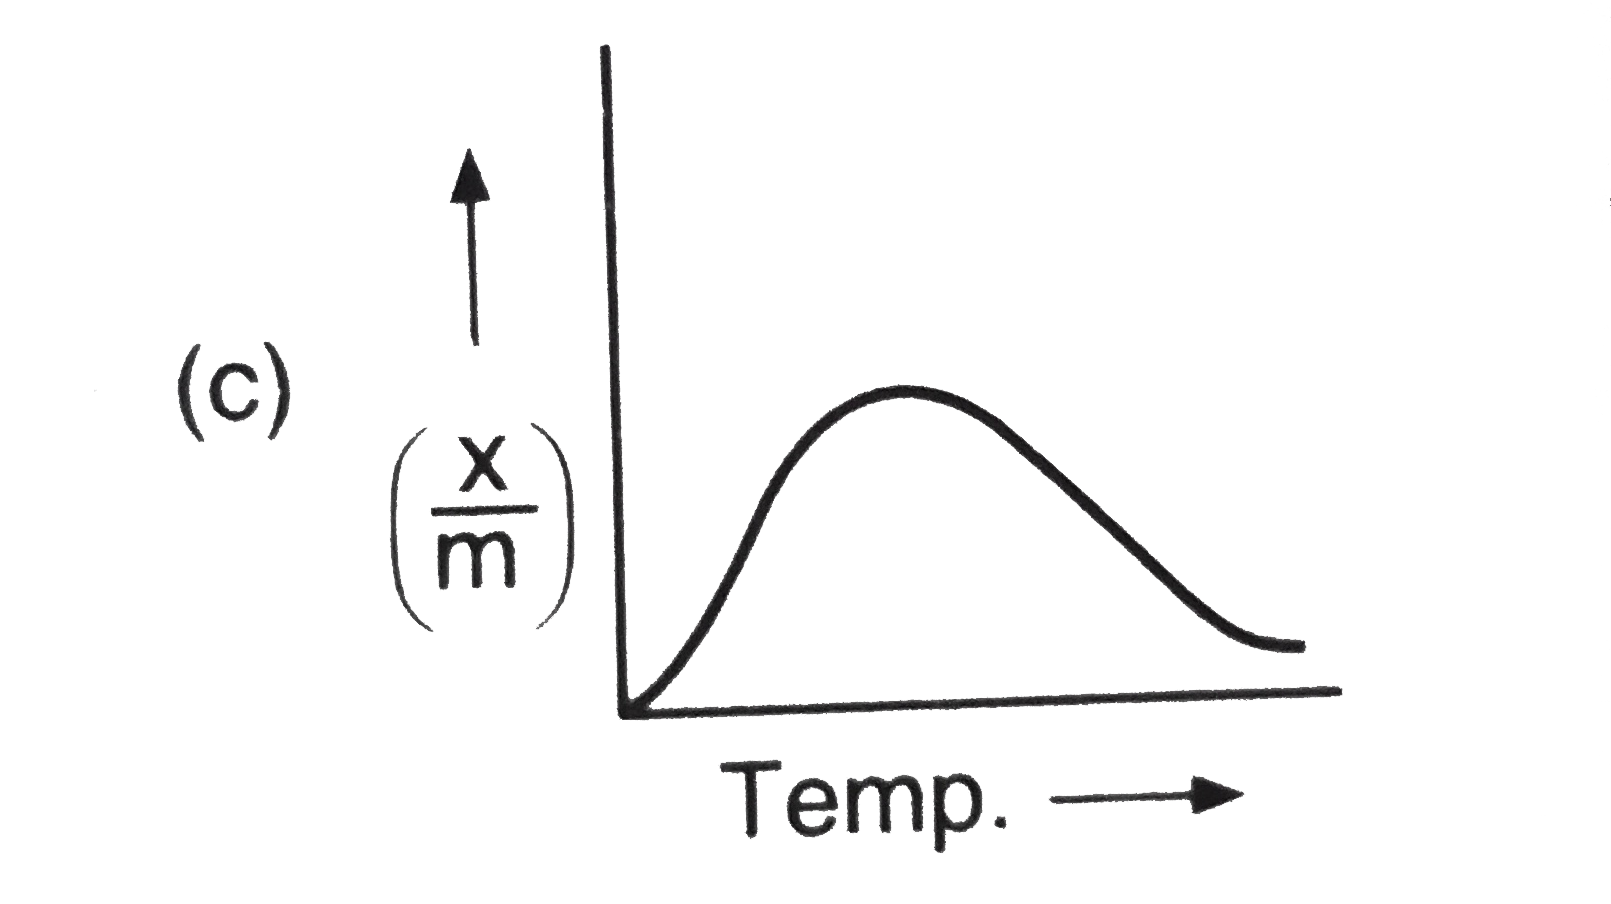 D
D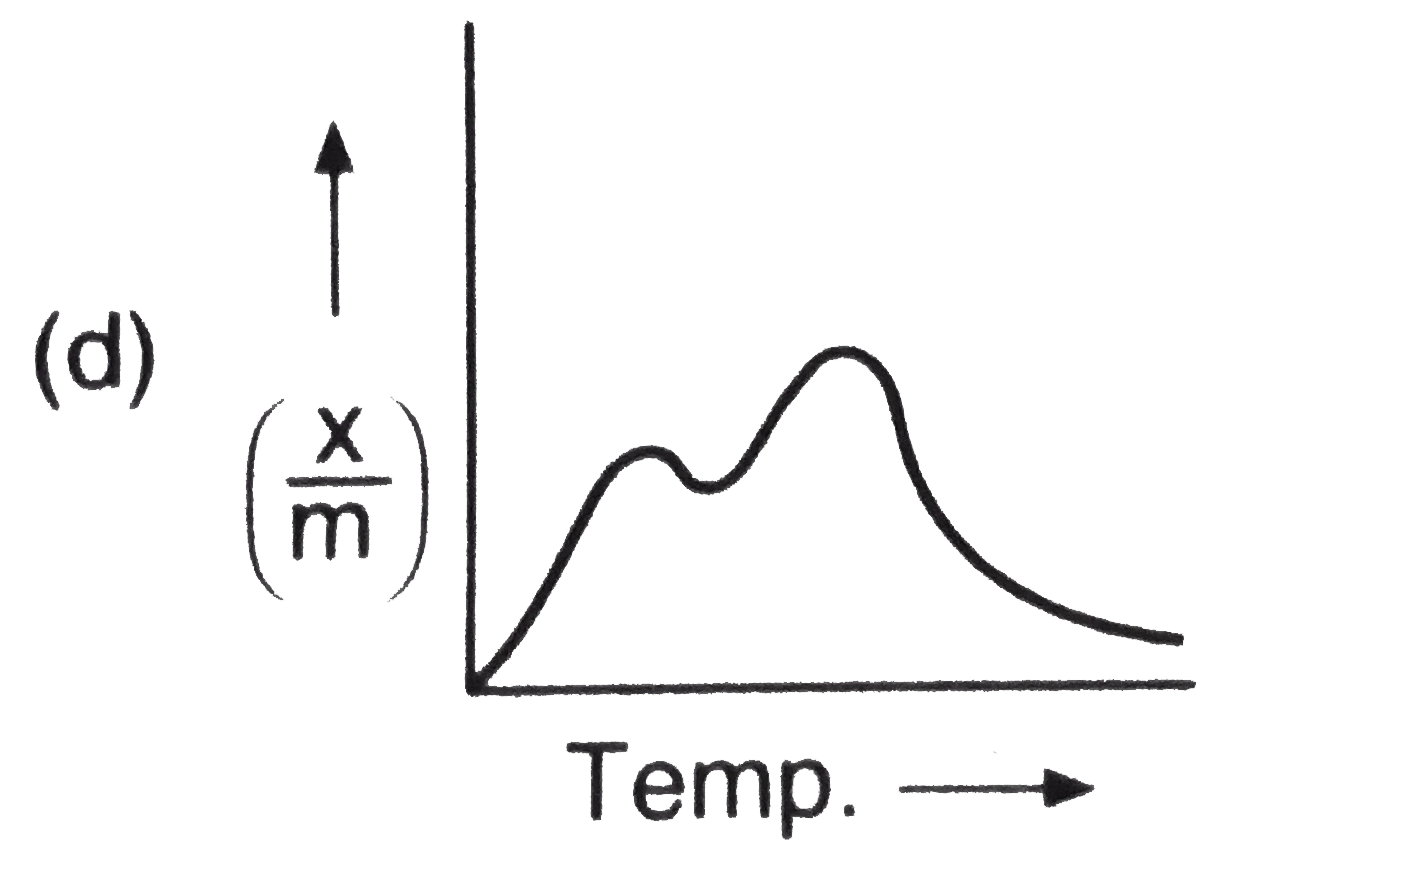
Which of the following graphs represent the behaviour of an ideal gas ?
View Solution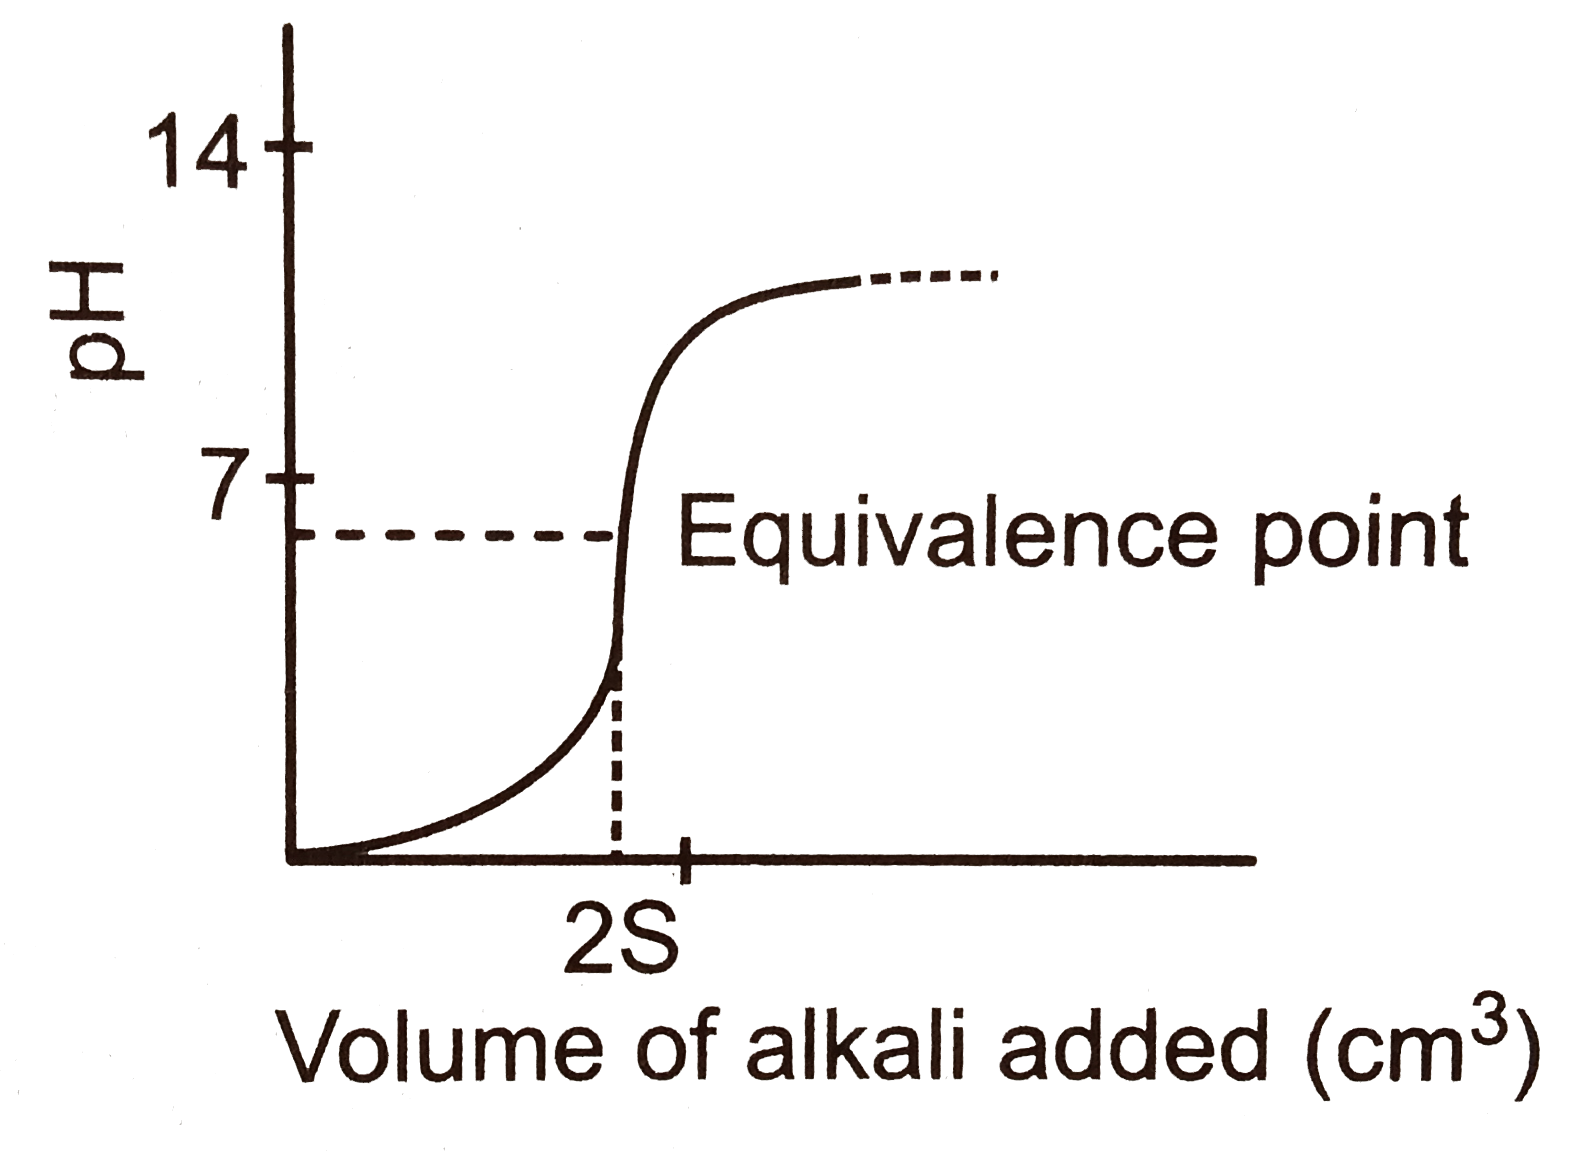
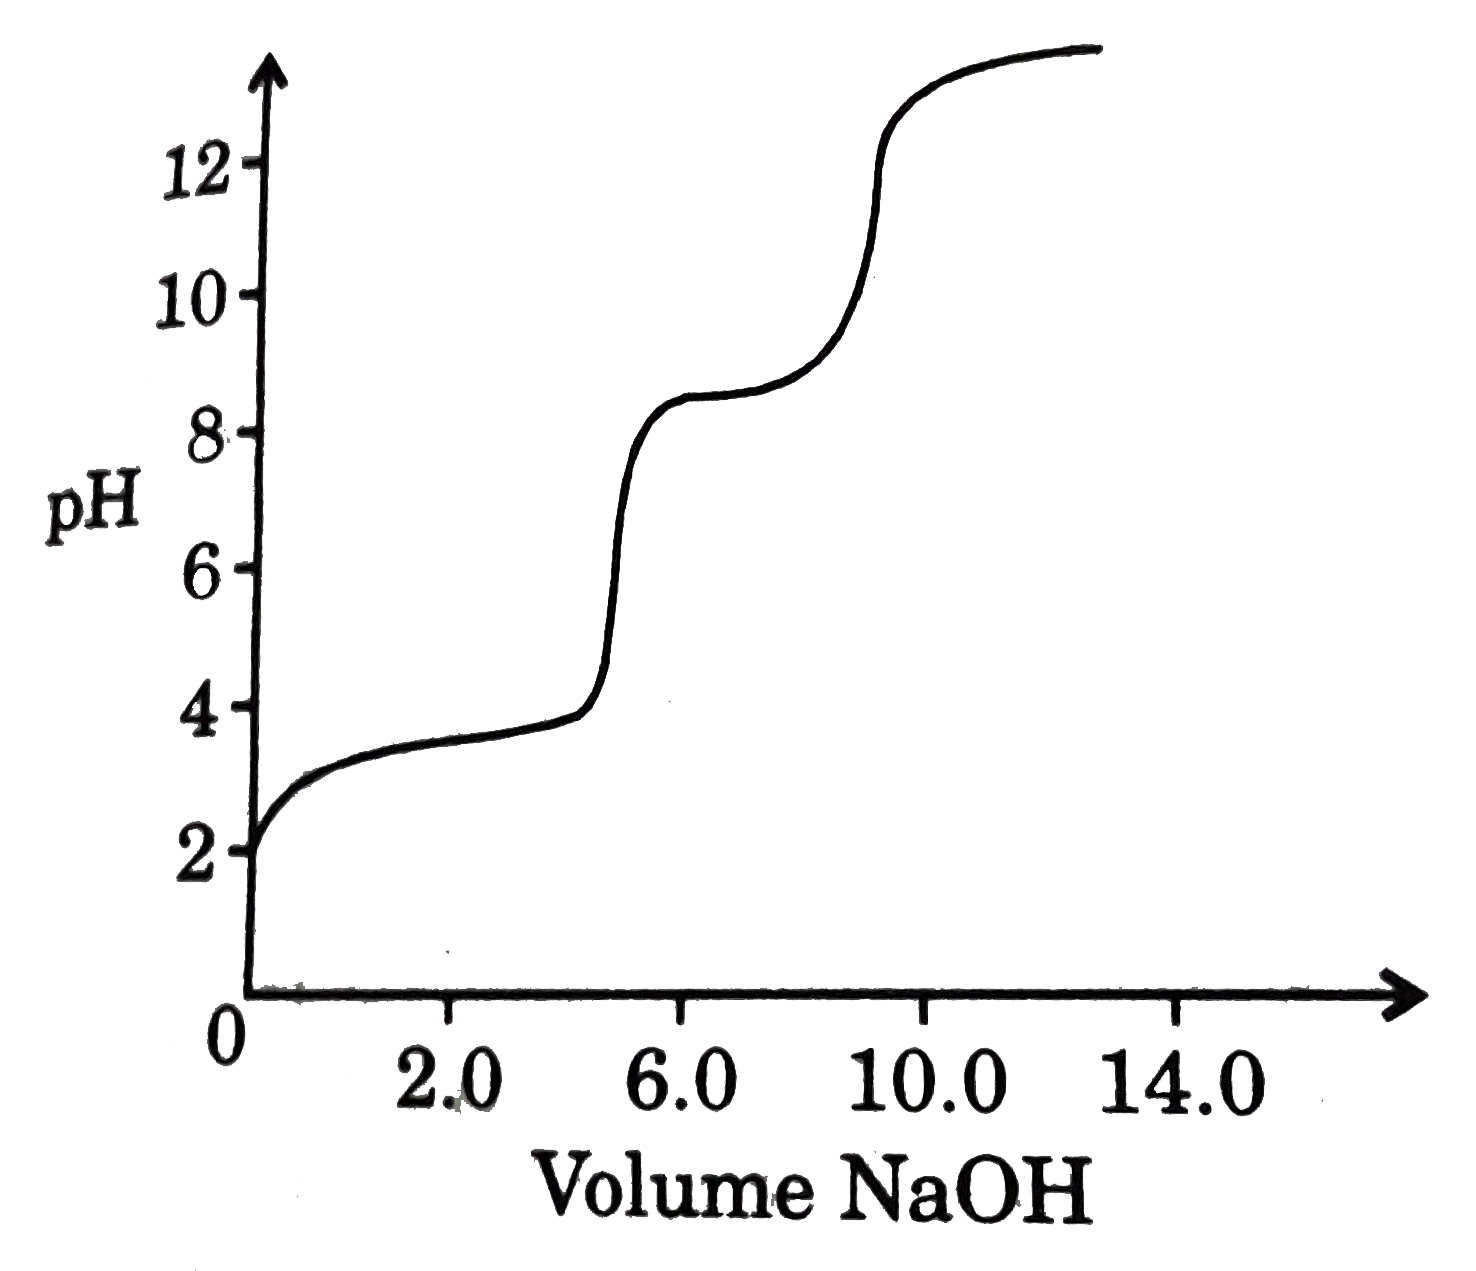
The graph represents the titration curve for :
View SolutionWhich curve does not represent Boyle’s law
View SolutionWhich of the following curves represents the Henry's law ?
View SolutionThe following diagram represents the demand curve of:
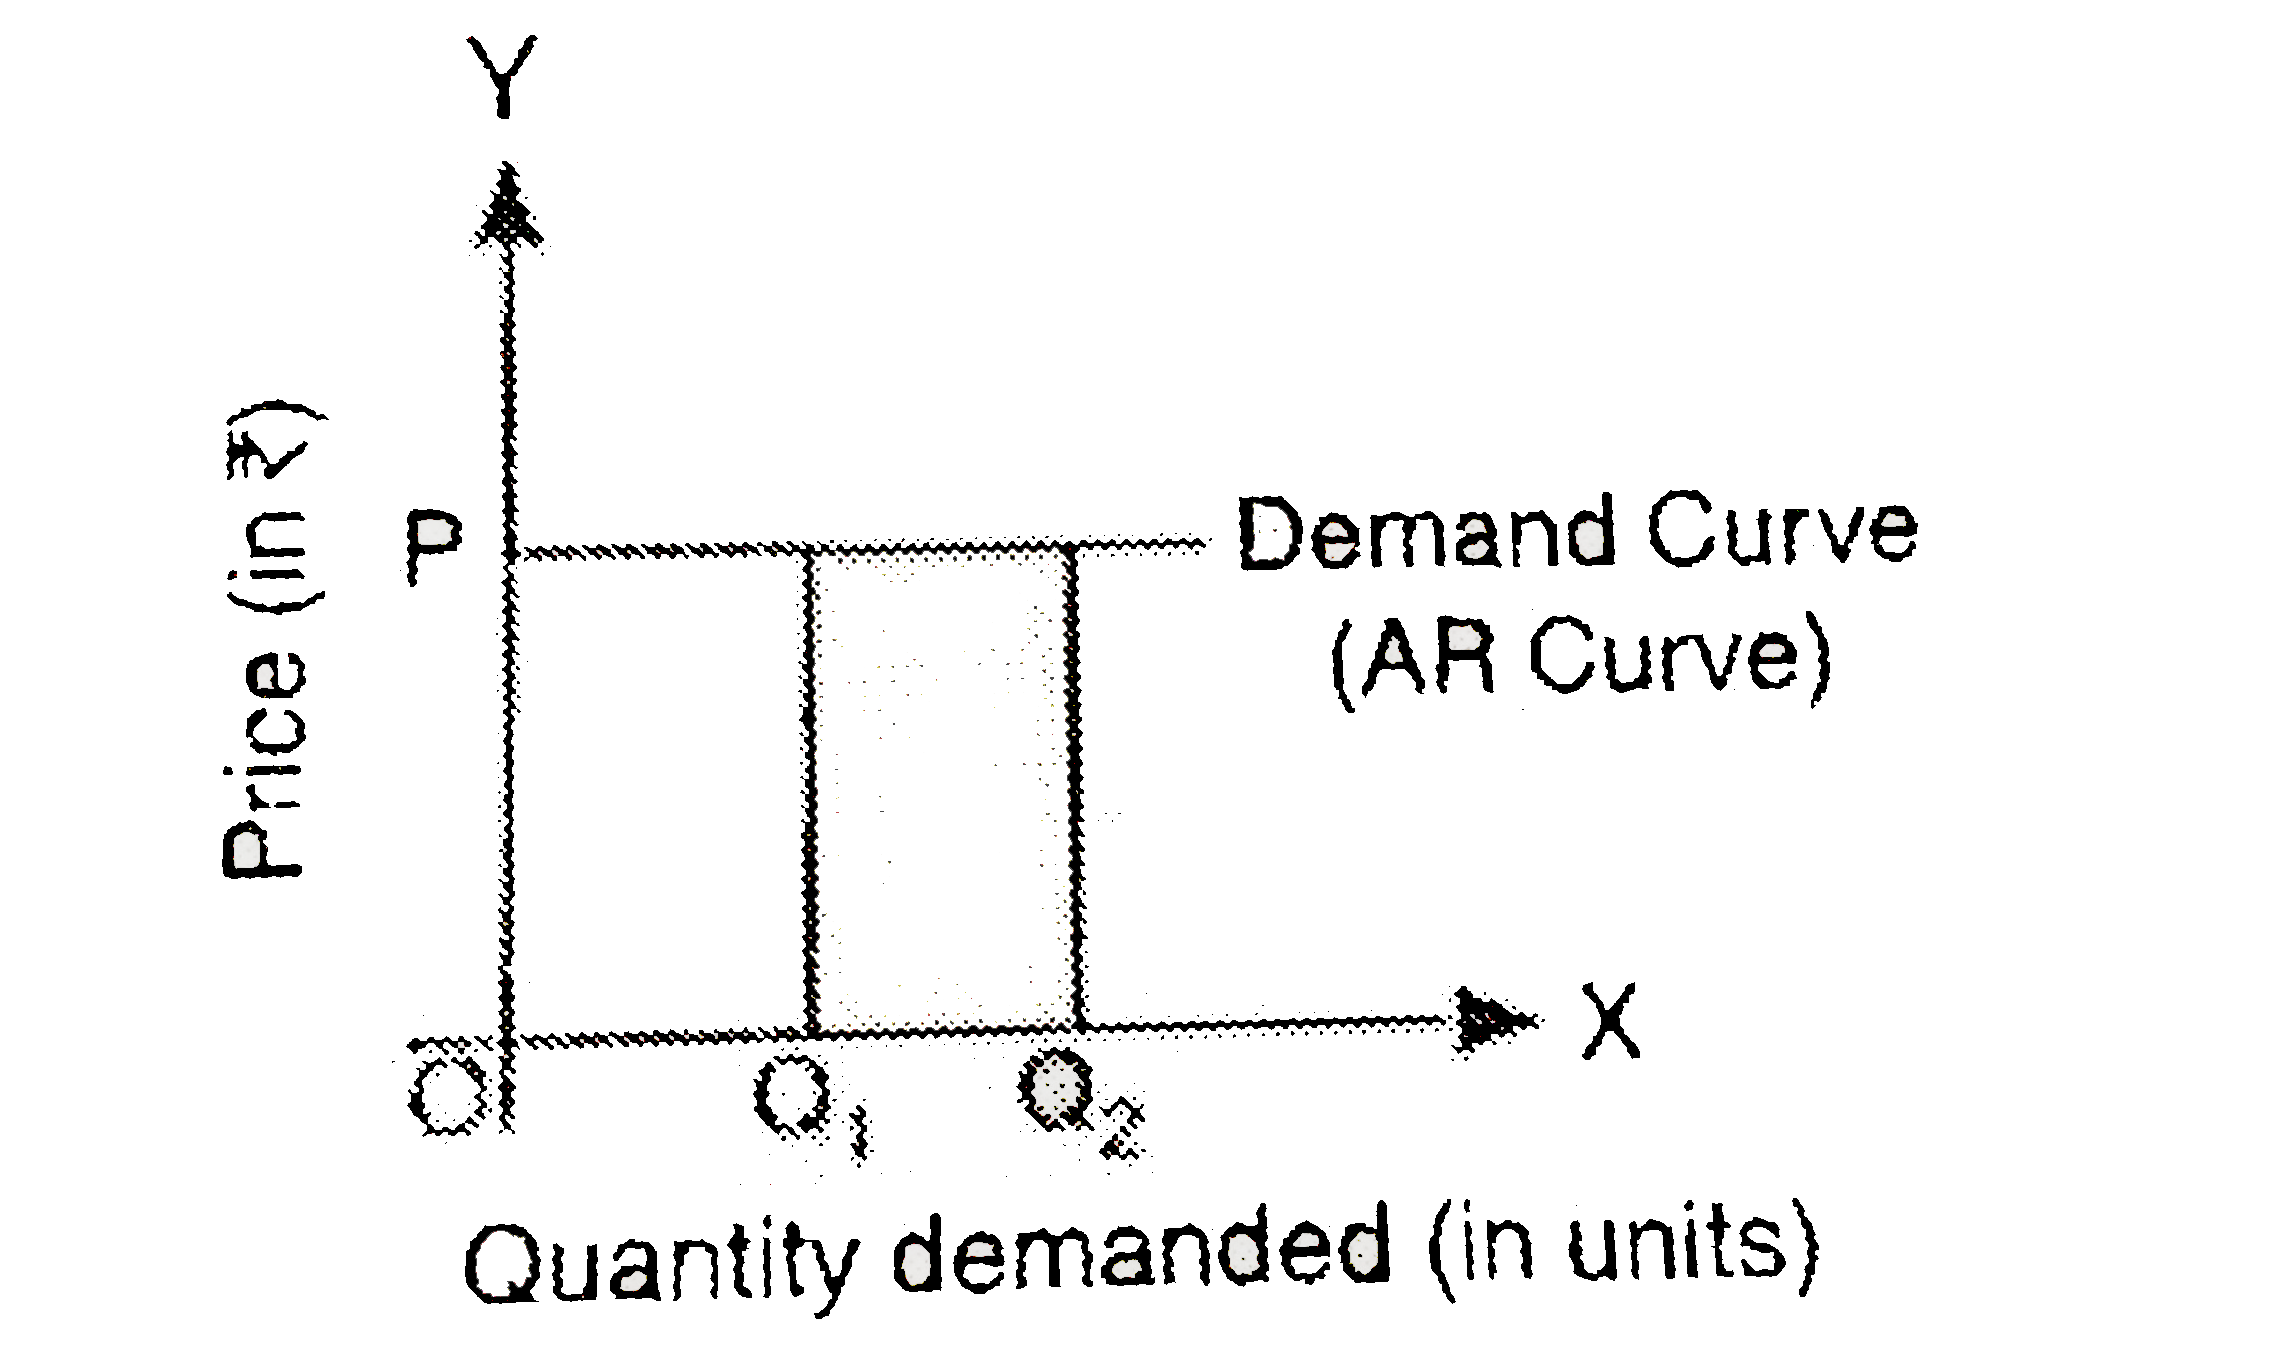
View Solution

