The curve represents the titration of :
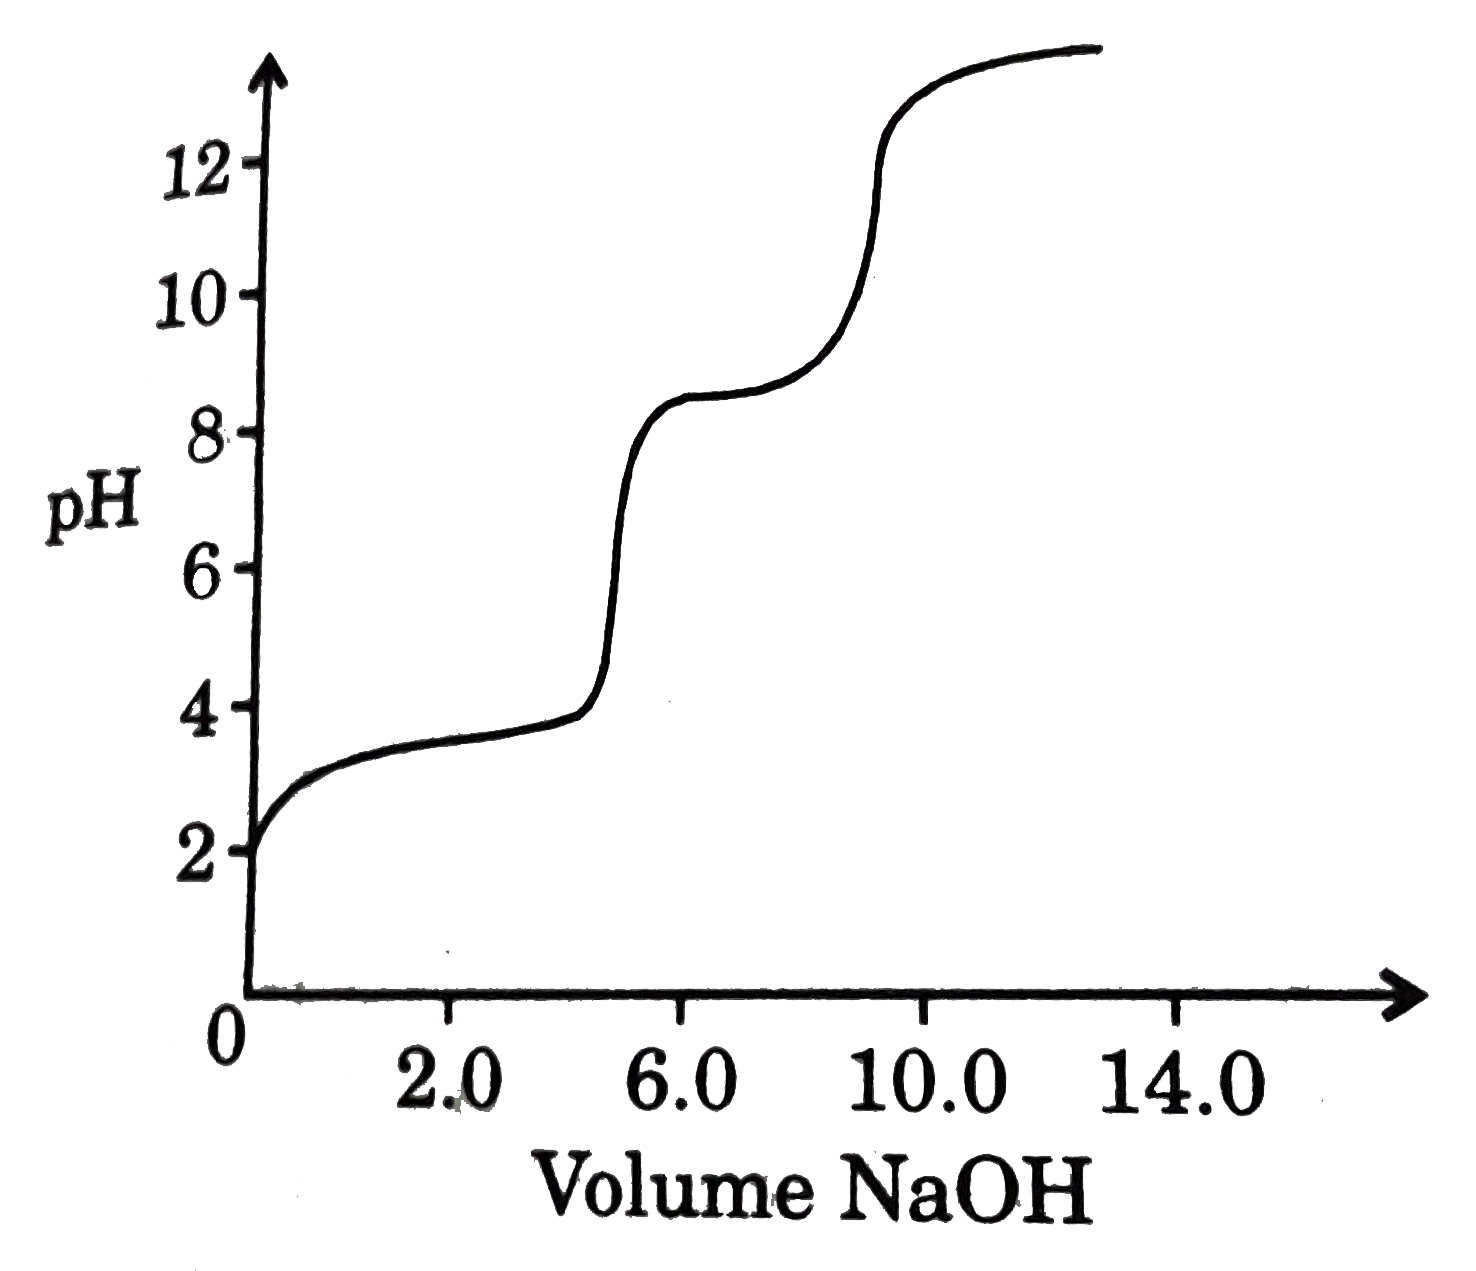
a diprotic acid
two monoprotic acids with the same Kas but different concentrations.
two monoprotic acid with different Kas but the same concentrations
two monoprotic acids with different Kas and different concentrations.
The correct Answer is:D
Topper's Solved these Questions
- GRAPHICAL INTERPRETATIONBOOK - GRB PUBLICATIONCHAPTER - GRAPHICAL INTERPRETATIONEXERCISE - G. Chemical Equilibrium
1 Videos
- GRAPHICAL INTERPRETATIONBOOK - GRB PUBLICATIONCHAPTER - GRAPHICAL INTERPRETATIONEXERCISE - Chemical Equilibrium
36 Videos
- GRAPHICAL INTERPRETATIONBOOK - GRB PUBLICATIONCHAPTER - GRAPHICAL INTERPRETATIONEXERCISE - F. Ionic Equilibrium
1 Videos
- F-BLOCK ELEMENTSBOOK - GRB PUBLICATIONCHAPTER - F-BLOCK ELEMENTSEXERCISE - Subjective type
7 Videos
- HYDROCARBON (ALIPHATIC)BOOK - GRB PUBLICATIONCHAPTER - HYDROCARBON (ALIPHATIC)EXERCISE - Previous years jee questions
28 Videos
Similar Questions
Knowledge Check
Which of the following pH curve represent the titration of weak acid and strong base (dotted line show equivalence point)?
A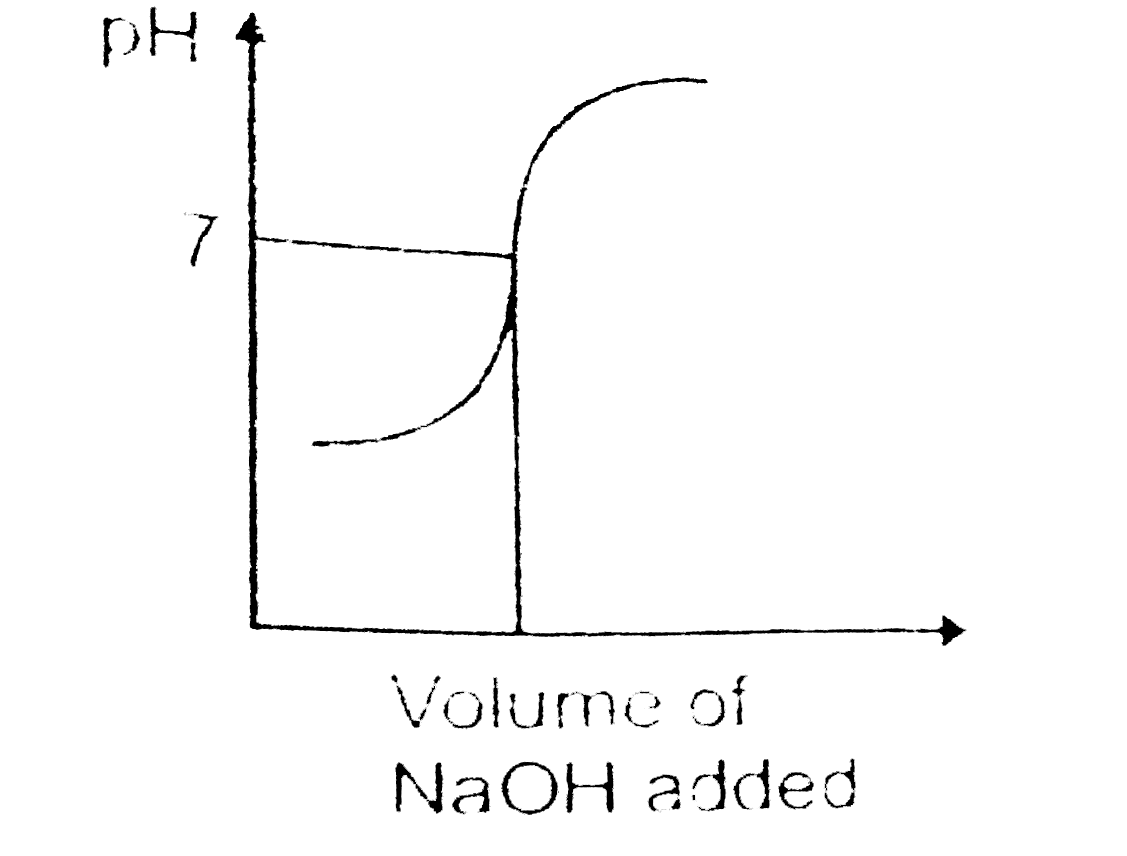 B
B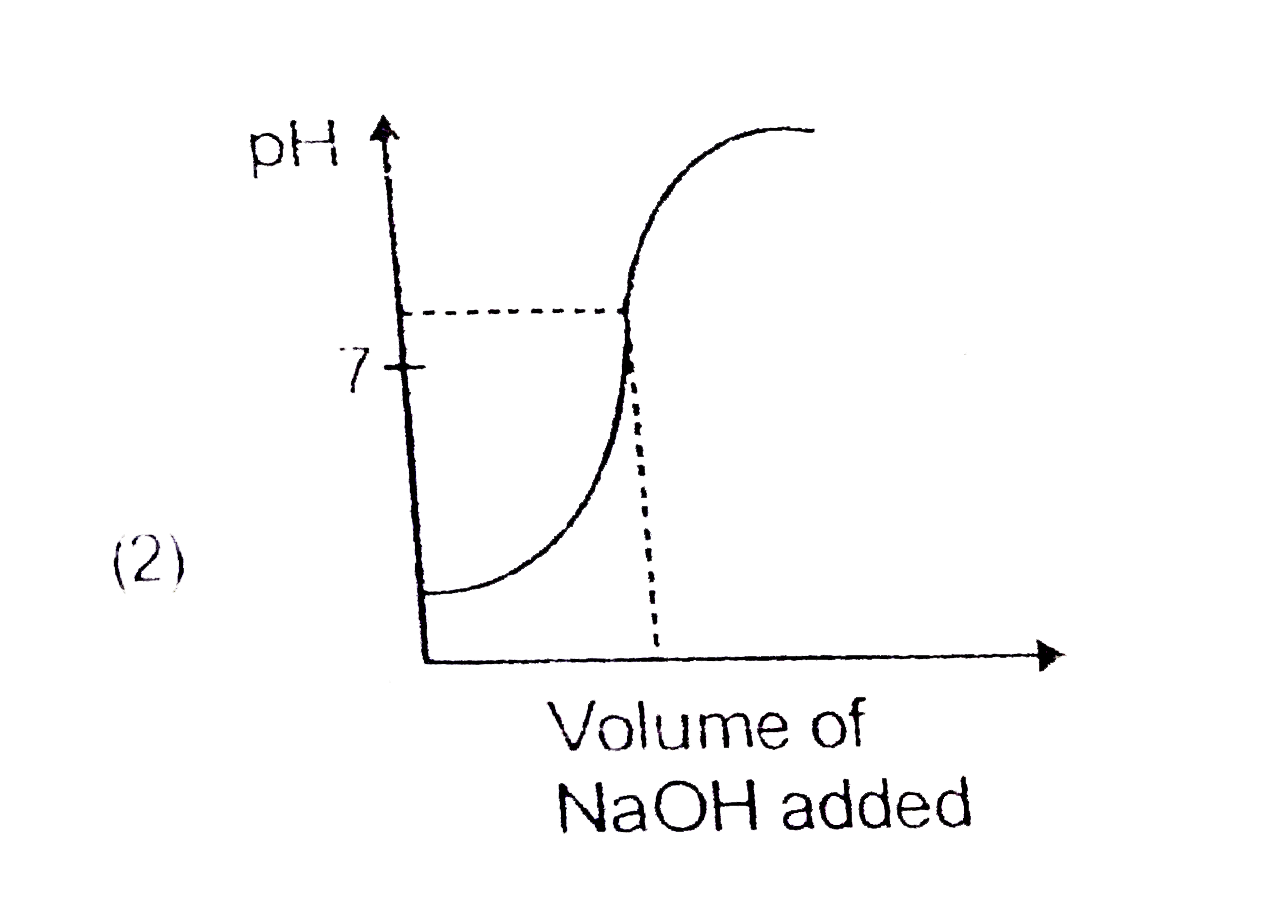 C
C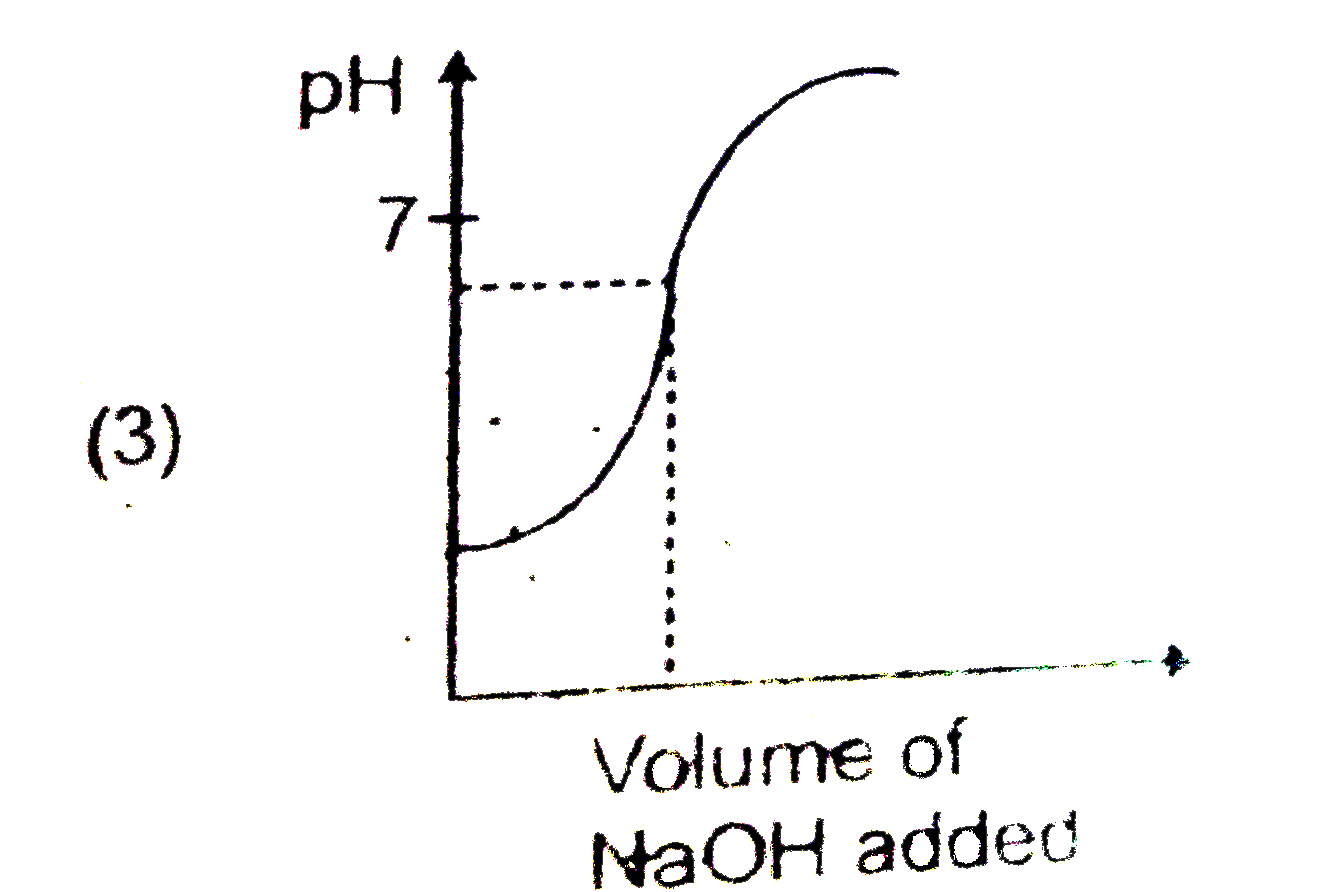 D
D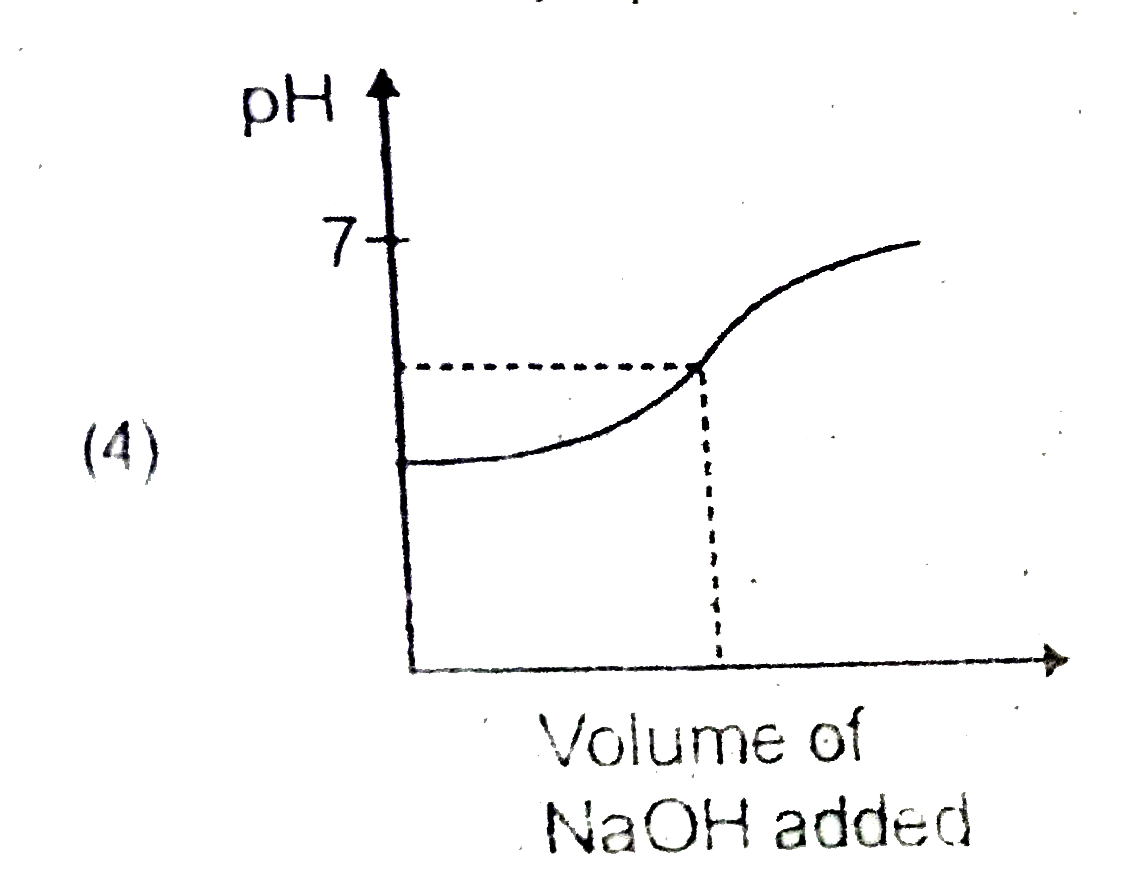
Given curve represents
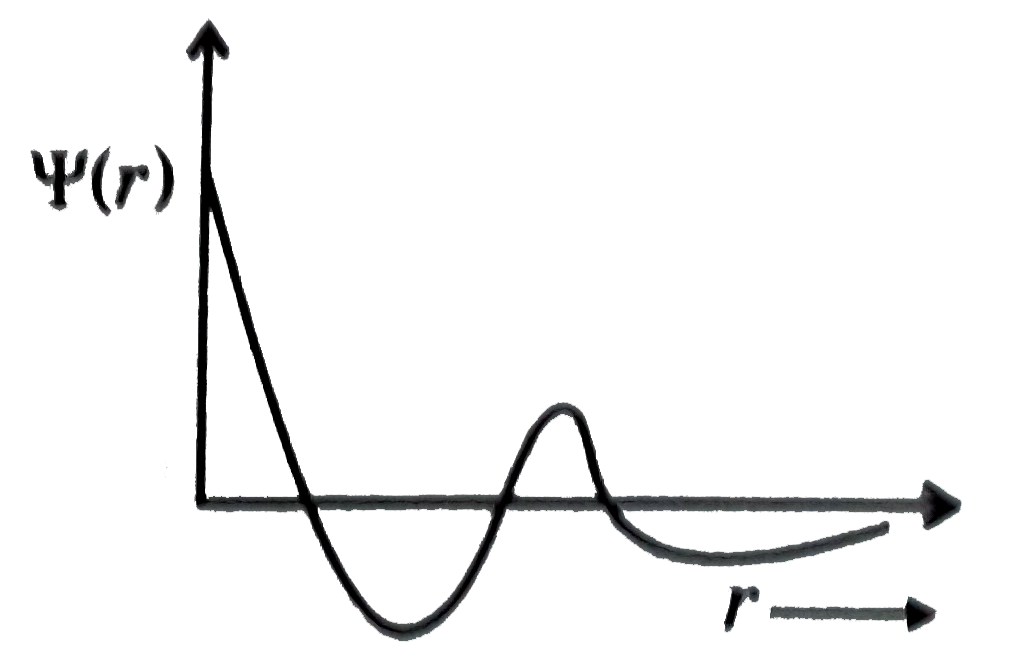 A3s orbitalB4s orbitalC2s orbitalD2s orbital
The following graph represents the titration of pH vs volume
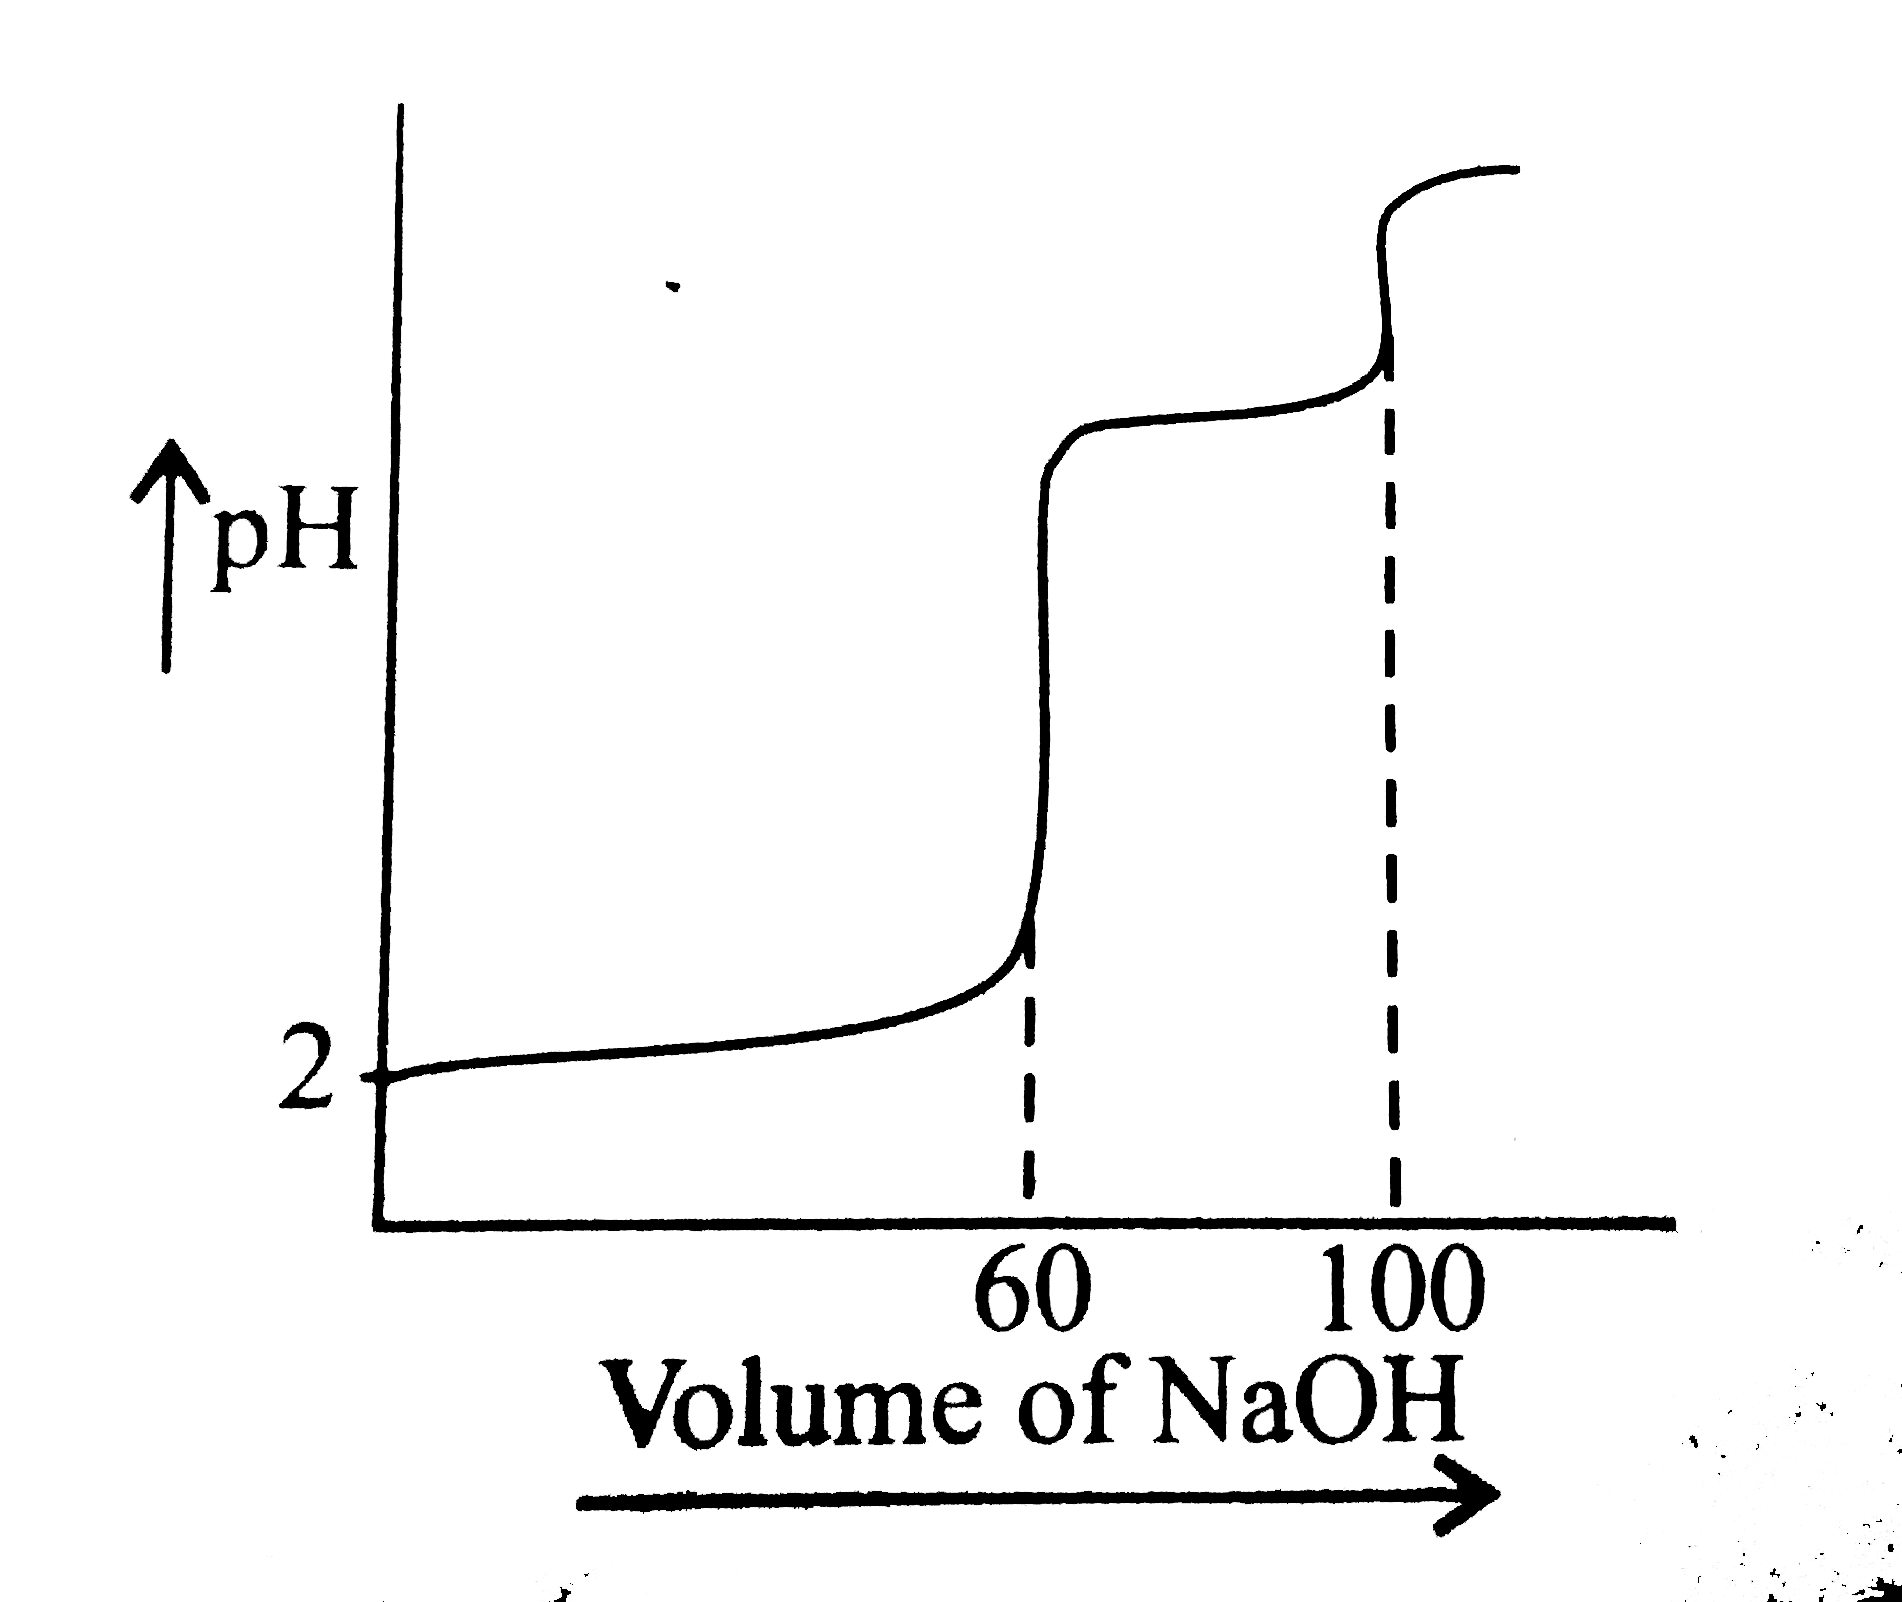 AA diprotic acid.BTwo monoprotic acids with the same Ka but different concentrations.CTwo monoprotic acids with different Ka but the same concentration.DTwo monoprotic acids with differnet Ka and different concentartions.
The following curves represents the equations of

View Solution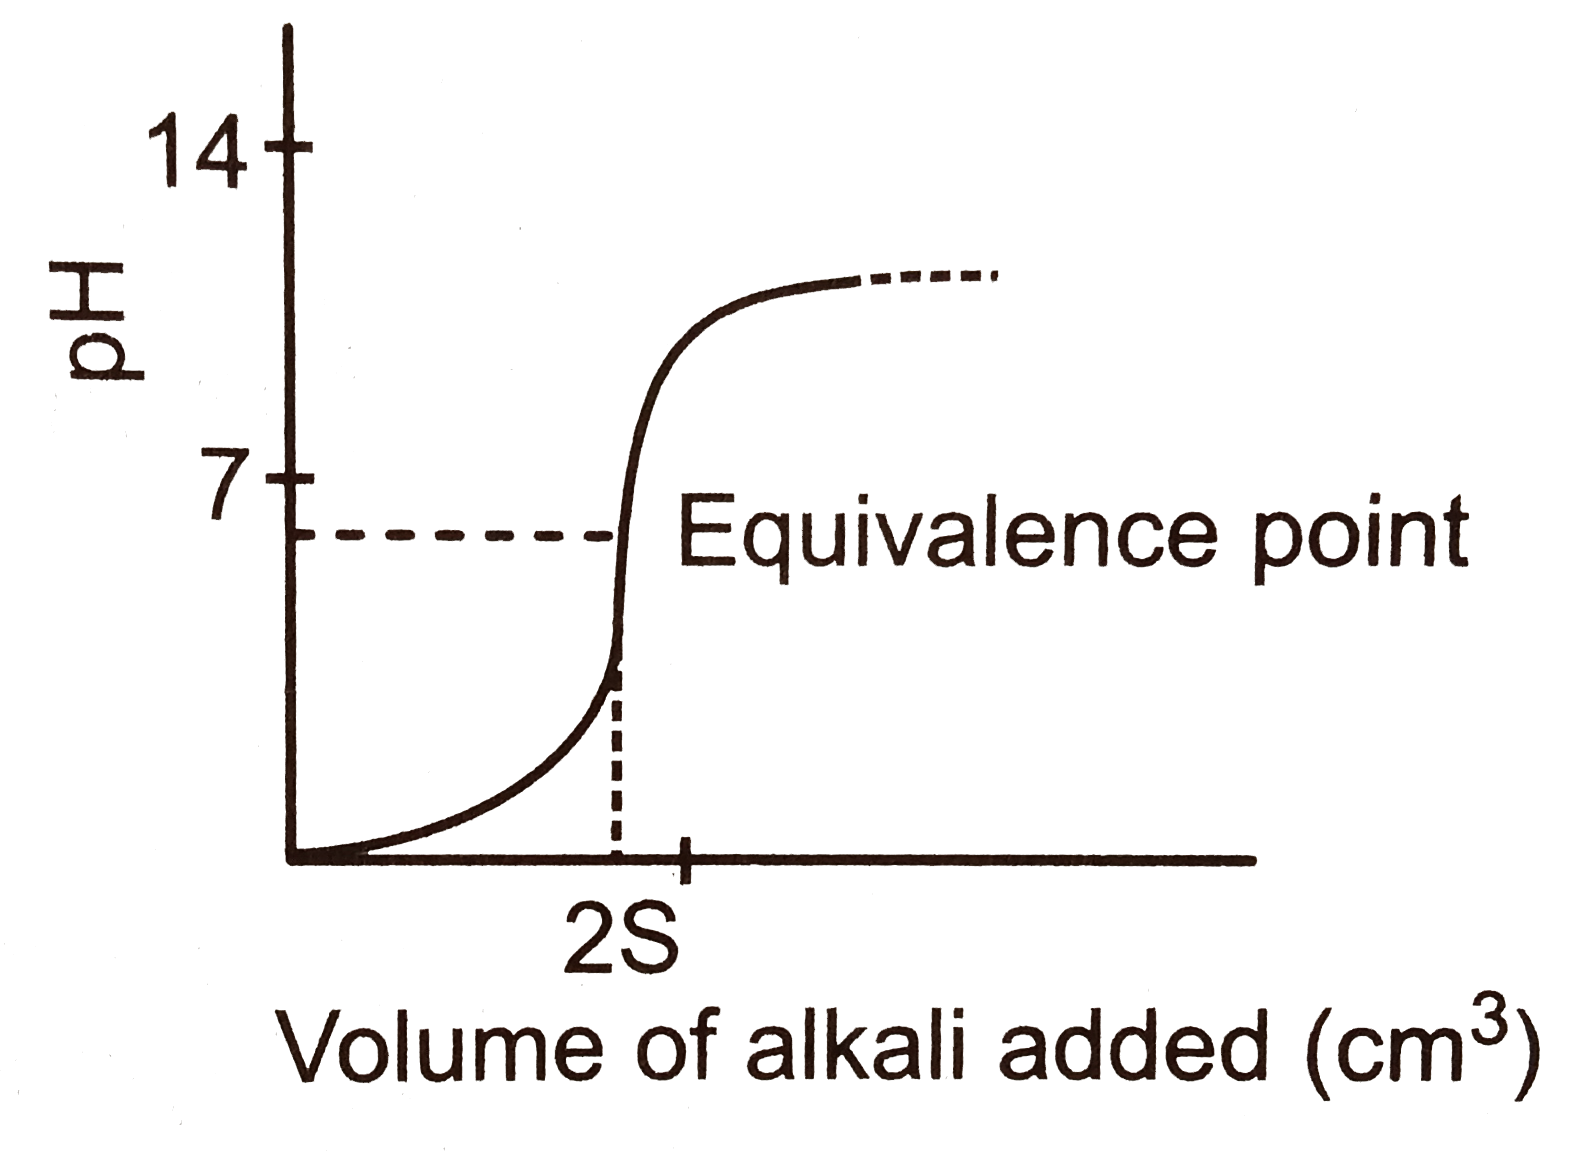
The graph represents the titration curve for :
a.Strong acid and strong base
b.Strong acid and weak base
c.Weak acid and strong base
d.Weak acid and weak base
View SolutionWhich of the following curve will represent the variation of conductance C during titration of CH3COOH by gradual addition of NaOH solution (V)
View Solution
The graph represents the titration curve for :
View SolutionWhich of the following curve will represent the variation of conductance C during titration of CH3COOH by gradual addition of NaOH solution (V)
View Solution
