Which of the following curves represents a zero order reaction ? [(a−x) =reactant concn.]
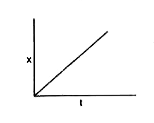
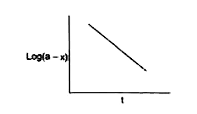
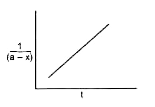
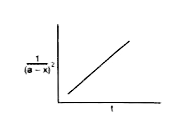
The correct Answer is:A
To determine which curve represents a zero-order reaction, we need to understand the characteristics of zero-order kinetics and how they are represented graphically.
1. Understand Zero-Order Reactions:
- In a zero-order reaction, the rate of reaction is constant and does not depend on the concentration of the reactant. This means that the rate of reaction remains the same regardless of how much reactant is present.
2. Rate Law for Zero-Order Reactions:
- The rate law for a zero-order reaction can be expressed as:
Rate=k
- Here, k is the rate constant.
3. Integrated Rate Equation:
- The integrated rate equation for a zero-order reaction is given by:
(A)=(A0)−kt
- Where:
- (A) is the concentration of the reactant at time t,
- (A0) is the initial concentration of the reactant,
- k is the rate constant,
- t is the time.
4. Graphical Representation:
- When we plot the concentration of the reactant (A) (or A−x, where x is the amount of reactant that has reacted) against time t, we get a straight line.
- The slope of this line is negative and equal to −k.
- The y-intercept of this graph is the initial concentration (A0).
5. Identifying the Correct Curve:
- To identify which curve represents a zero-order reaction, look for a straight line with a negative slope when plotting (A) (or A−x) on the y-axis and time t on the x-axis.
- If the graph is linear and decreases over time, it indicates a zero-order reaction.
Conclusion:
Based on the characteristics and graphical representation of zero-order reactions, the correct curve will be the one that shows a straight line with a negative slope when plotting the concentration of the reactant against time.
- In a zero-order reaction, the rate of reaction is constant and does not depend on the concentration of the reactant. This means that the rate of reaction remains the same regardless of how much reactant is present.
- The rate law for a zero-order reaction can be expressed as:
Rate=k
- Here, k is the rate constant.
- The integrated rate equation for a zero-order reaction is given by:
(A)=(A0)−kt
- Where:
- (A) is the concentration of the reactant at time t,
- (A0) is the initial concentration of the reactant,
- k is the rate constant,
- t is the time.
- When we plot the concentration of the reactant (A) (or A−x, where x is the amount of reactant that has reacted) against time t, we get a straight line.
- The slope of this line is negative and equal to −k.
- The y-intercept of this graph is the initial concentration (A0).
- To identify which curve represents a zero-order reaction, look for a straight line with a negative slope when plotting (A) (or A−x) on the y-axis and time t on the x-axis.
- If the graph is linear and decreases over time, it indicates a zero-order reaction.
Based on the characteristics and graphical representation of zero-order reactions, the correct curve will be the one that shows a straight line with a negative slope when plotting the concentration of the reactant against time.
Topper's Solved these Questions
- CHEMICAL KINETICSBOOK - RC MUKHERJEECHAPTER - CHEMICAL KINETICSEXERCISE - PROBLEMS
42 Videos
- CHEMICAL EQUIVALENCEBOOK - RC MUKHERJEECHAPTER - CHEMICAL EQUIVALENCEEXERCISE - PROBLEMS
24 Videos
- CHEMICAL THERMODYNAMICSBOOK - RC MUKHERJEECHAPTER - CHEMICAL THERMODYNAMICSEXERCISE - Objective problems
58 Videos
Similar Questions
Knowledge Check
Which of the following curves represent(s) a zero-order reaction?
A B
B C
C D
D
Which of the following curves represents a third order reaction ?
A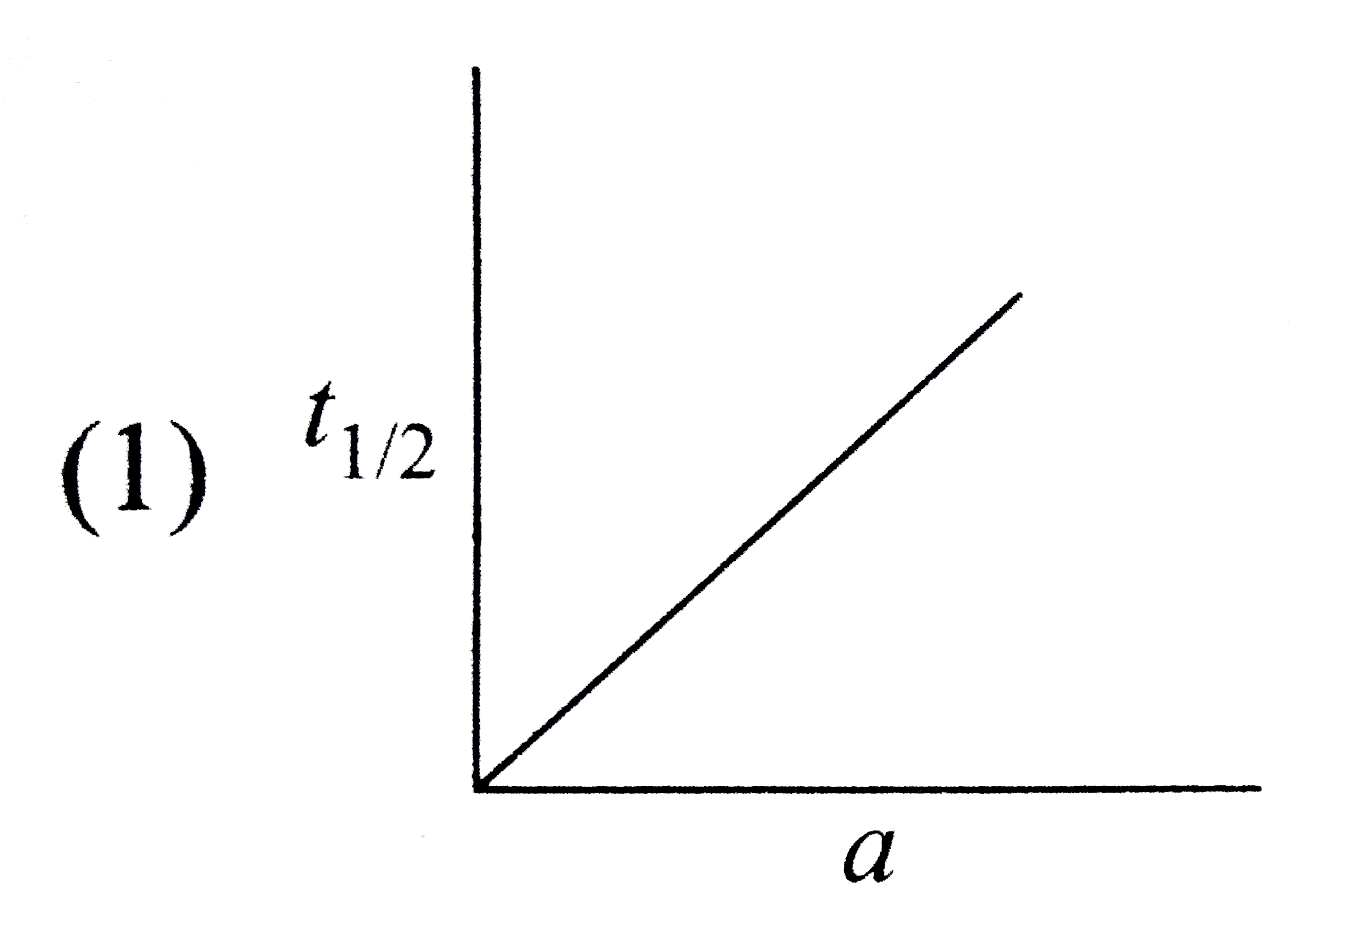 B
B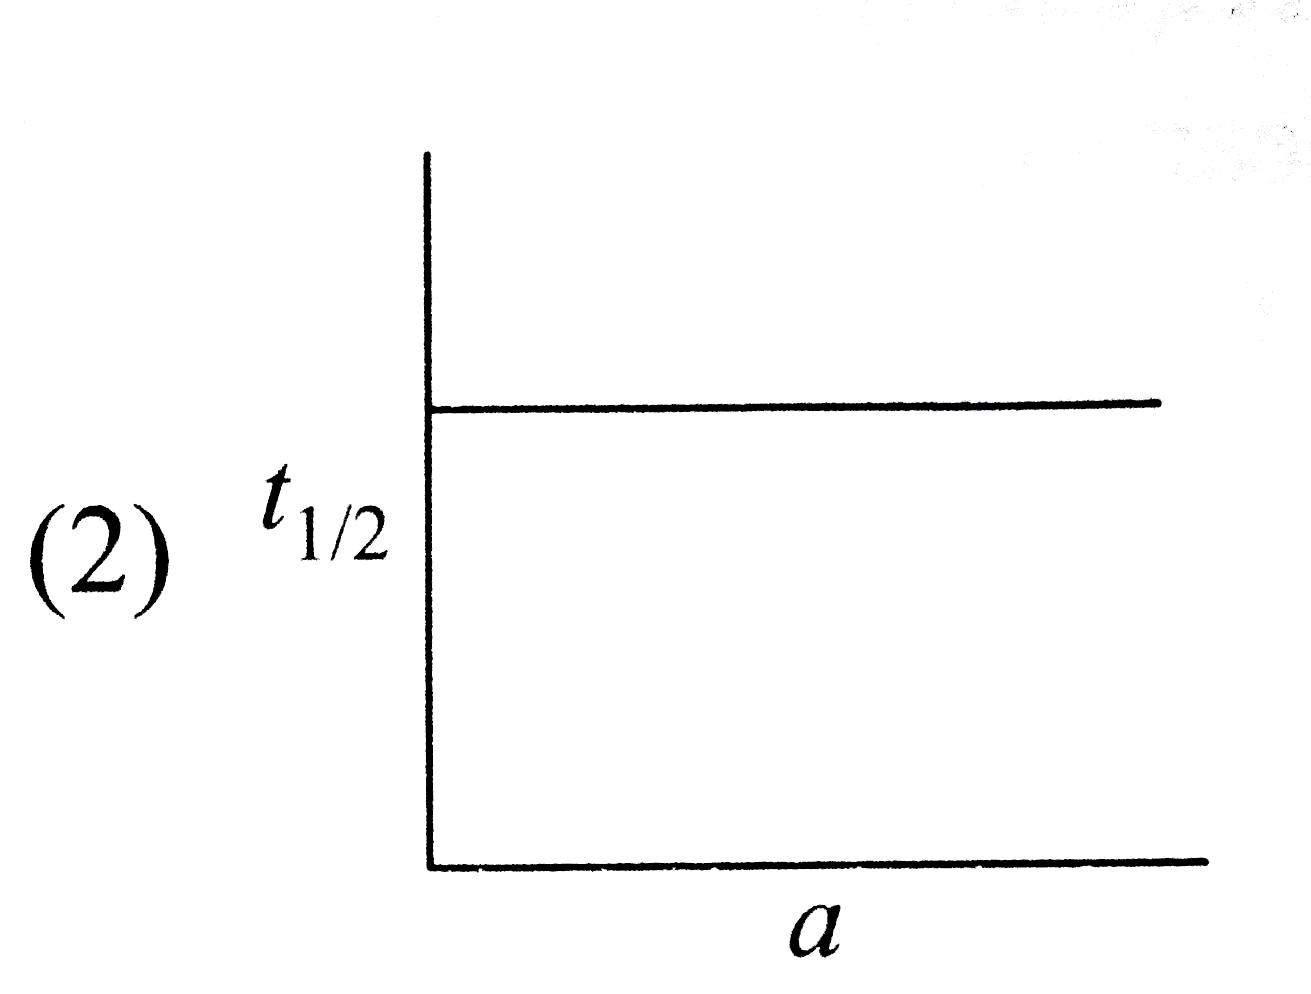 C
C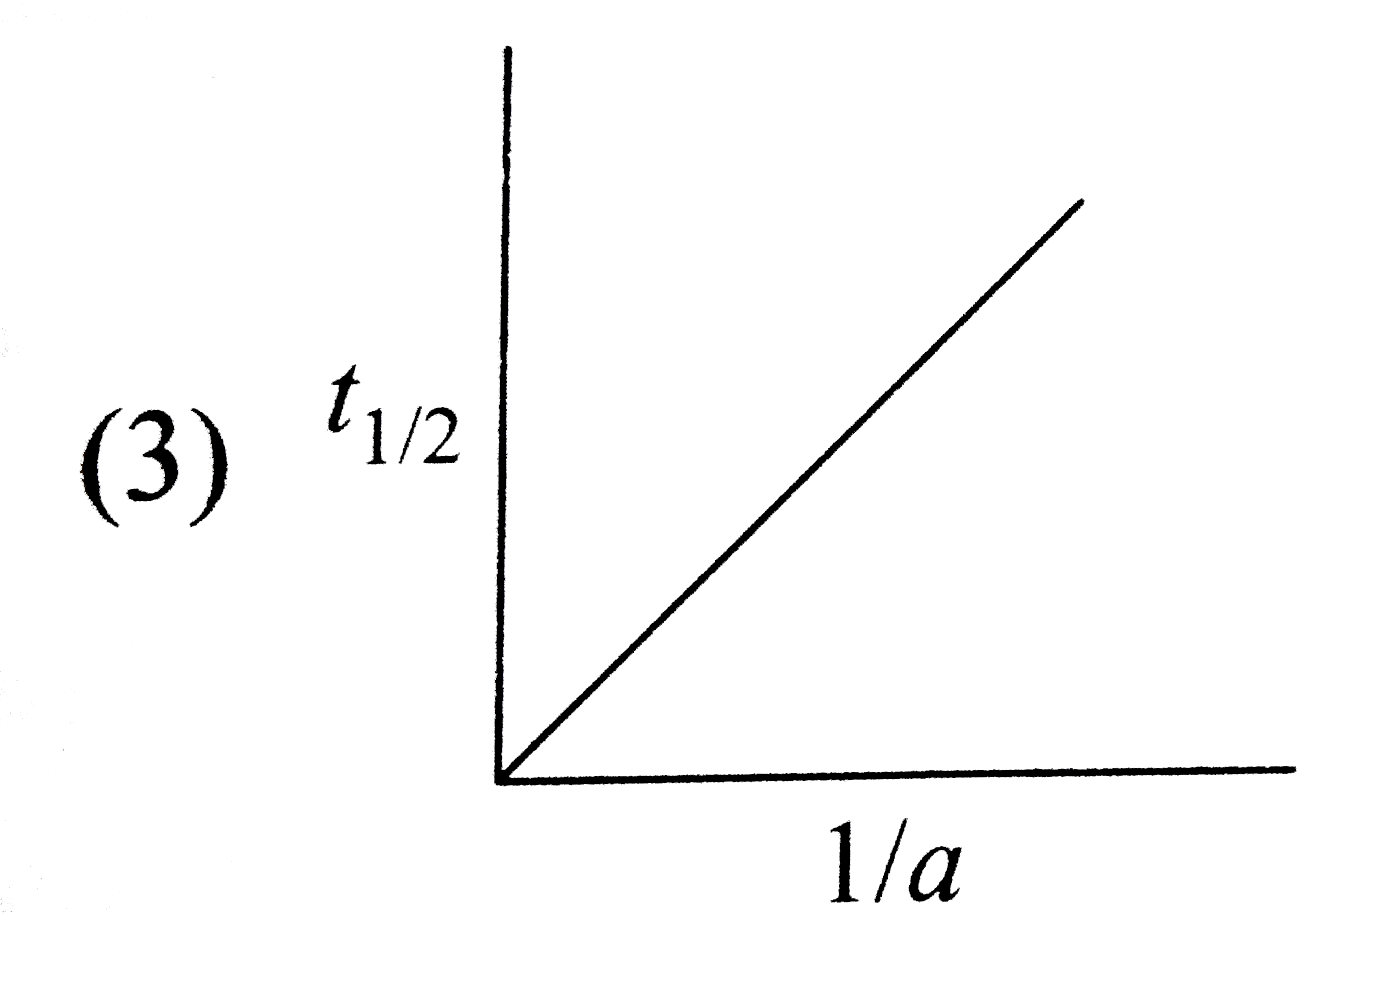 D
D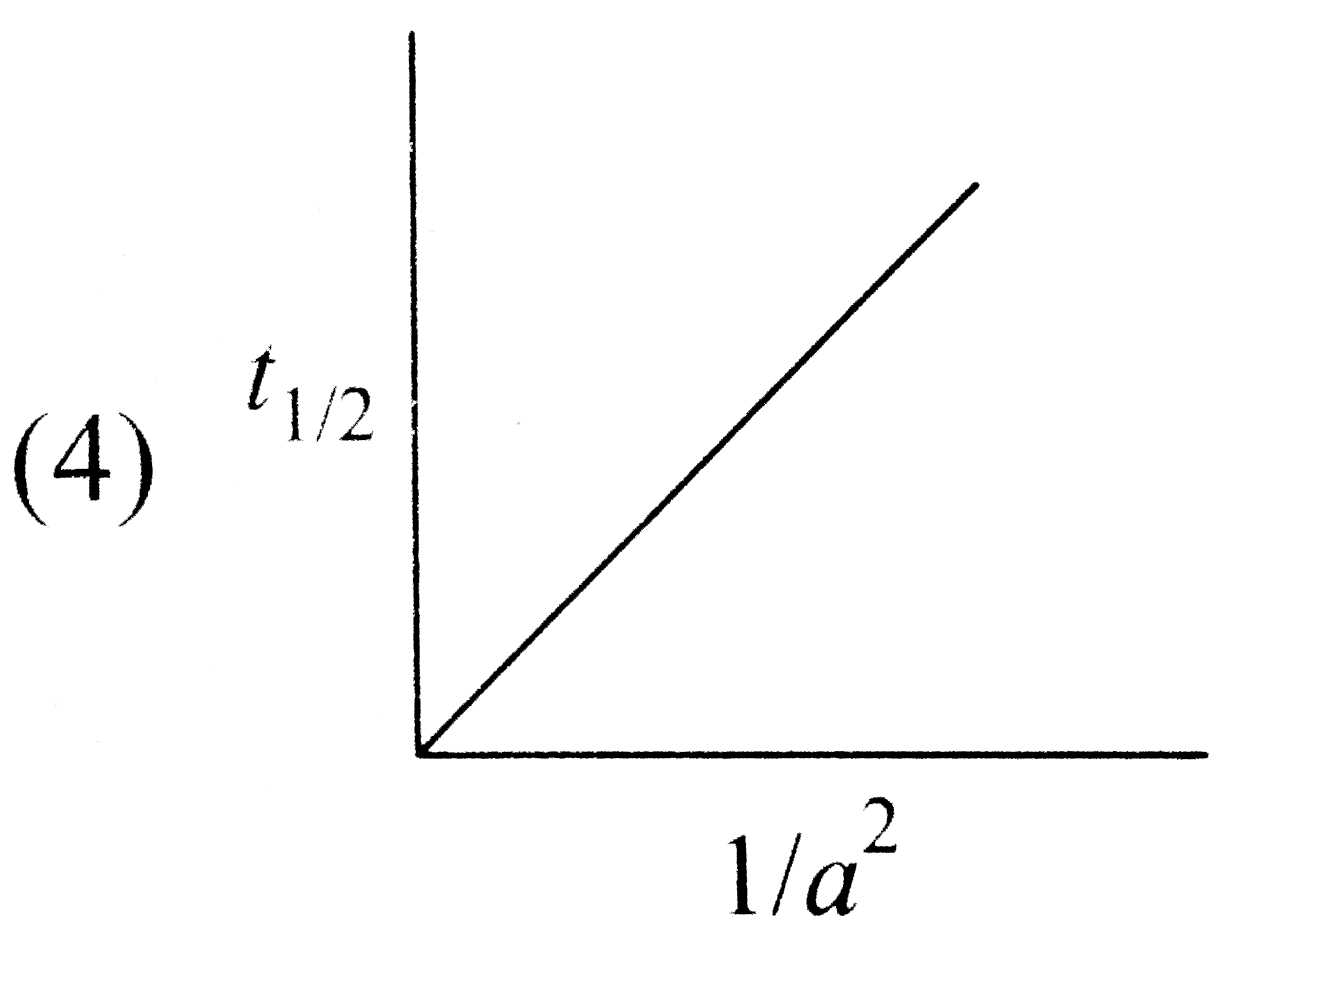
Which of the following curves represents a third order reaction ?
A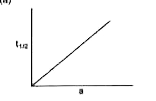 B
B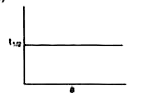 C
C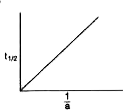 D
D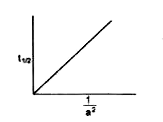
Which of the following represents zero order reaction ?
View SolutionWhich of the following curves represents a second order reaction ? [x = product oncentration (a−x) = reactant concentration)
View SolutionWhich of the following curve represent zero order reaction of A→ products ?
View SolutionWhich of the following curve represent zero order reaction of A→ products ?
View SolutionWhich of the following graph is correct for zero order reaction?
View Solution
