Which of the following curves represents a first order reaction.
All of these
The correct Answer is:D
To determine which of the given curves represents a first-order reaction, we need to analyze the integrated rate law for first-order reactions.
1. Understanding the Rate Law for First-Order Reactions:
The rate of a first-order reaction can be expressed as:
−d(R)dt=k(R)
where (R) is the concentration of the reactant, t is time, and k is the rate constant.
2. Integrated Rate Law:
For a first-order reaction, the integrated rate law is given by:
ln((R0)(R))=kt
where (R0) is the initial concentration of the reactant and (R) is the concentration at time t.
3. Identifying the Graphs:
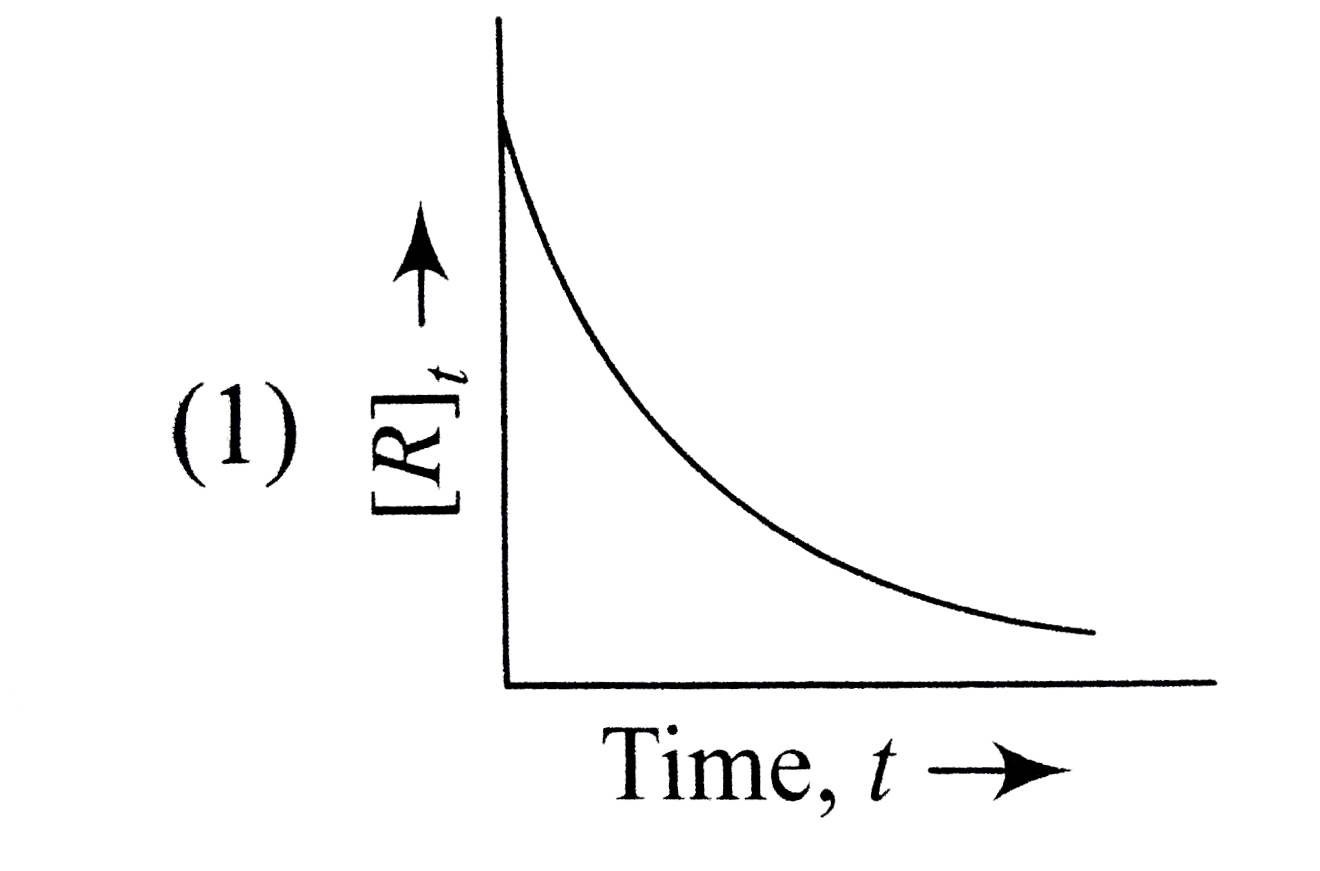
- First Curve: This curve shows the concentration of the reactant (R) versus time t. For a first-order reaction, this curve would typically show an exponential decay.
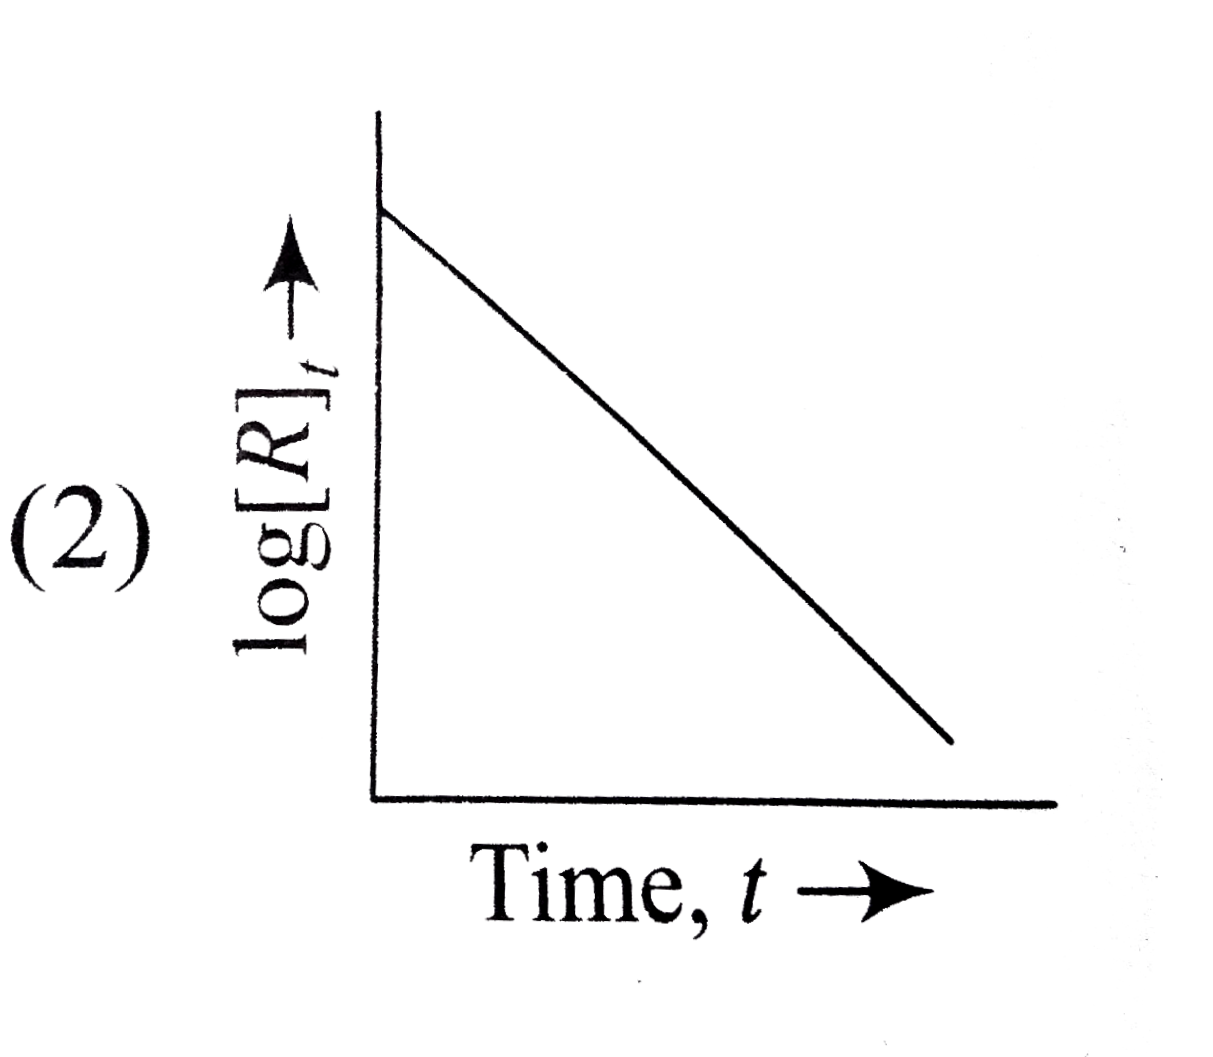
- Second Curve: This curve shows ln(R) versus time t. For a first-order reaction, this plot should yield a straight line with a negative slope.
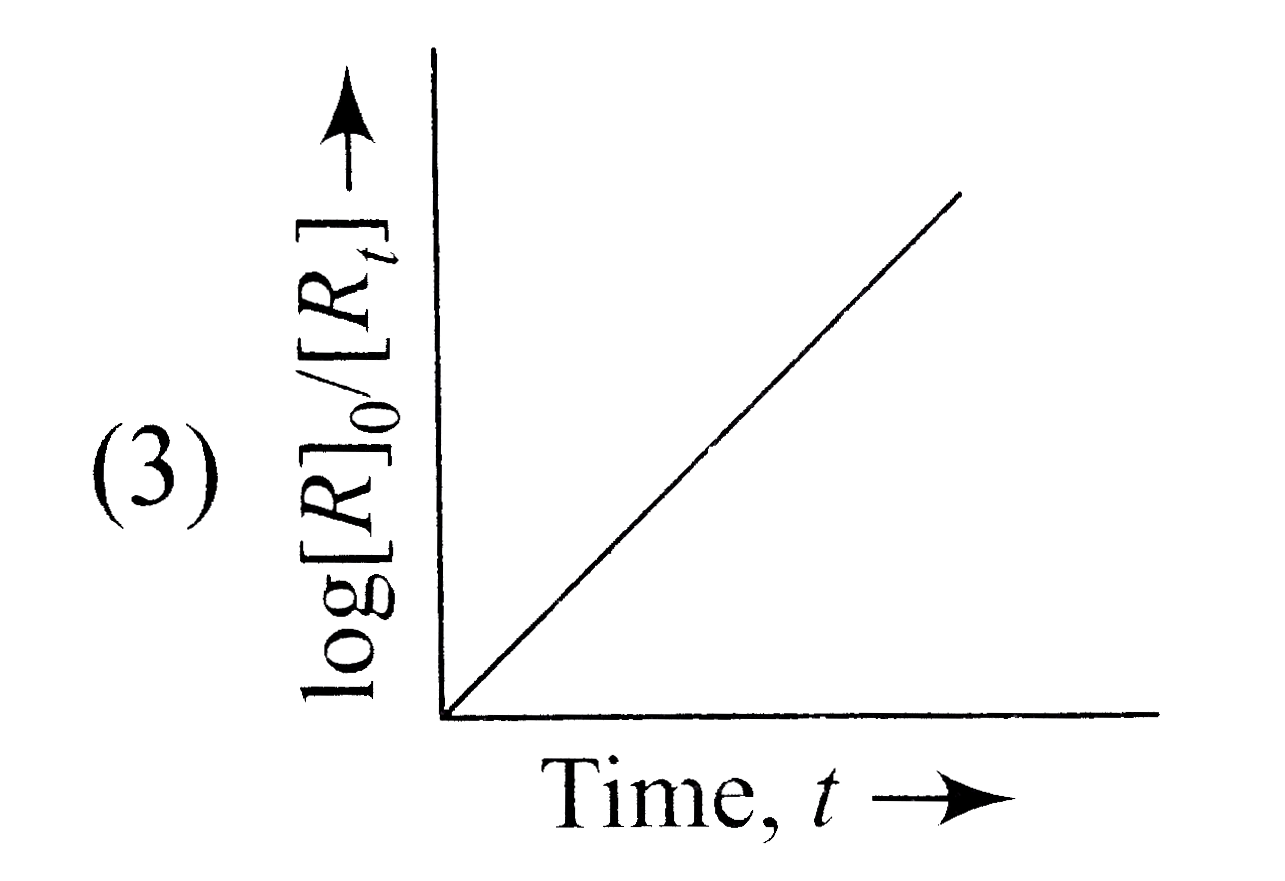
- Third Curve: This curve shows ln((R0)(R)) versus time t. According to the integrated rate law, this should also yield a straight line with a positive slope.
4. Conclusion:
The second and third curves represent first-order reactions, as they yield straight lines when plotted. However, the most common representation of a first-order reaction is the plot of ln(R) versus time, which is the second curve.
Final Answer:
The second curve (log concentration of reactant at time t versus time t) represents a first-order reaction.
---
The rate of a first-order reaction can be expressed as:
−d(R)dt=k(R)
where (R) is the concentration of the reactant, t is time, and k is the rate constant.
For a first-order reaction, the integrated rate law is given by:
ln((R0)(R))=kt
where (R0) is the initial concentration of the reactant and (R) is the concentration at time t.
- First Curve: This curve shows the concentration of the reactant (R) versus time t. For a first-order reaction, this curve would typically show an exponential decay.
- Second Curve: This curve shows ln(R) versus time t. For a first-order reaction, this plot should yield a straight line with a negative slope.
- Third Curve: This curve shows ln((R0)(R)) versus time t. According to the integrated rate law, this should also yield a straight line with a positive slope.
The second and third curves represent first-order reactions, as they yield straight lines when plotted. However, the most common representation of a first-order reaction is the plot of ln(R) versus time, which is the second curve.
The second curve (log concentration of reactant at time t versus time t) represents a first-order reaction.
Topper's Solved these Questions
- BOOK - R SHARMACHAPTER - CHEMICAL KINETICSEXERCISE - Follow-up 512videos
CHEMICAL KINETICS
- BOOK - R SHARMACHAPTER - CHEMICAL KINETICSEXERCISE - Follow-up 62videos
CHEMICAL KINETICS
- BOOK - R SHARMACHAPTER - CHEMICAL KINETICSEXERCISE - Follow-up 310videos
CHEMICAL KINETICS
- BOOK - R SHARMACHAPTER - BIOMOLECULESEXERCISE - Archives47videos
BIOMOLECULES
- BOOK - R SHARMACHAPTER - CHEMISTRY IN EVERYDAY LIFEEXERCISE - Archives11videos
CHEMISTRY IN EVERYDAY LIFE
Similar Questions
Knowledge Check
- Question 1 - Select One
Which of the following curves represents a third order reaction ?
A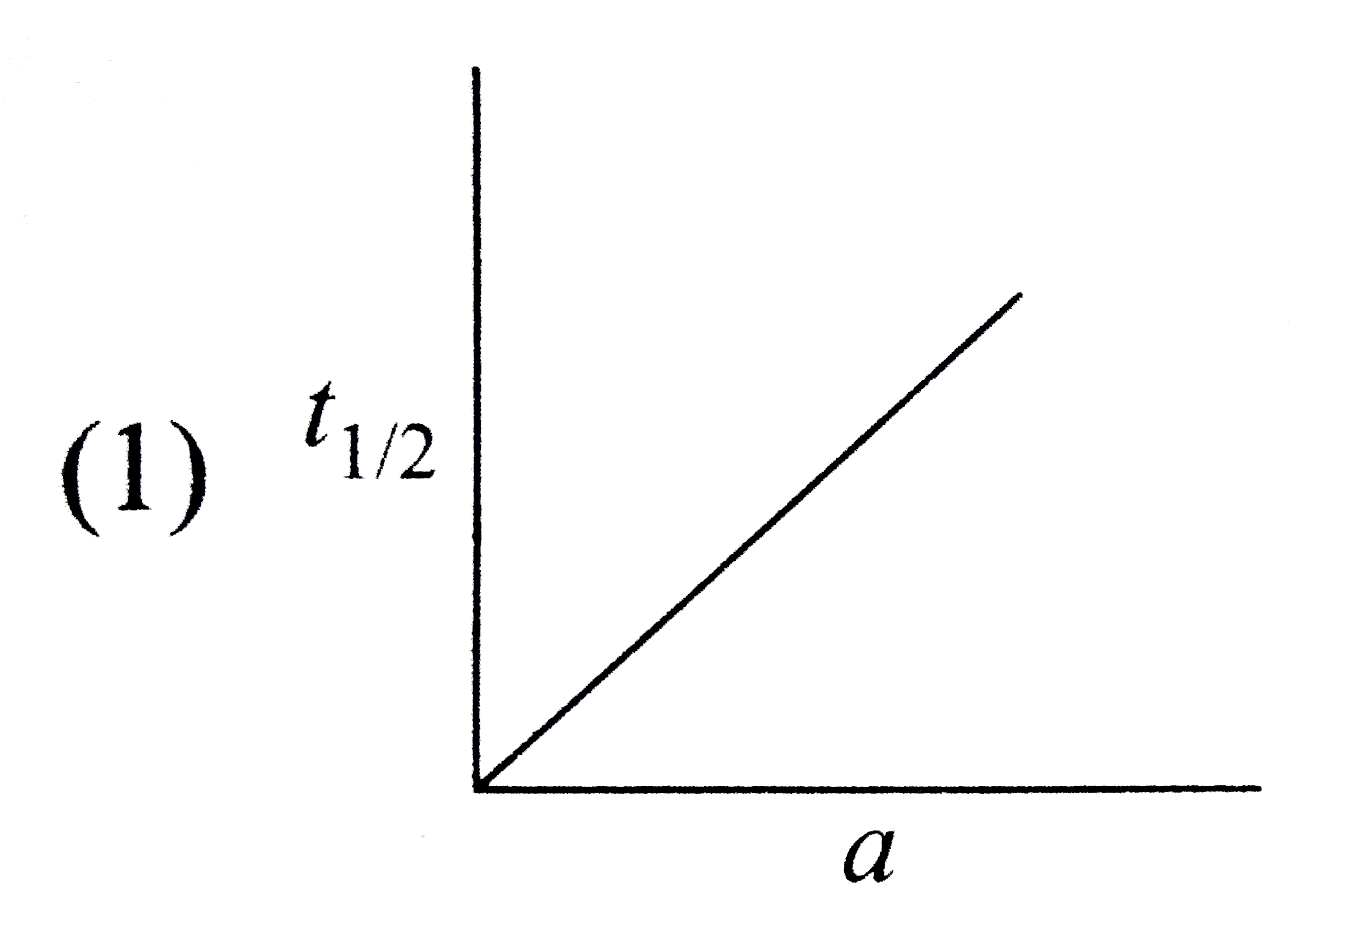 B
B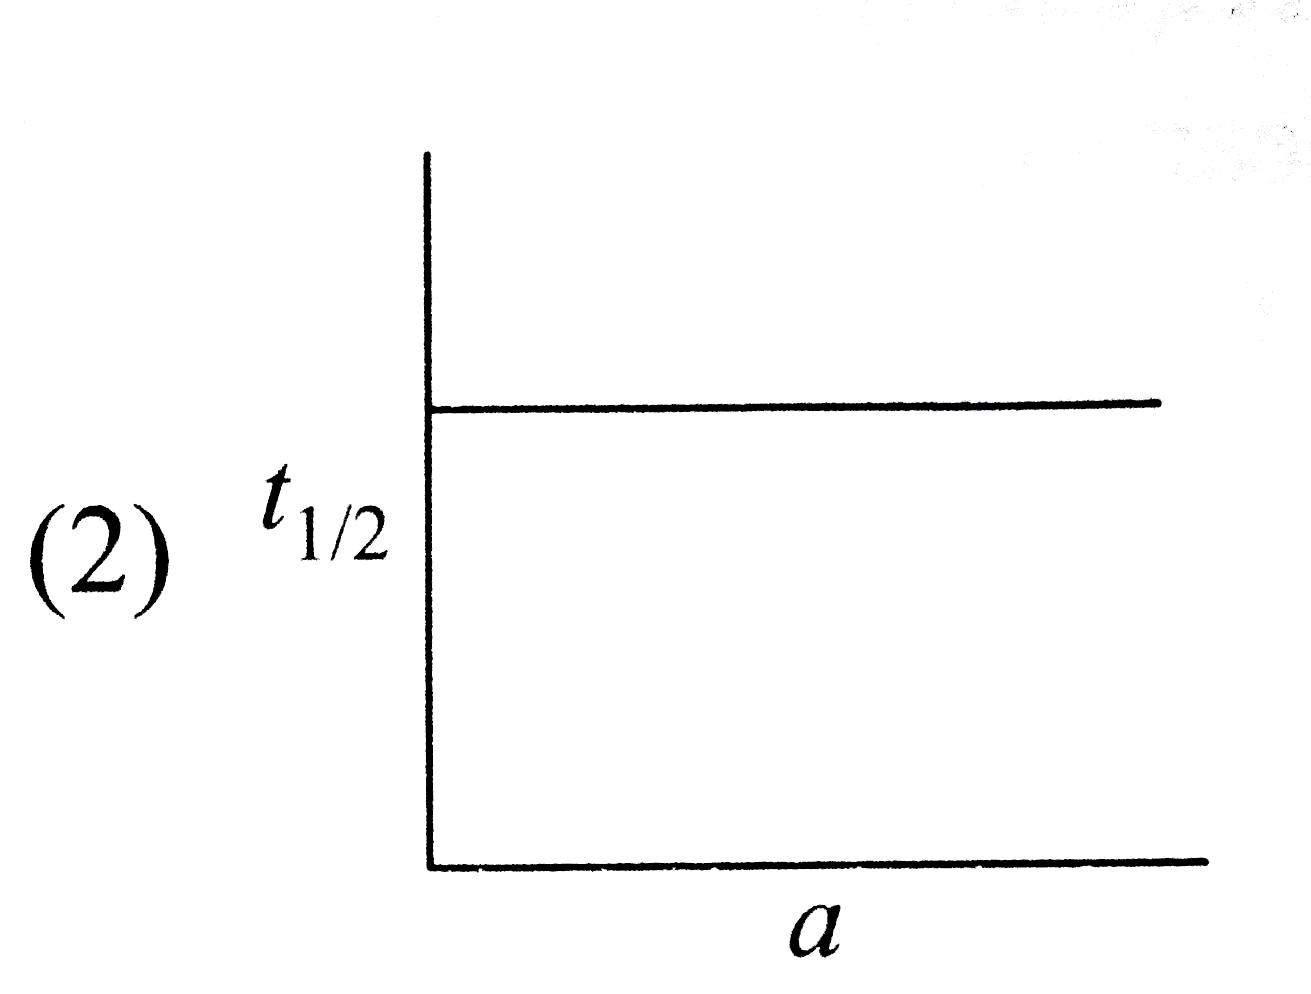 C
C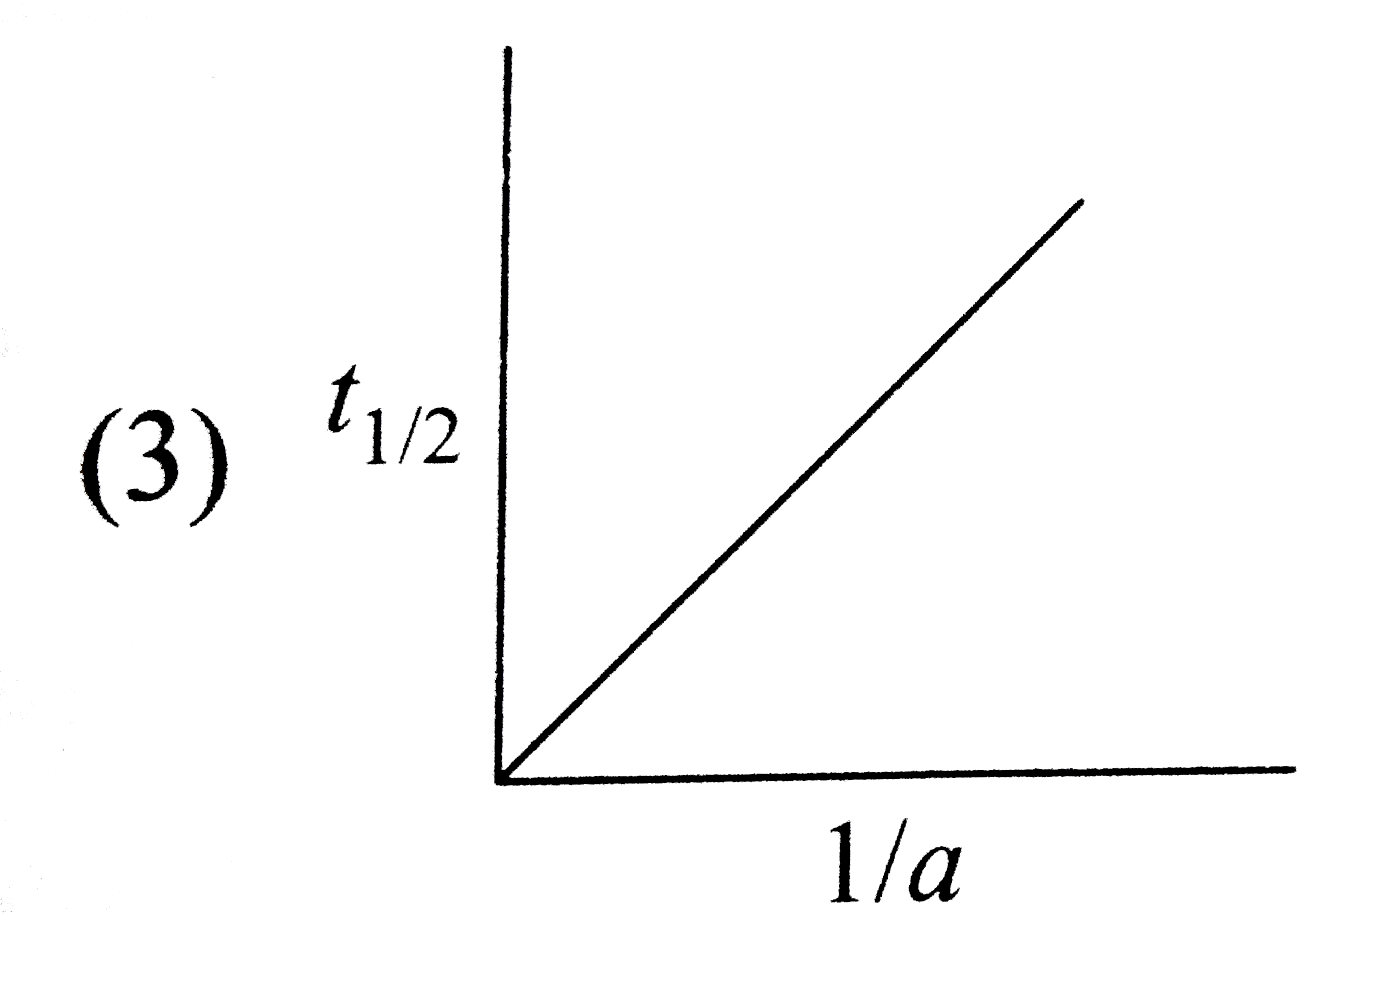 D
D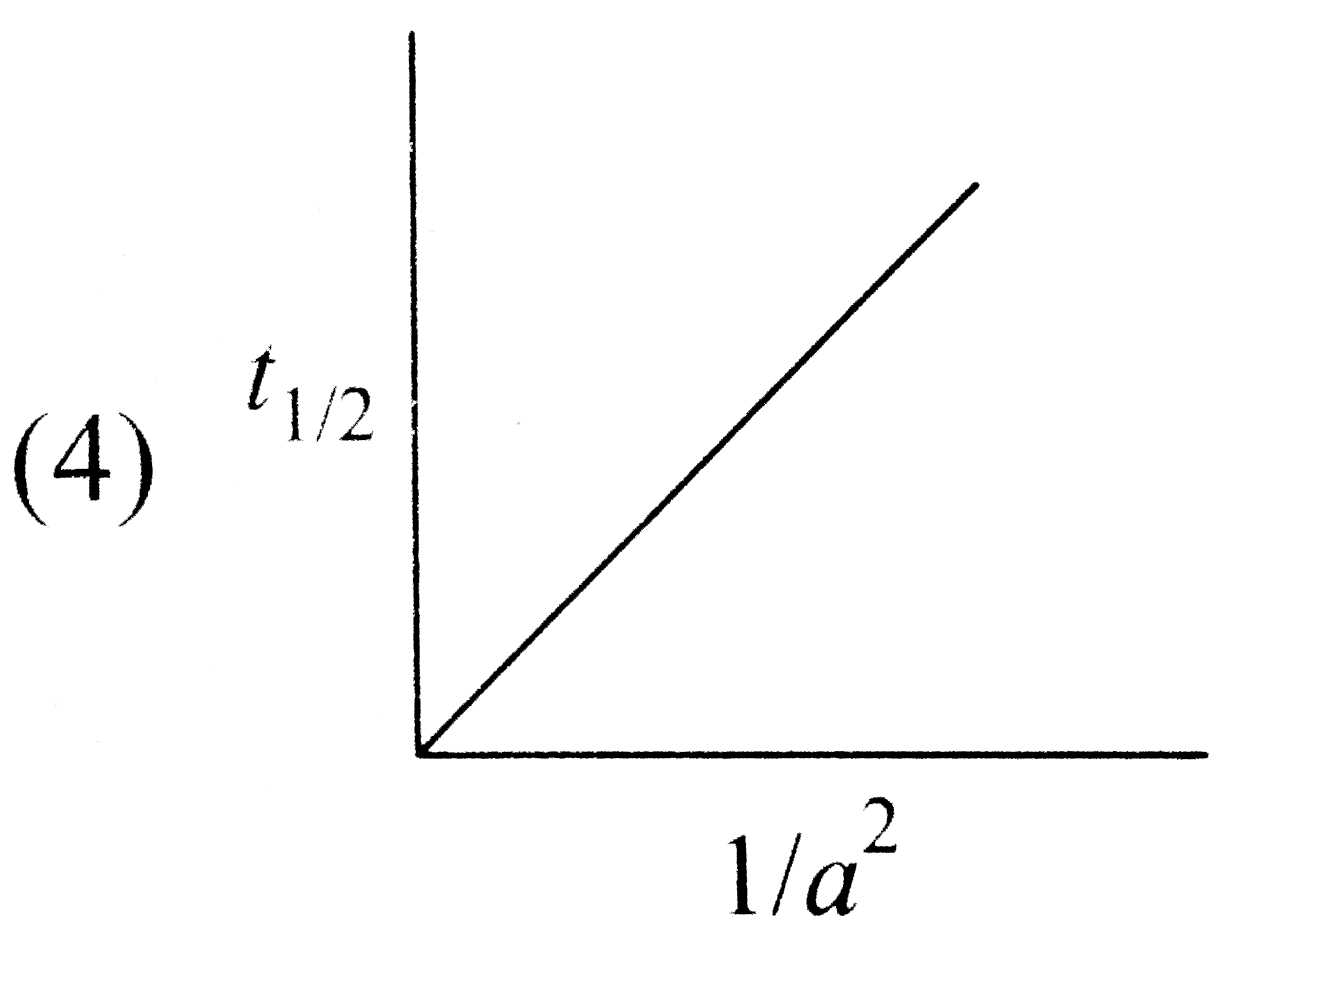
- Question 2 - Select One
Which of the following graphs represents a first order reaction ?
A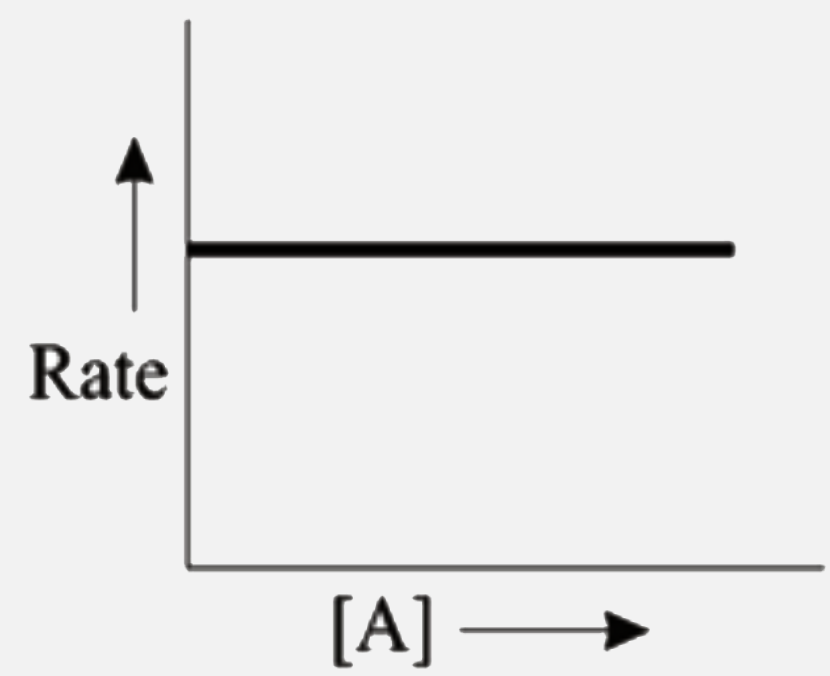 B
B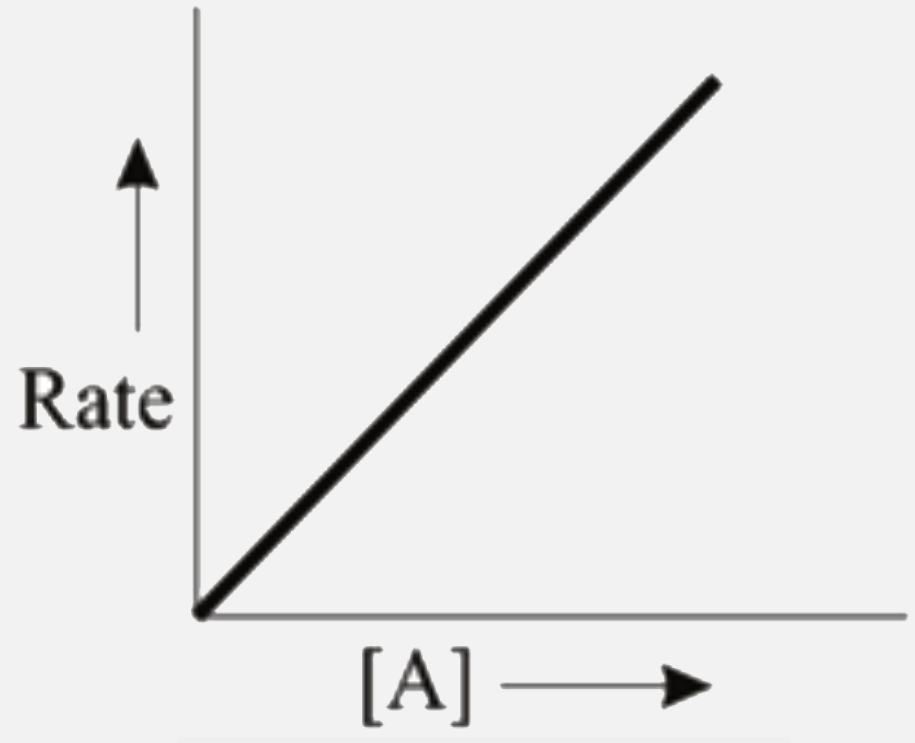 C
C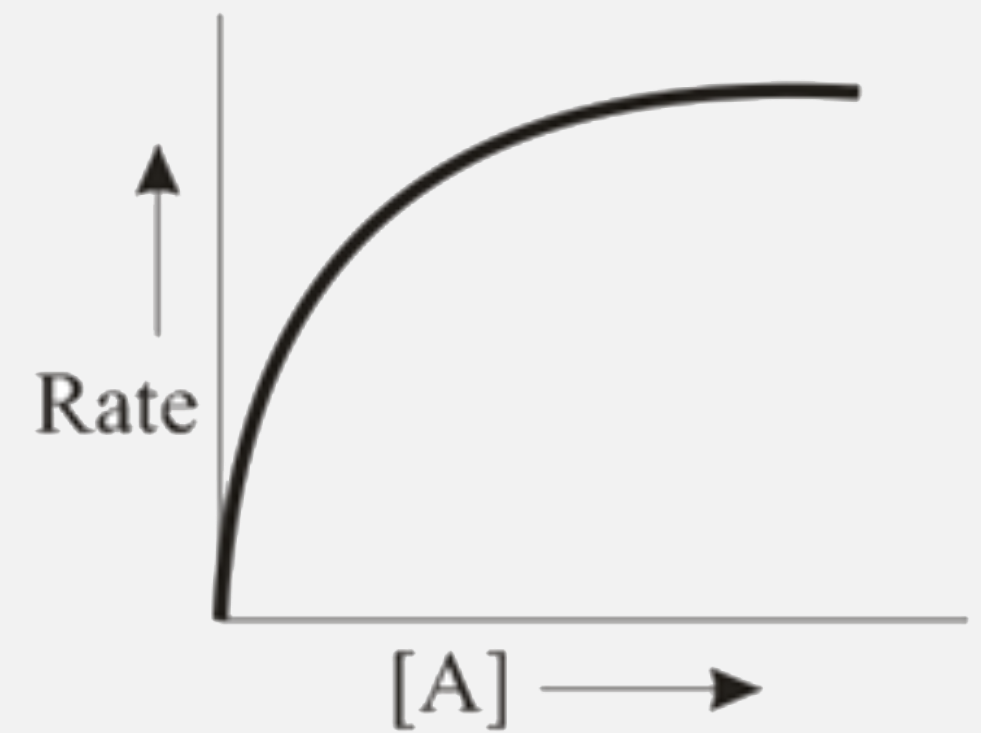 D
D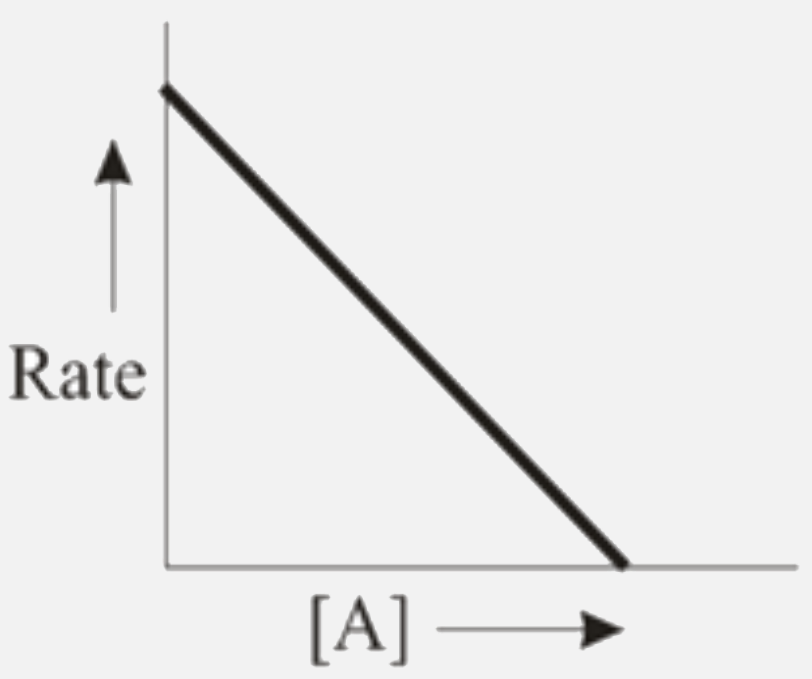
- Question 3 - Select One
Which of the following curves represents a zero order reaction ? [(a−x) =reactant concn.]
A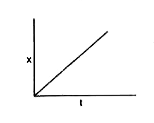 B
B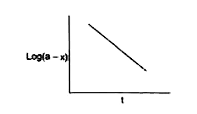 C
C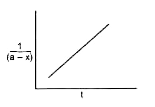 D
D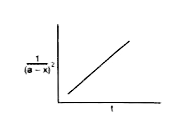
Which of the following curves represent(s) a zero-order reaction?
View SolutionWhich of the following does not represent a first order reation?
View SolutionWhich of the following curve represent zero order reaction of A→ products ?
View SolutionWhich of the following curve represent zero order reaction of A→ products ?
View SolutionWhich one of the following formula represents a first order reaction?
View Solution

