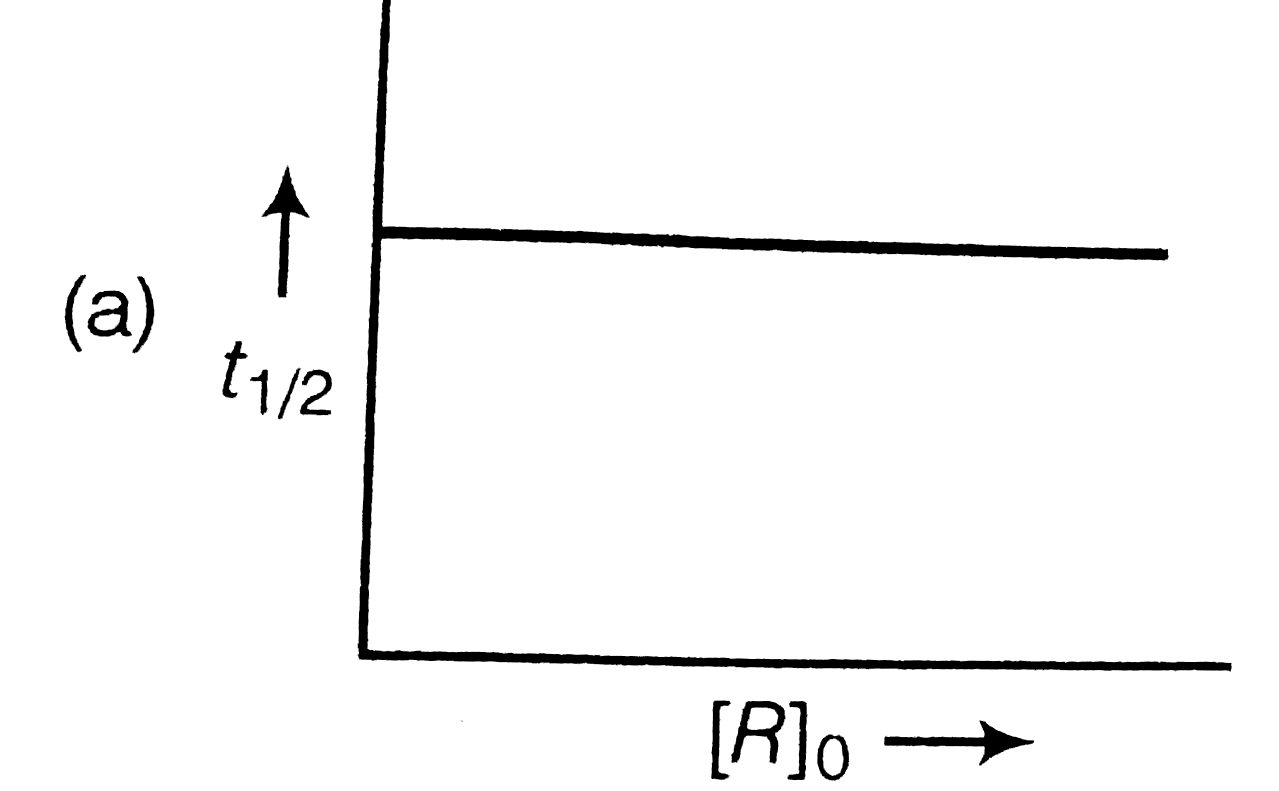
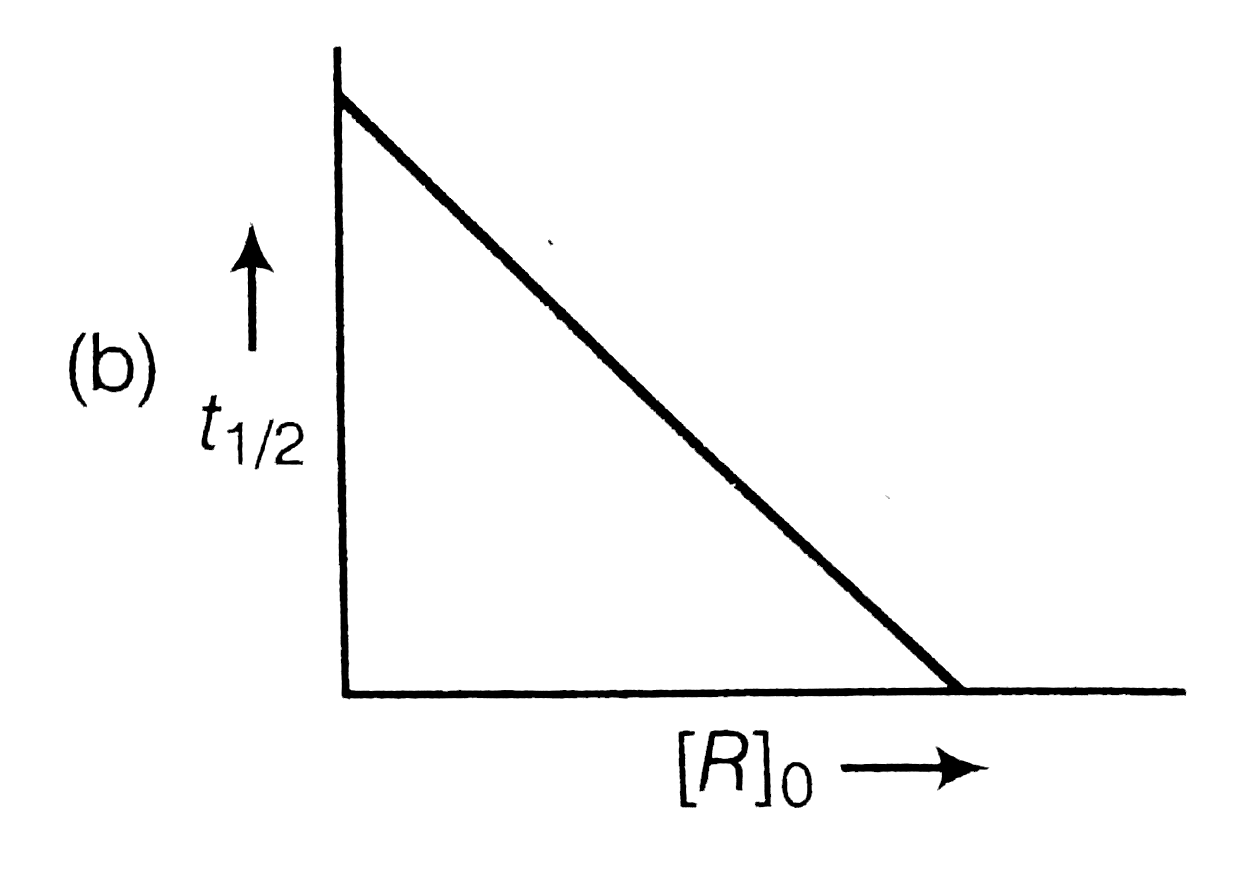
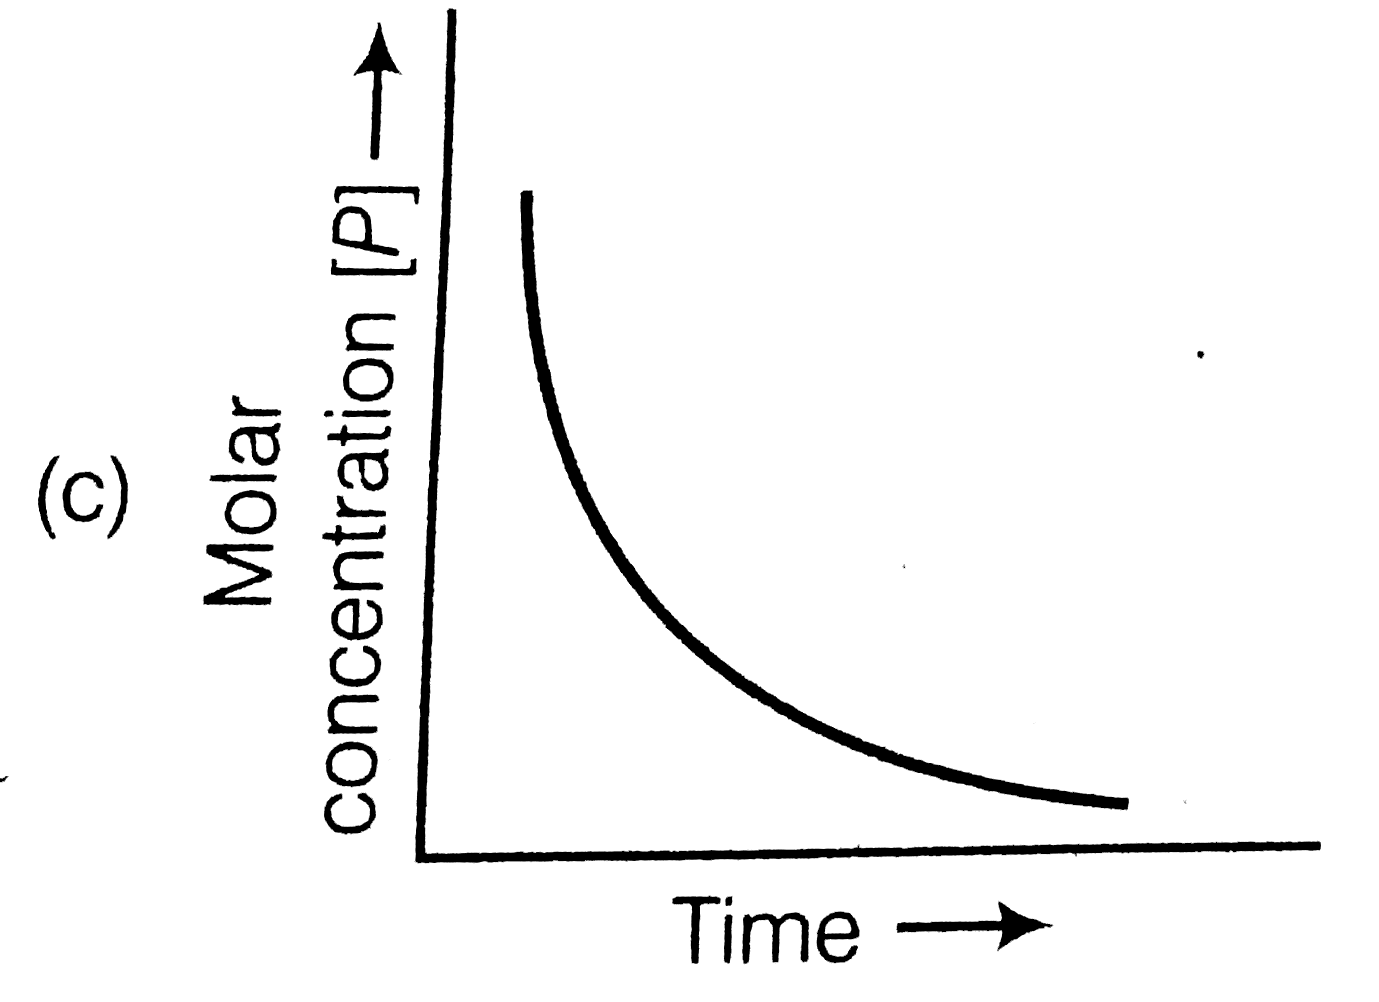
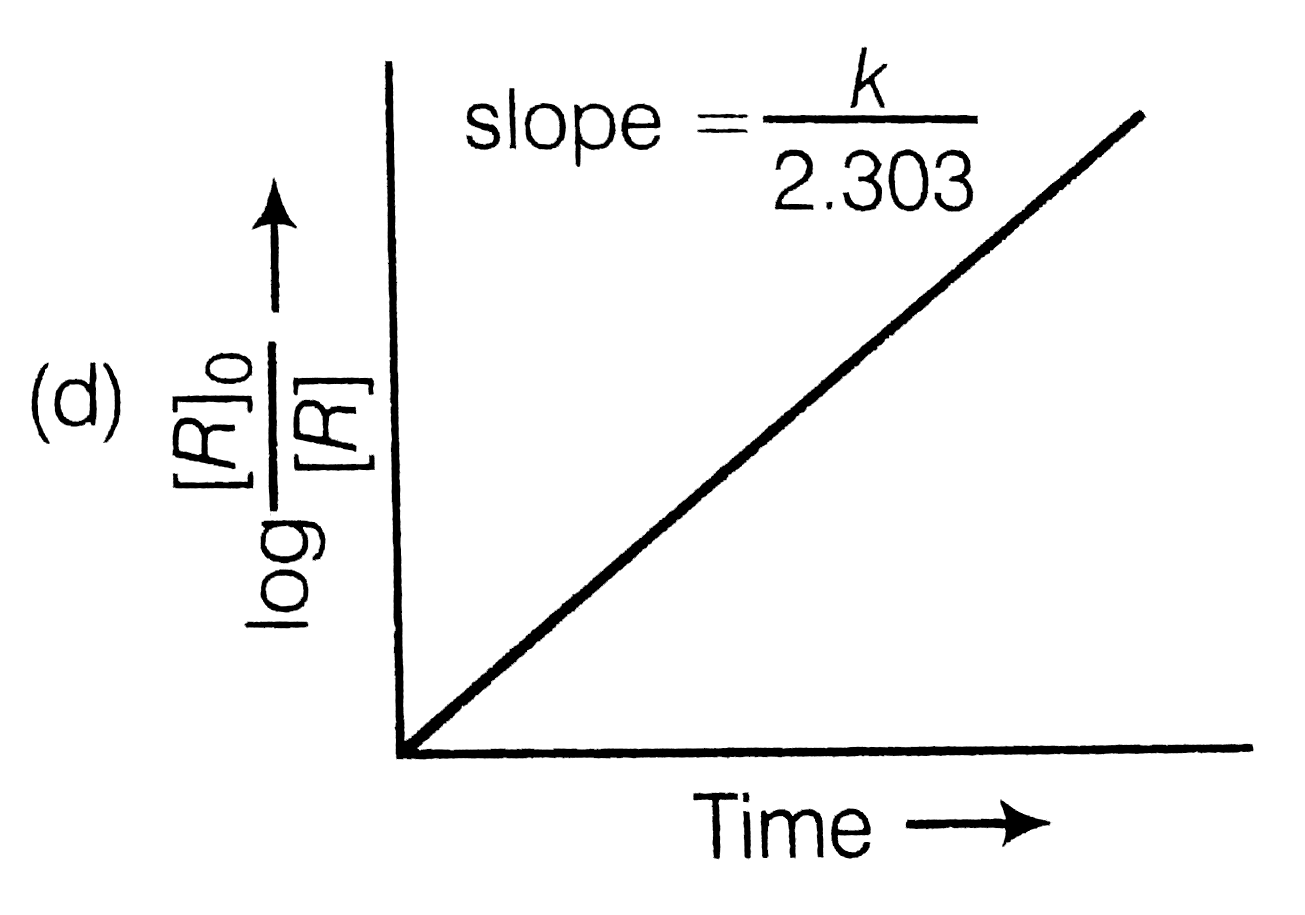
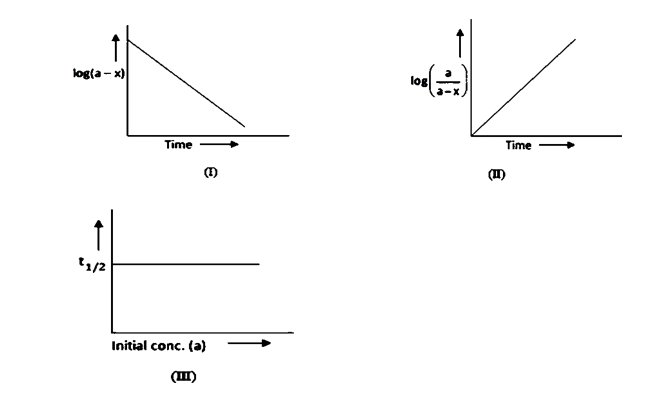
Which of the following graph is correct for a first order reaction ?
The correct Answer is:A, D
To determine which graphs are correct for a first-order reaction, we need to analyze the characteristics of first-order kinetics and the relevant equations.
1. Understanding First-Order Reactions:
A first-order reaction is characterized by a rate that is directly proportional to the concentration of one reactant. The rate law can be expressed as:
Rate=k(A)
where k is the rate constant and (A) is the concentration of the reactant.
2. Half-Life of First-Order Reactions:
The half-life (t1/2) of a first-order reaction is given by the formula:
t1/2=0.693k
Importantly, this half-life is independent of the initial concentration of the reactant. This means that a graph plotting half-life against concentration will not show a relationship; hence, this graph is incorrect.
3. Concentration vs. Time:
For a first-order reaction, the relationship between concentration and time can be expressed as:
ln(A)=ln(A0)−kt
Rearranging gives:
ln(A)=−kt+ln(A0)
This is a linear equation in the form y=mx+b, where:
- y=ln(A)
- m=−k
- x=t
- b=ln(A0)
Therefore, a plot of ln(A) versus time will yield a straight line with a slope of −k.
4. Logarithmic Form:
Alternatively, using the logarithmic form, we can express the concentration in terms of its initial value:
log(A)=log(A0)−k2.303t
This indicates that plotting log(A) versus time will also yield a straight line.
5. Identifying Correct Graphs:
- Graph of Half-Life vs. Concentration: Incorrect, as half-life does not depend on concentration.
- Graph of ln(A) vs. Time: Correct, as it shows a linear relationship.
- Graph of log(A) vs. Time: Correct, as it also shows a linear relationship.
Conclusion:
The correct graphs for a first-order reaction are:
- Graph A: Half-life vs. Concentration (Incorrect)
- Graph B: ln(A) vs. Time (Correct)
- Graph C: log(A) vs. Time (Correct)
- Graph D: Concentration vs. Time (Incorrect)
Thus, the correct options are B and C.
A first-order reaction is characterized by a rate that is directly proportional to the concentration of one reactant. The rate law can be expressed as:
Rate=k(A)
where k is the rate constant and (A) is the concentration of the reactant.
The half-life (t1/2) of a first-order reaction is given by the formula:
t1/2=0.693k
Importantly, this half-life is independent of the initial concentration of the reactant. This means that a graph plotting half-life against concentration will not show a relationship; hence, this graph is incorrect.
For a first-order reaction, the relationship between concentration and time can be expressed as:
ln(A)=ln(A0)−kt
Rearranging gives:
ln(A)=−kt+ln(A0)
This is a linear equation in the form y=mx+b, where:
- y=ln(A)
- m=−k
- x=t
- b=ln(A0)
Alternatively, using the logarithmic form, we can express the concentration in terms of its initial value:
log(A)=log(A0)−k2.303t
This indicates that plotting log(A) versus time will also yield a straight line.
- Graph of Half-Life vs. Concentration: Incorrect, as half-life does not depend on concentration.
- Graph of ln(A) vs. Time: Correct, as it shows a linear relationship.
- Graph of log(A) vs. Time: Correct, as it also shows a linear relationship.
The correct graphs for a first-order reaction are:
- Graph A: Half-life vs. Concentration (Incorrect)
- Graph B: ln(A) vs. Time (Correct)
- Graph C: log(A) vs. Time (Correct)
- Graph D: Concentration vs. Time (Incorrect)
Topper's Solved these Questions
- CHEMICAL KINETICSBOOK - NCERT EXEMPLAR ENGLISHCHAPTER - CHEMICAL KINETICSEXERCISE - SHORT ANSWER TYPE QUESTION
20 Videos
- CHEMICAL KINETICSBOOK - NCERT EXEMPLAR ENGLISHCHAPTER - CHEMICAL KINETICSEXERCISE - MATCHING THE COLUMNS
9 Videos
- CHEMICAL KINETICSBOOK - NCERT EXEMPLAR ENGLISHCHAPTER - CHEMICAL KINETICSEXERCISE - LONG ANSWER TYPE QUESTIONS
5 Videos
- BIOMOLECULES BOOK - NCERT EXEMPLAR ENGLISHCHAPTER - BIOMOLECULES EXERCISE - Long Answer Type Questions
5 Videos
- CHEMISTRY IN EVERYDAY LIFEBOOK - NCERT EXEMPLAR ENGLISHCHAPTER - CHEMISTRY IN EVERYDAY LIFEEXERCISE - Long Answer Type Qns
4 Videos
Similar Questions
Which of the following graph is correct for a zero order reaction ?
View SolutionWhich of the following order is correct?
View SolutionWhich of the following order is correct?
View SolutionWhich of the following is (are) not correct for a first order reaction?
View SolutionWhich of the following graph is correct for zero order reaction?
View SolutionWhich of the following expresison is correct for first order reaction (c0 refers to initial concentration of reactant)
View SolutionWhich of the following is/are correct for the first order reaction ? (a is initial concentration of reactant, x is concentration of the reactant reacted and t is time)
View SolutionWhich of the following is correct for zero and first order reactions respectively, where 'a' is initial concentration of the reactant ?
View SolutionWhich of the following expression is correct for first order reaction? Ao refers to initial concentration of reactant
View SolutionWhich of the following is/are correct for the first order reaction?

View Solution
