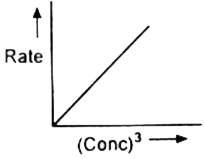
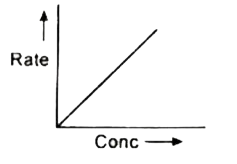
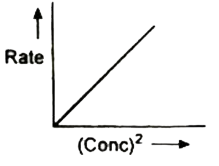
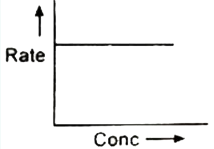
Which of the following graph is correct for zero order reaction?


The correct Answer is:D
To determine the correct graph for a zero-order reaction, we need to understand the characteristics of zero-order kinetics.
1. Understanding Zero-Order Reactions:
- In a zero-order reaction, the rate of the reaction is constant and does not depend on the concentration of the reactants. This means that the rate (R) is equal to a constant (K).
- Mathematically, this can be expressed as:
R=K
- Since the rate is constant, changes in the concentration of the reactant do not affect the rate of the reaction.
2. Graphical Representation:
- For a zero-order reaction, if we plot the rate of the reaction (R) against the concentration of the reactant ((A)), we will get a horizontal line (a straight line parallel to the x-axis) because the rate remains constant regardless of the concentration.
- This means that the graph will not show any slope; it will simply be a straight line.
3. Analyzing the Options:
- We are given four options (graphs) to choose from.
- We need to identify which graph represents a horizontal line, indicating that the rate does not change with concentration.
4. Conclusion:
- Upon analyzing the options, the correct graph for a zero-order reaction is the one that shows a straight line parallel to the x-axis, which corresponds to option number 4.
Final Answer:
The correct graph for a zero-order reaction is Option 4.
- In a zero-order reaction, the rate of the reaction is constant and does not depend on the concentration of the reactants. This means that the rate (R) is equal to a constant (K).
- Mathematically, this can be expressed as:
R=K
- Since the rate is constant, changes in the concentration of the reactant do not affect the rate of the reaction.
- For a zero-order reaction, if we plot the rate of the reaction (R) against the concentration of the reactant ((A)), we will get a horizontal line (a straight line parallel to the x-axis) because the rate remains constant regardless of the concentration.
- This means that the graph will not show any slope; it will simply be a straight line.
- We are given four options (graphs) to choose from.
- We need to identify which graph represents a horizontal line, indicating that the rate does not change with concentration.
- Upon analyzing the options, the correct graph for a zero-order reaction is the one that shows a straight line parallel to the x-axis, which corresponds to option number 4.
The correct graph for a zero-order reaction is Option 4.
Similar Questions
Which of the following graph is correct for a zero order reaction ?
View SolutionWhich of the following graph is correct for a first order reaction ?
View SolutionWhich of the following order is correct?
View SolutionWhich of the following order is correct?
View SolutionWhich of the following is correct for a first order reaction ?
View SolutionWhich of the following graphs is for a second order reaction?
View SolutionWhich of the following is correct for zero and first order reactions respectively, where 'a' is initial concentration of the reactant ?
View SolutionWhich of the following expressions is correct for zero order respectively [Where a is initial concentration]?
View SolutionWhich of the following is/are correct for the first order reaction?
 View Solution
Which of the following expressions is correct for zero order and first order respectively [Where a is initial concentration]?
View Solution

