Which of the following graphs is consistent with ideal gas behaviour?
A
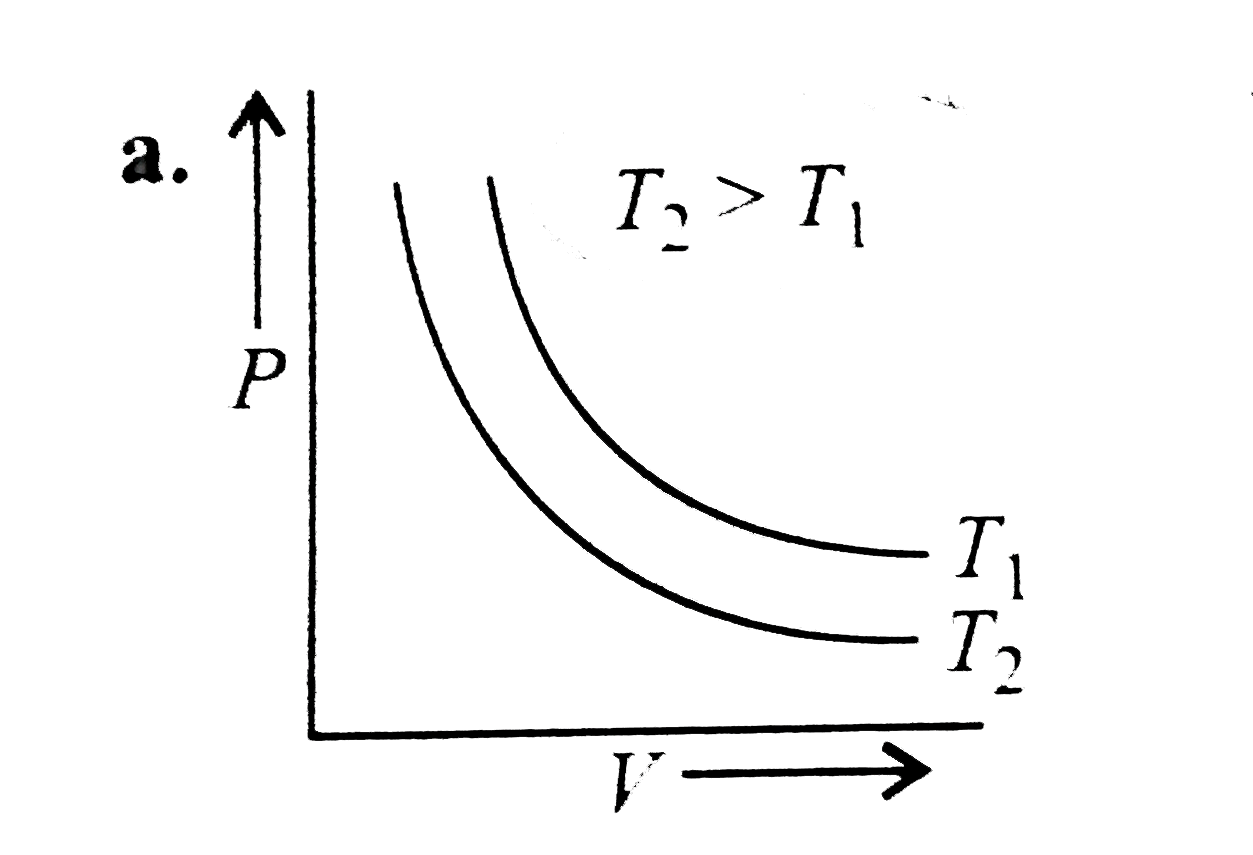
B
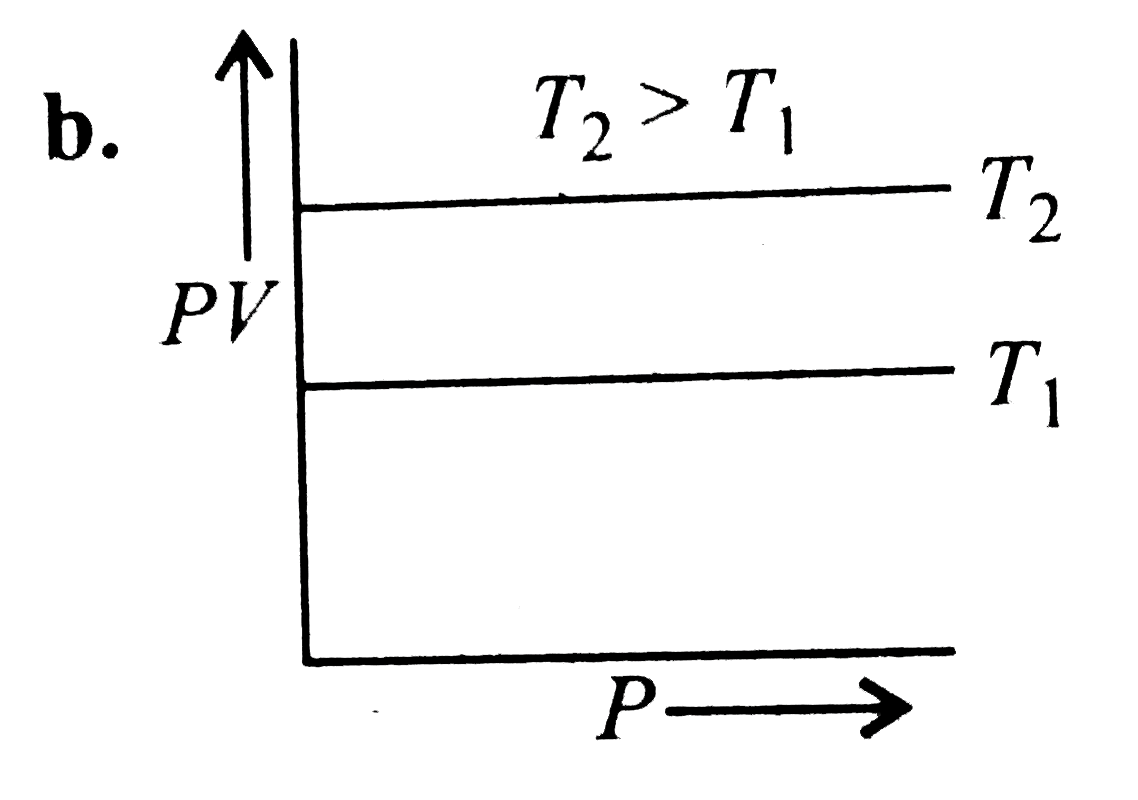
C
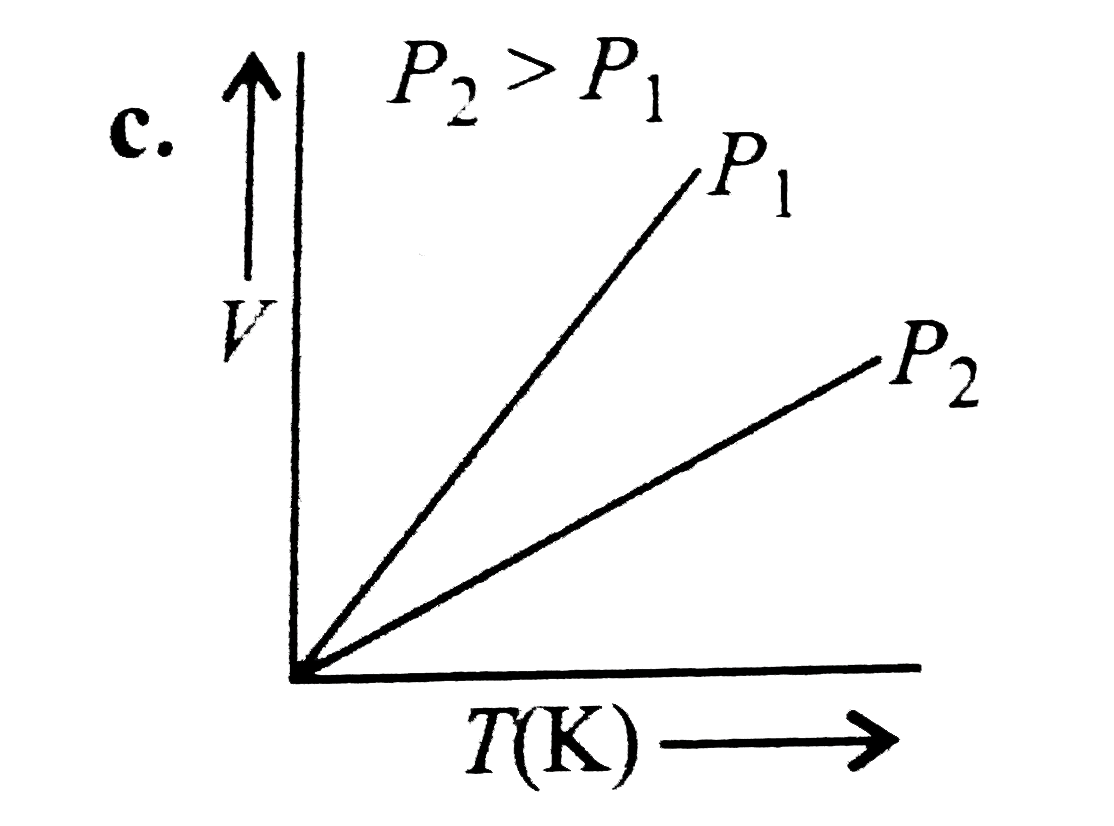
D
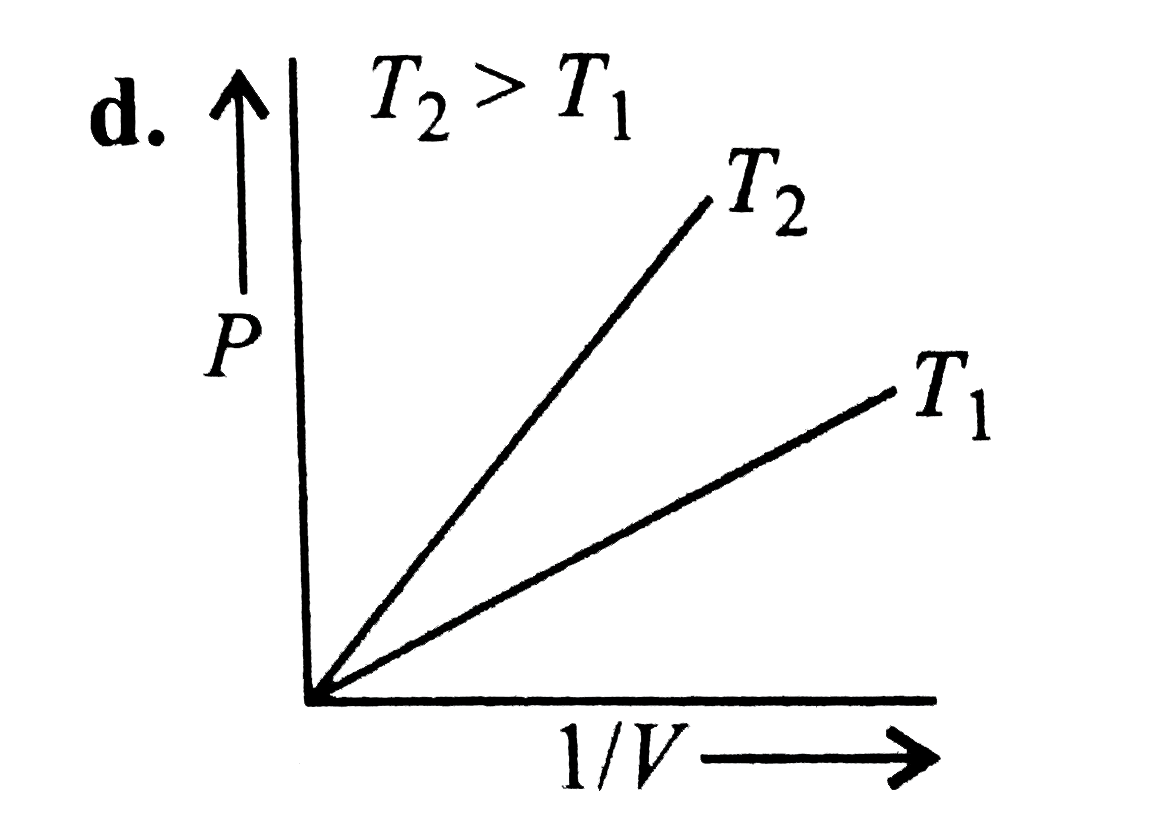
Text Solution
T1>T2
|
Topper's Solved these Questions
- STATES OF MATTERBOOK - CENGAGE CHEMISTRYCHAPTER - STATES OF MATTEREXERCISE - Exercises
21 Videos
- STATES OF MATTERBOOK - CENGAGE CHEMISTRYCHAPTER - STATES OF MATTEREXERCISE - Exercises (Linked Comprehensive)
48 Videos
- SOME BASIC CONCEPTS AND MOLE CONCEPTBOOK - CENGAGE CHEMISTRYCHAPTER - SOME BASIC CONCEPTS AND MOLE CONCEPTEXERCISE - Archives Subjective
11 Videos
- STOICHIOMETRYBOOK - CENGAGE CHEMISTRYCHAPTER - STOICHIOMETRYEXERCISE - Archives Subjective
33 Videos
Similar Questions
Knowledge Check
Which of the following graphs is inconsistent with ideal gas behaviour ? (Assume n = constant)
A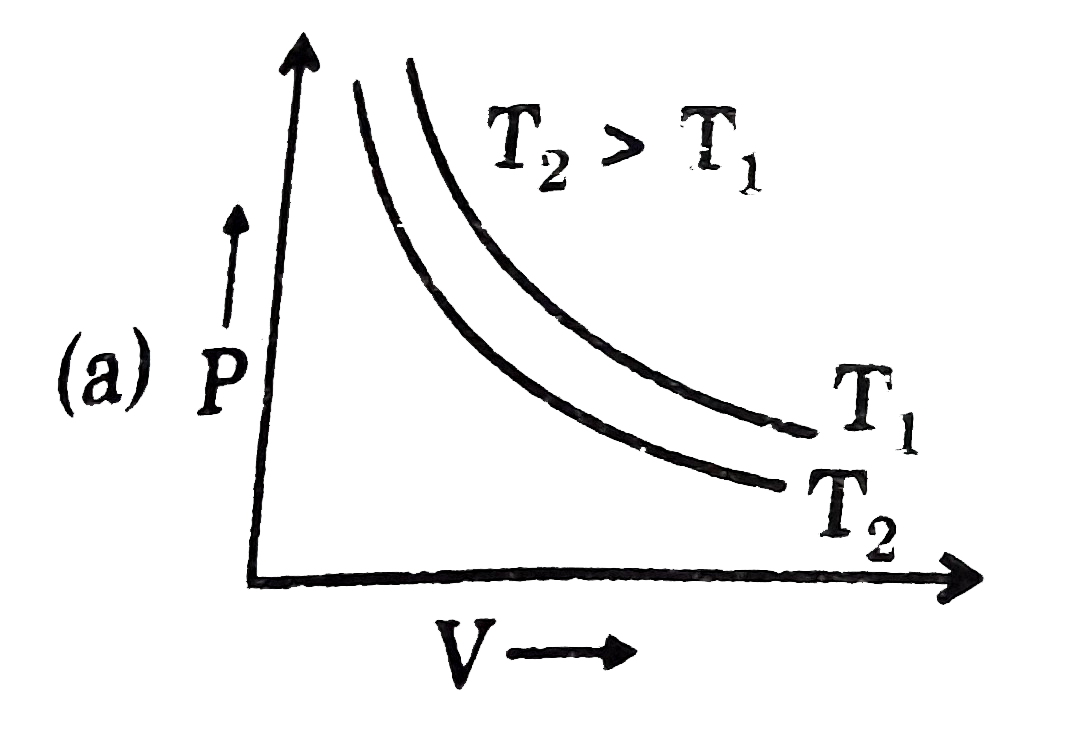 B
B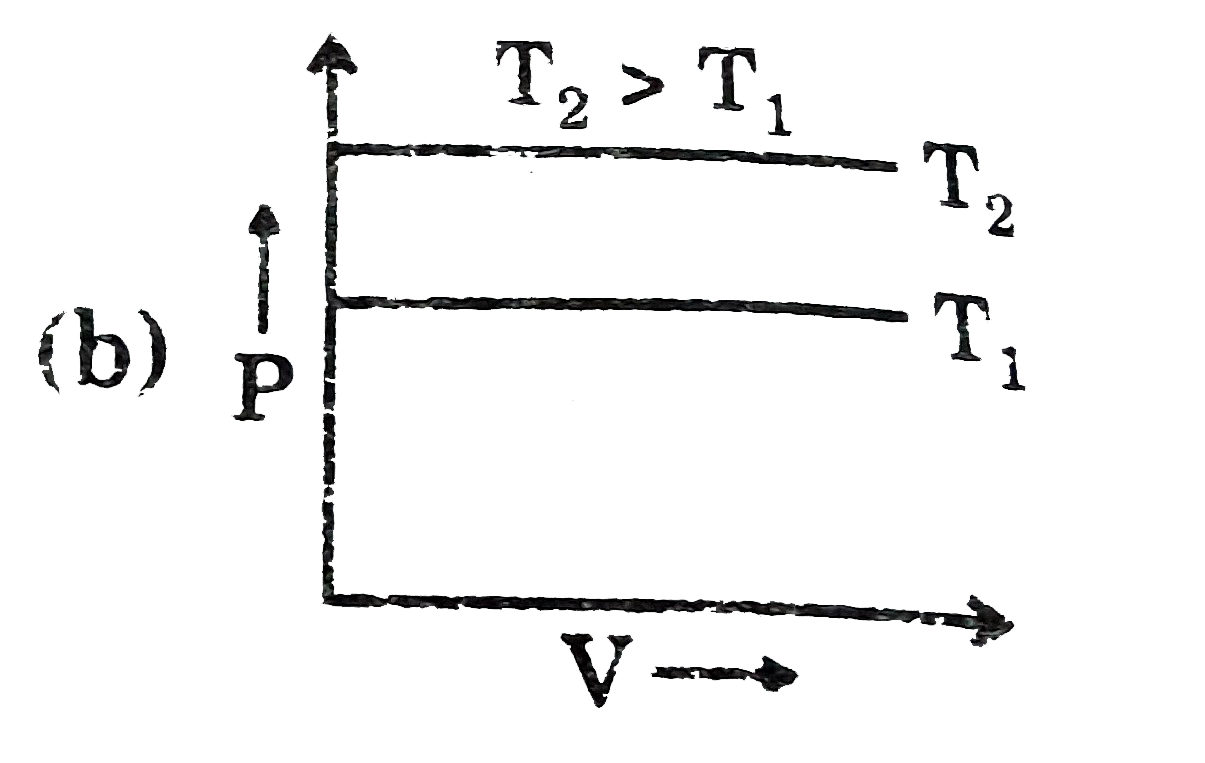 C
C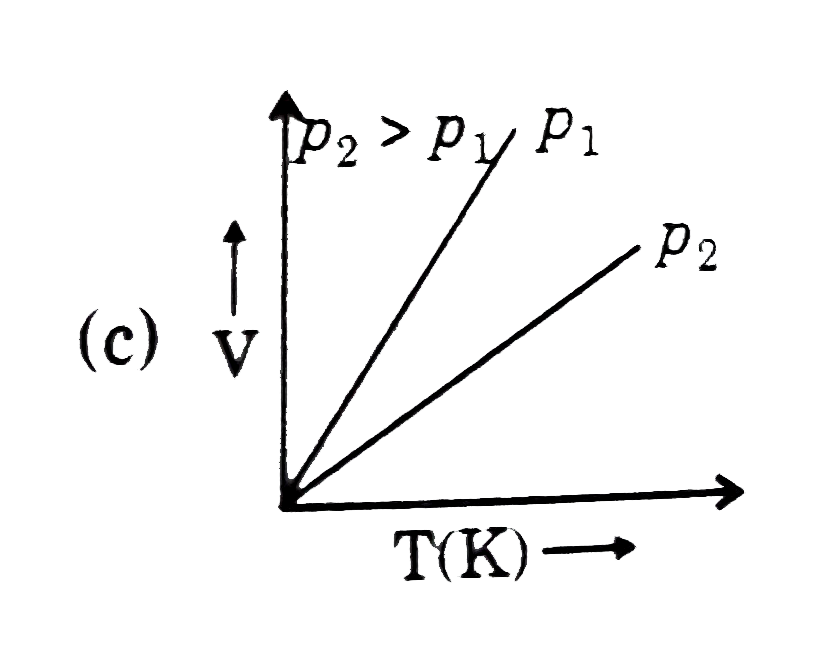 D
D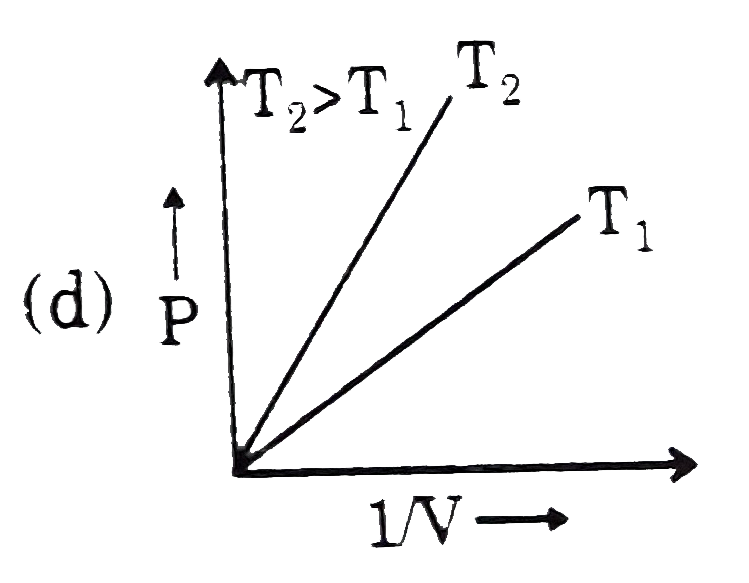
Which one of the following graphs correctly gives the ideal gas behaviour ?
A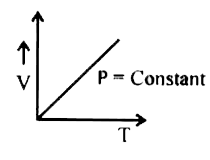 B
B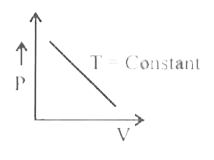 C
C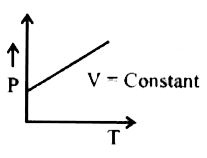 D
D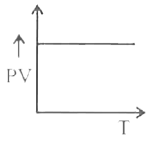
Which of the following diagrams, Fig. depicts ideal gas behaviour ?
A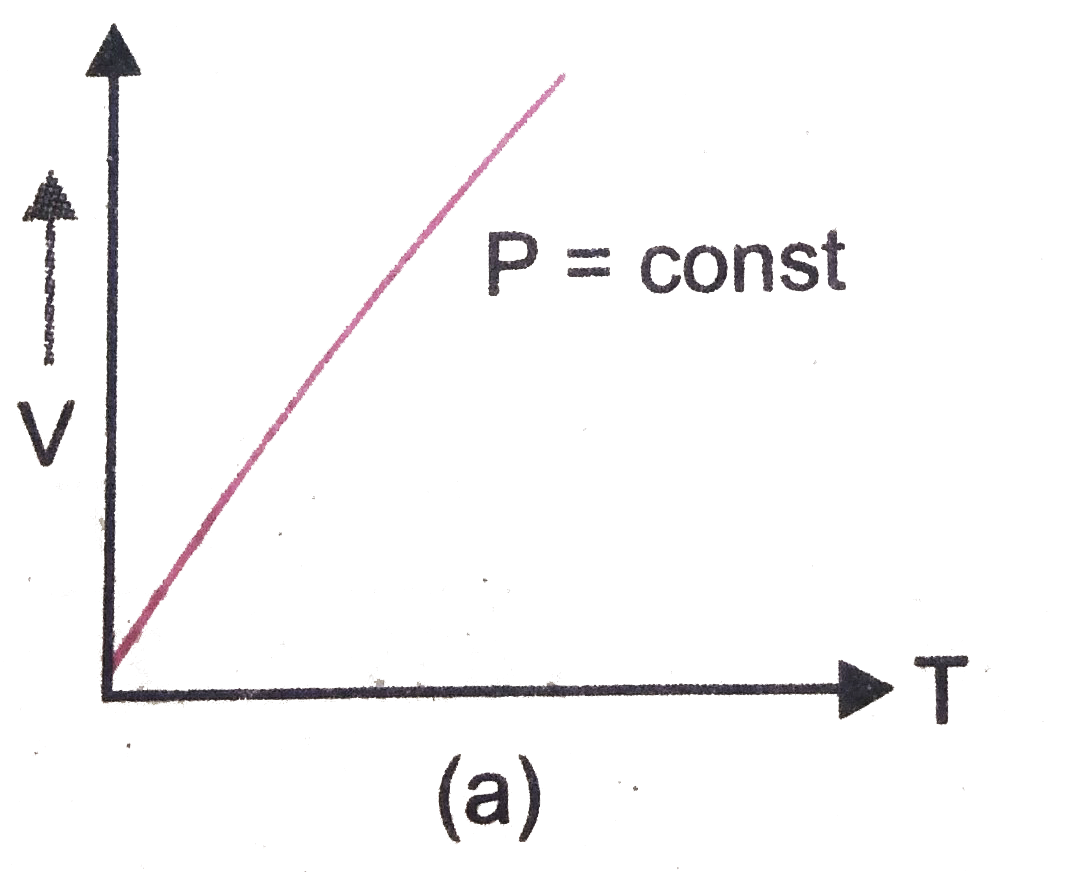 B
B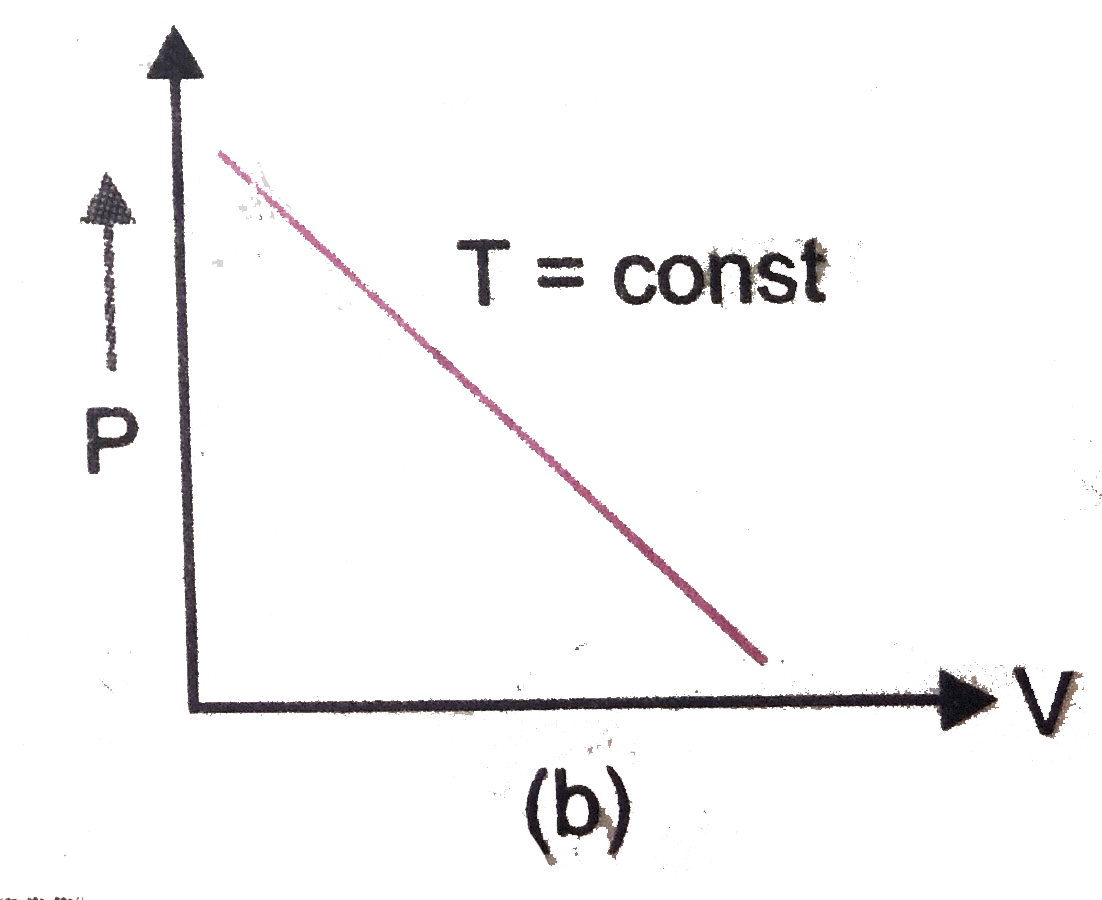 C
C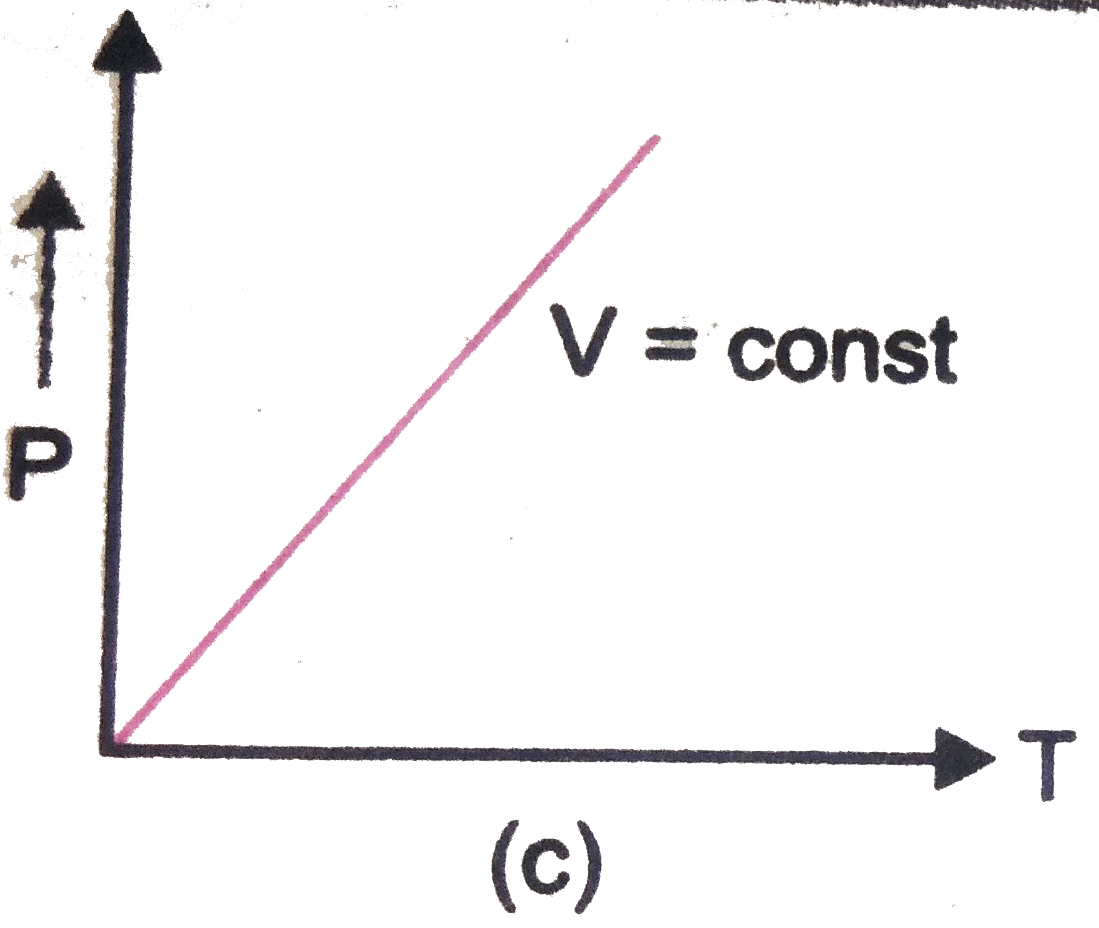 D
D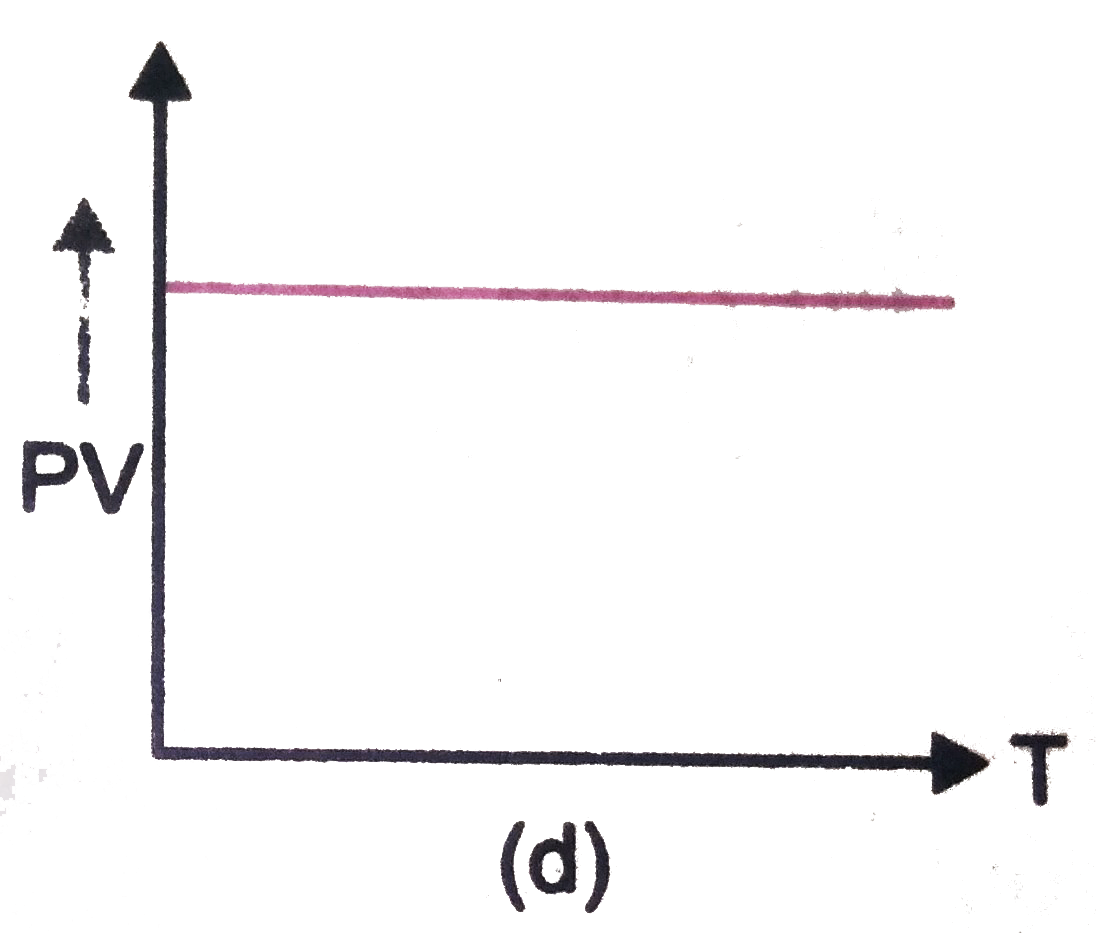
Which of the following graph is incorrect for an ideal gas?

View SolutionWhich of the following diagrams (figure) depicts ideal gas behaviour?
View SolutionWhich of the following diagrams (figure) depicts ideal gas behaviour?
View SolutionWhich of the following graphs is not a straight line for an ideal gas ?
View SolutionWhich of the following graphs represent the behaviour of an ideal gas ?
View Solution
