Which of the following graphs is inconsistent with ideal gas behaviour ? (Assume n = constant)
The correct Answer is:C
To determine which graph is inconsistent with ideal gas behavior, we can analyze the relationships between pressure (P), volume (V), and temperature (T) based on the ideal gas law, which states:
PV=nRT
Where:
- P = pressure
- V = volume
- n = number of moles (constant)
- R = ideal gas constant
- T = temperature
1. Identify the Relationships:
- From the ideal gas law, we can derive several relationships:
- P∝1V (at constant T)
- V∝T (at constant P)
- P∝T (at constant V)
2. Analyze Each Graph:
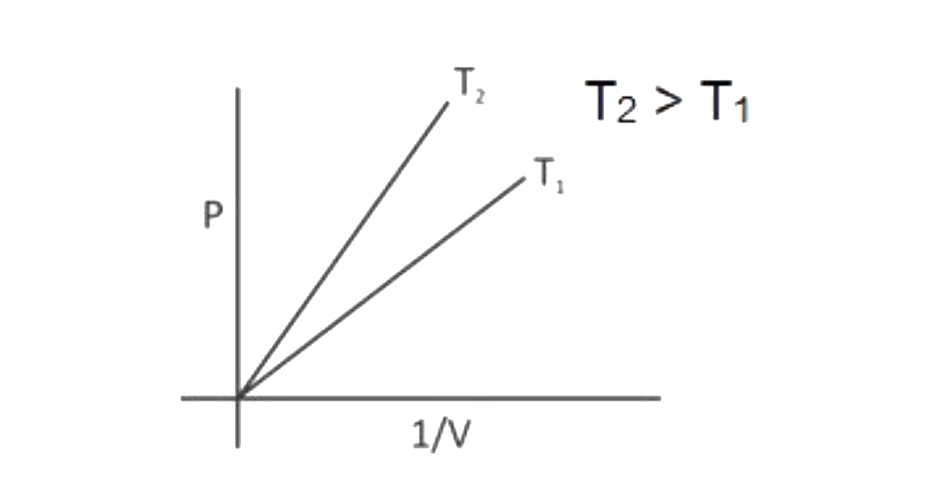
- Graph A: Pressure vs. 1V
- Since P is directly proportional to 1V, this graph should show a linear relationship. If temperature increases, the slope will increase. This is consistent with ideal gas behavior.
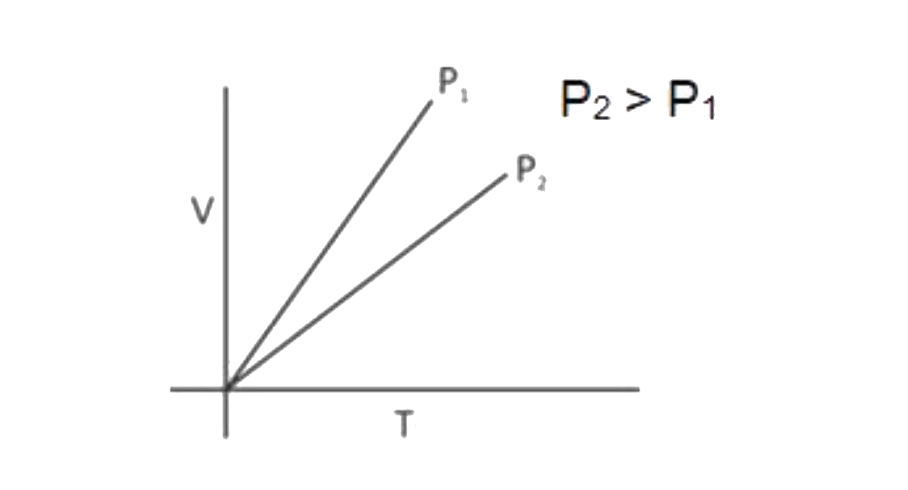
- Graph B: Volume vs. Temperature
- Since V is directly proportional to T at constant pressure, this graph should also show a linear relationship. If pressure increases, the graph will shift upwards. This is consistent with ideal gas behavior.
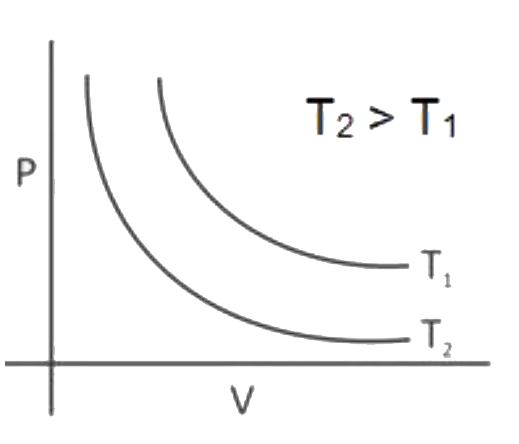
- Graph C: Pressure vs. Volume
- Here, P is inversely proportional to V (Boyle's Law). If temperature increases, the graph should show that for a given temperature, as volume increases, pressure decreases. If T2 is greater than T1, the graph should shift upwards. This is consistent with ideal gas behavior.
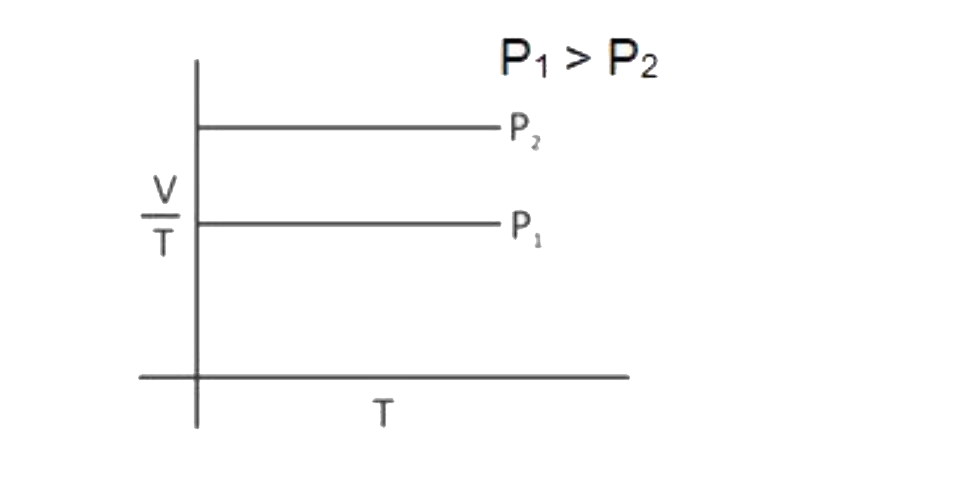
- Graph D: VT vs. Temperature
- This graph should show a linear relationship since V is directly proportional to T. If pressure is constant, this graph is also consistent with ideal gas behavior.
3. Conclusion:
- After analyzing all the graphs, we find that Graph C (Pressure vs. Volume) is inconsistent with ideal gas behavior when considering the relationships derived from the ideal gas law. This graph should not show a linear relationship under varying temperatures.
Final Answer:
The graph that is inconsistent with ideal gas behavior is Graph C (Pressure vs. Volume).
- P = pressure
- V = volume
- n = number of moles (constant)
- R = ideal gas constant
- T = temperature
- From the ideal gas law, we can derive several relationships:
- P∝1V (at constant T)
- V∝T (at constant P)
- P∝T (at constant V)
- Graph A: Pressure vs. 1V
- Since P is directly proportional to 1V, this graph should show a linear relationship. If temperature increases, the slope will increase. This is consistent with ideal gas behavior.
- Graph B: Volume vs. Temperature
- Since V is directly proportional to T at constant pressure, this graph should also show a linear relationship. If pressure increases, the graph will shift upwards. This is consistent with ideal gas behavior.
- Here, P is inversely proportional to V (Boyle's Law). If temperature increases, the graph should show that for a given temperature, as volume increases, pressure decreases. If T2 is greater than T1, the graph should shift upwards. This is consistent with ideal gas behavior.
- This graph should show a linear relationship since V is directly proportional to T. If pressure is constant, this graph is also consistent with ideal gas behavior.
- After analyzing all the graphs, we find that Graph C (Pressure vs. Volume) is inconsistent with ideal gas behavior when considering the relationships derived from the ideal gas law. This graph should not show a linear relationship under varying temperatures.
The graph that is inconsistent with ideal gas behavior is Graph C (Pressure vs. Volume).
Similar Questions
Knowledge Check
Which of the following graphs represent the behaviour of an ideal gas ?
A1.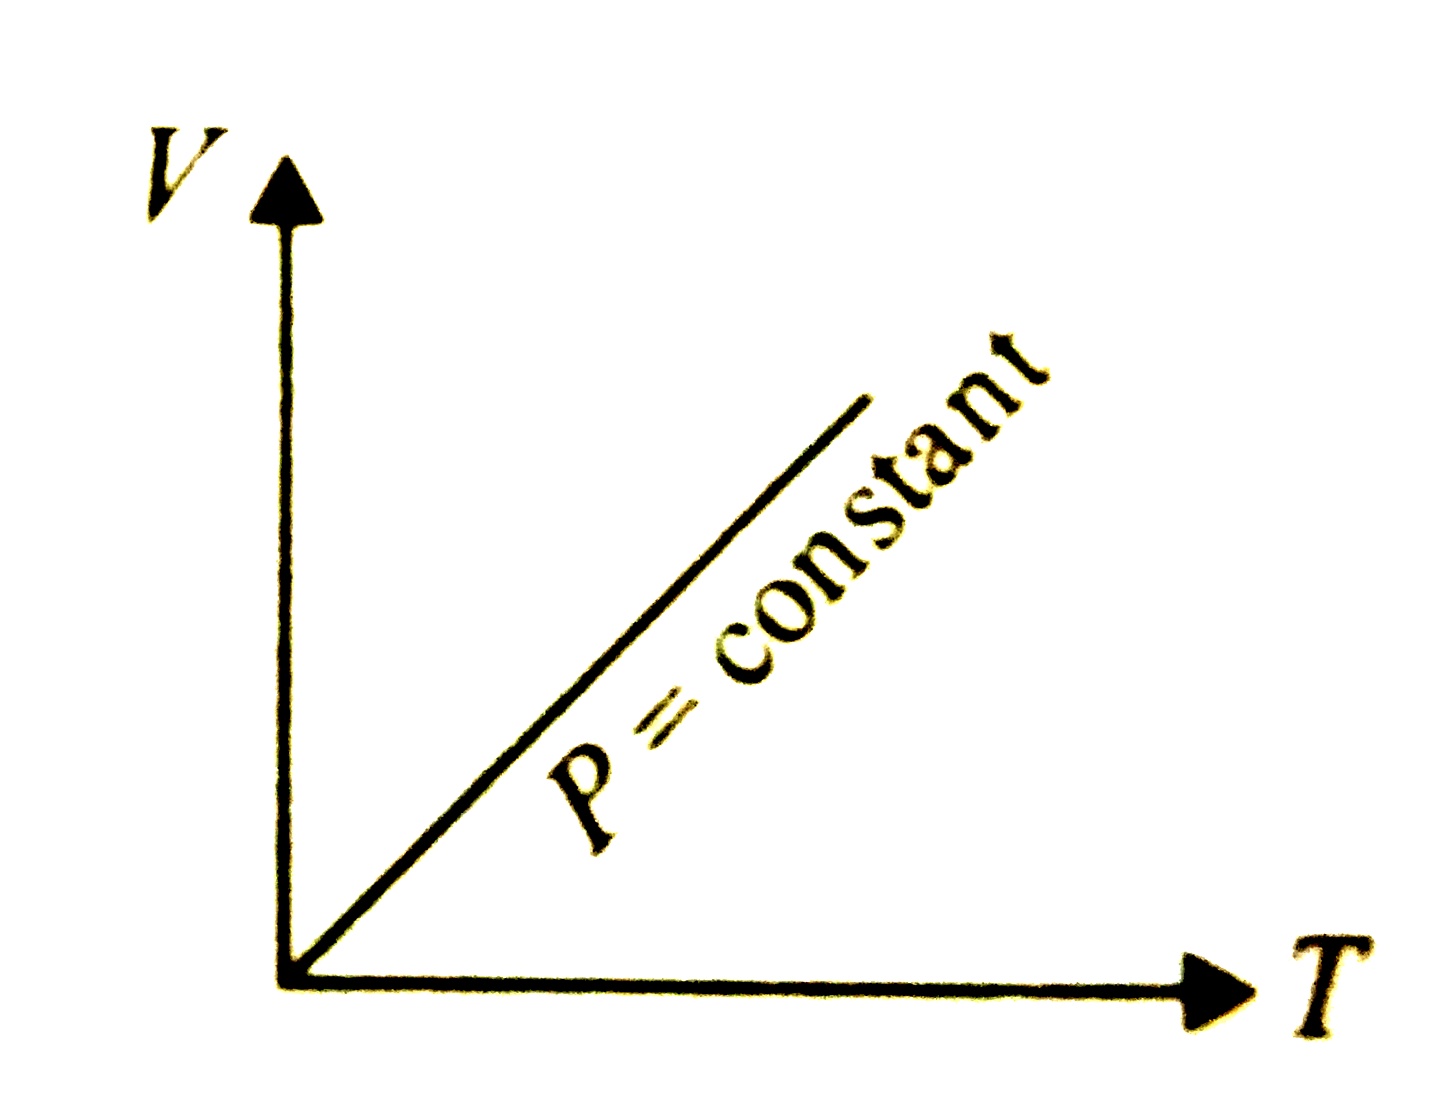 B2.
B2.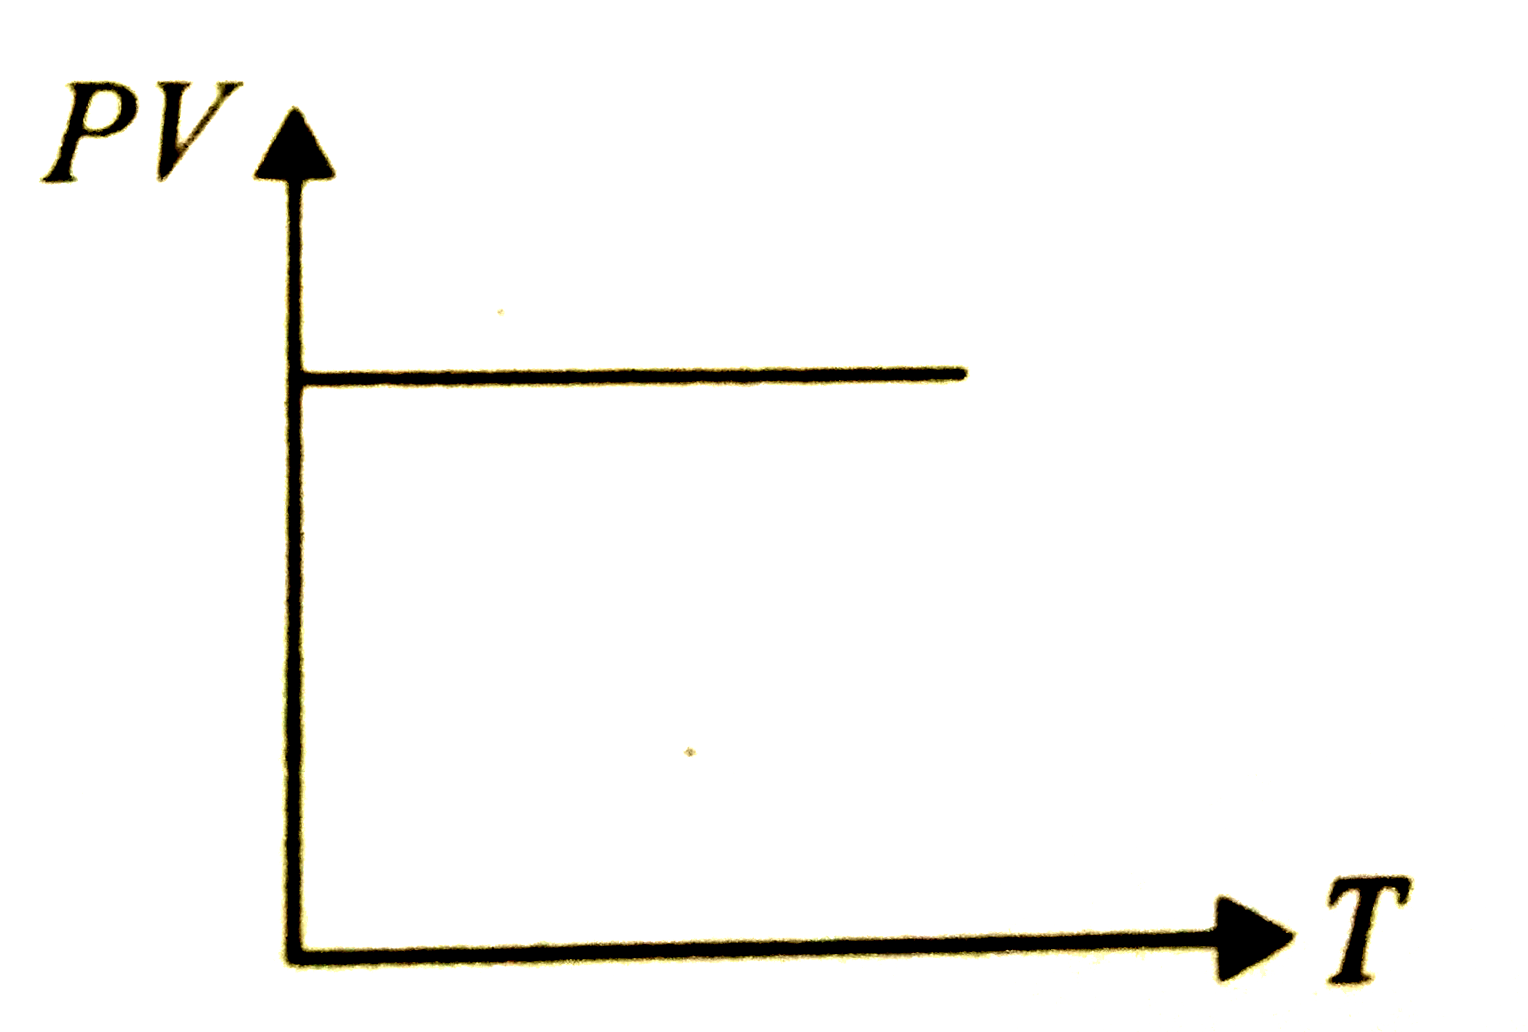 C3.
C3.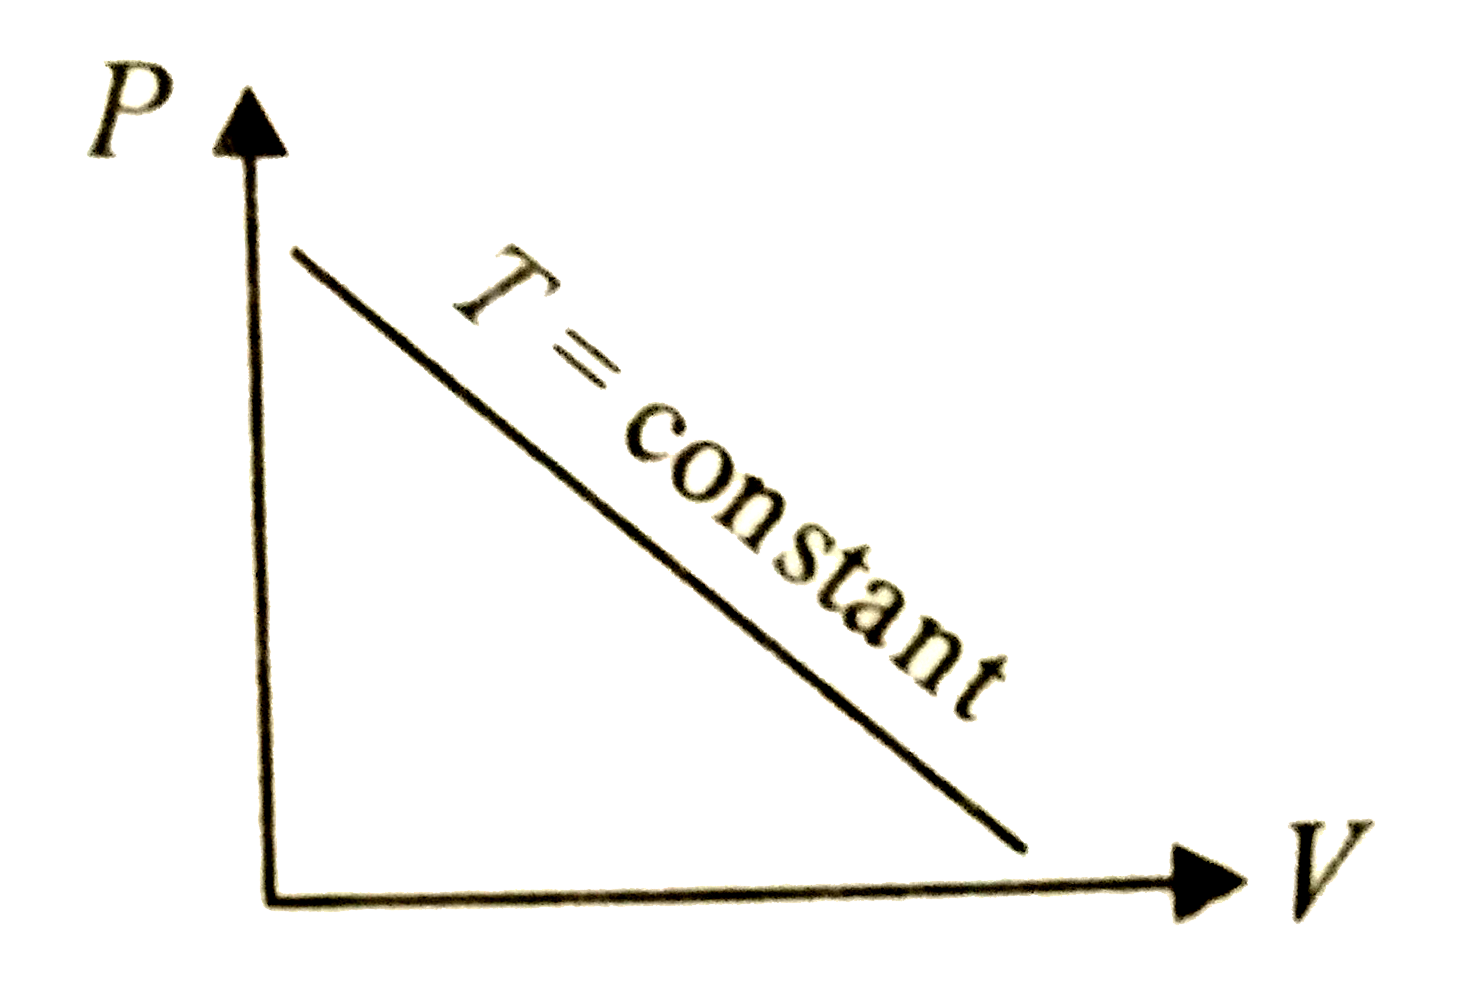 D4.
D4.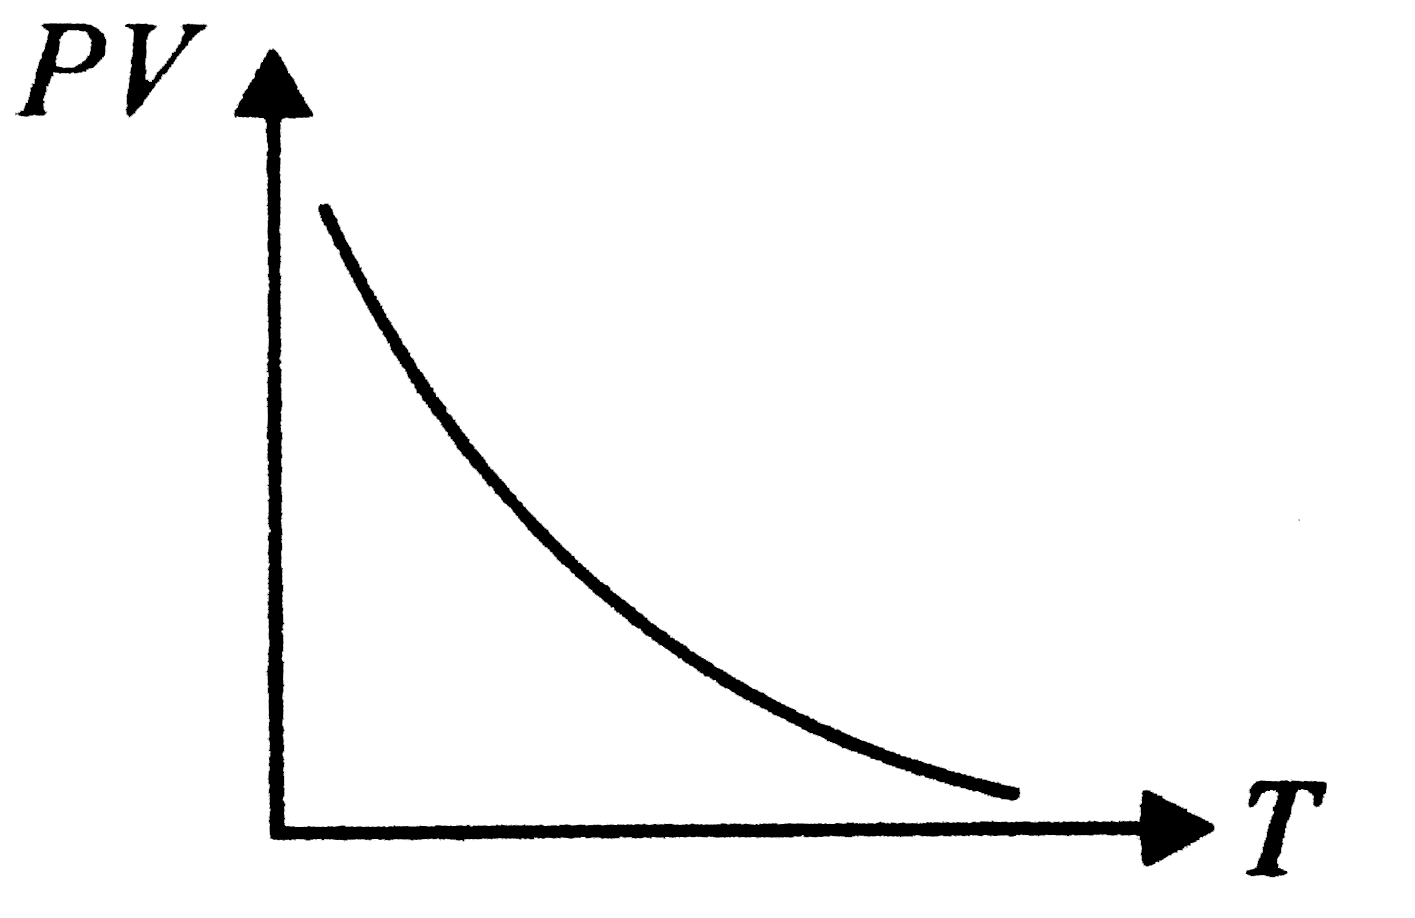
Which of the following diagrams (figure) depicts ideal gas behaviour?
View SolutionWhich of the following graphs show most significant deviation from ideal gas behaviour ?
View SolutionWhich of the following gas always shows positive deviation from ideal gas behaviour ?
View SolutionWhich of the following graph does not belong to isothermal process for an ideal gas?
View SolutionWhich of the following statements is/are correct with respect to behaviour of real gas.
View Solutionwhich one of the following graph is not correct for ideal gas ?
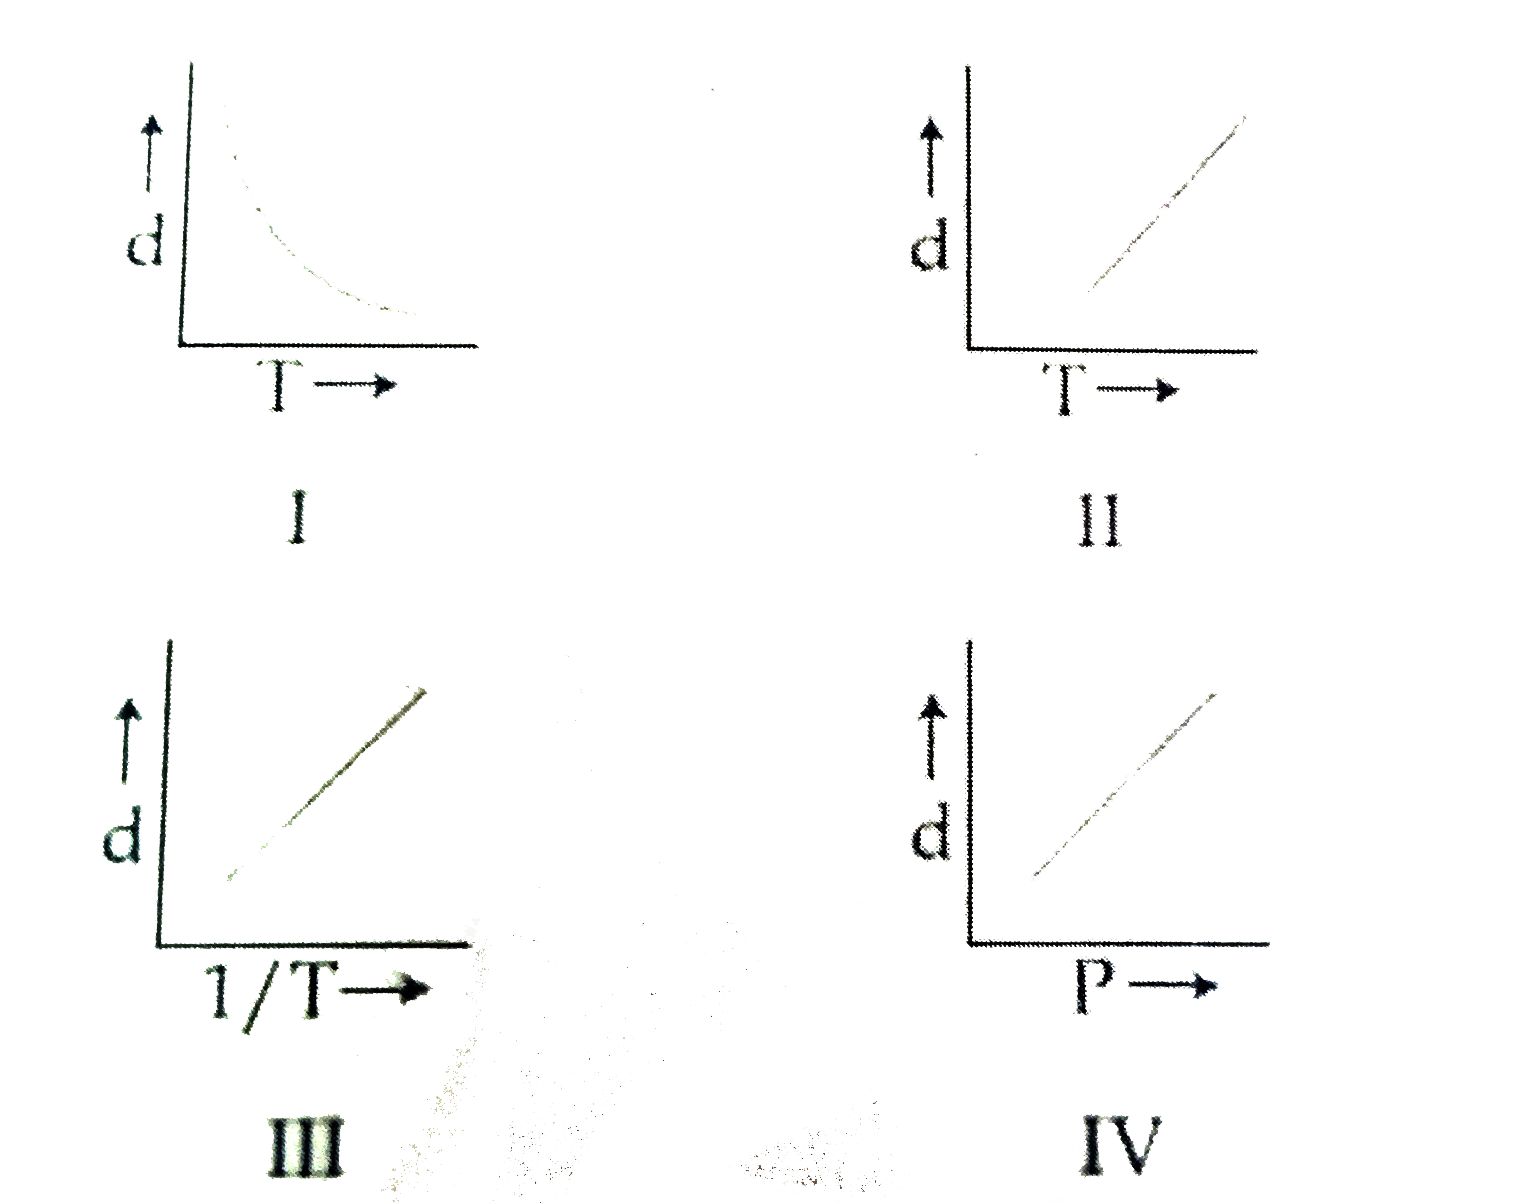
d=density ,P=pressure,T=Temperature
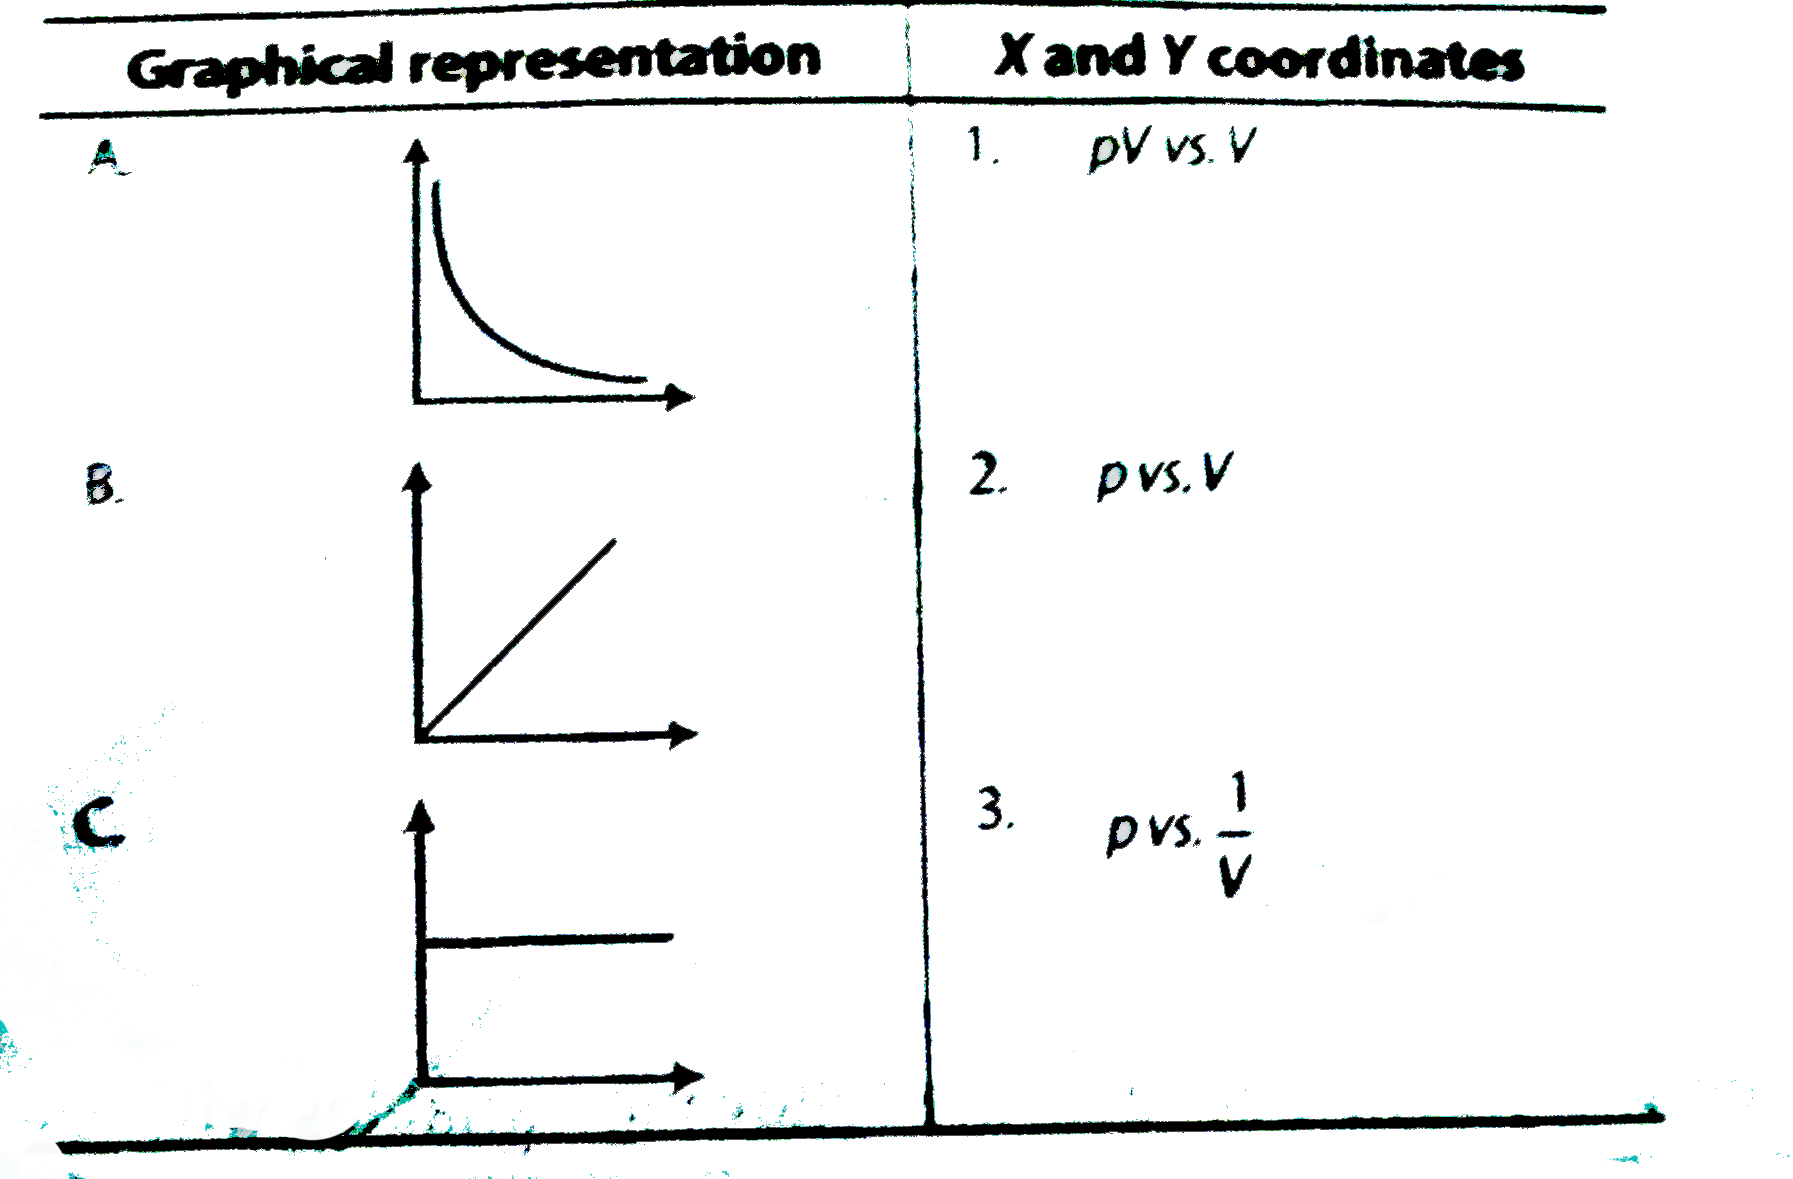
View SolutionMatch the following graphs of ideal gas with their coordinates.
View Solution

