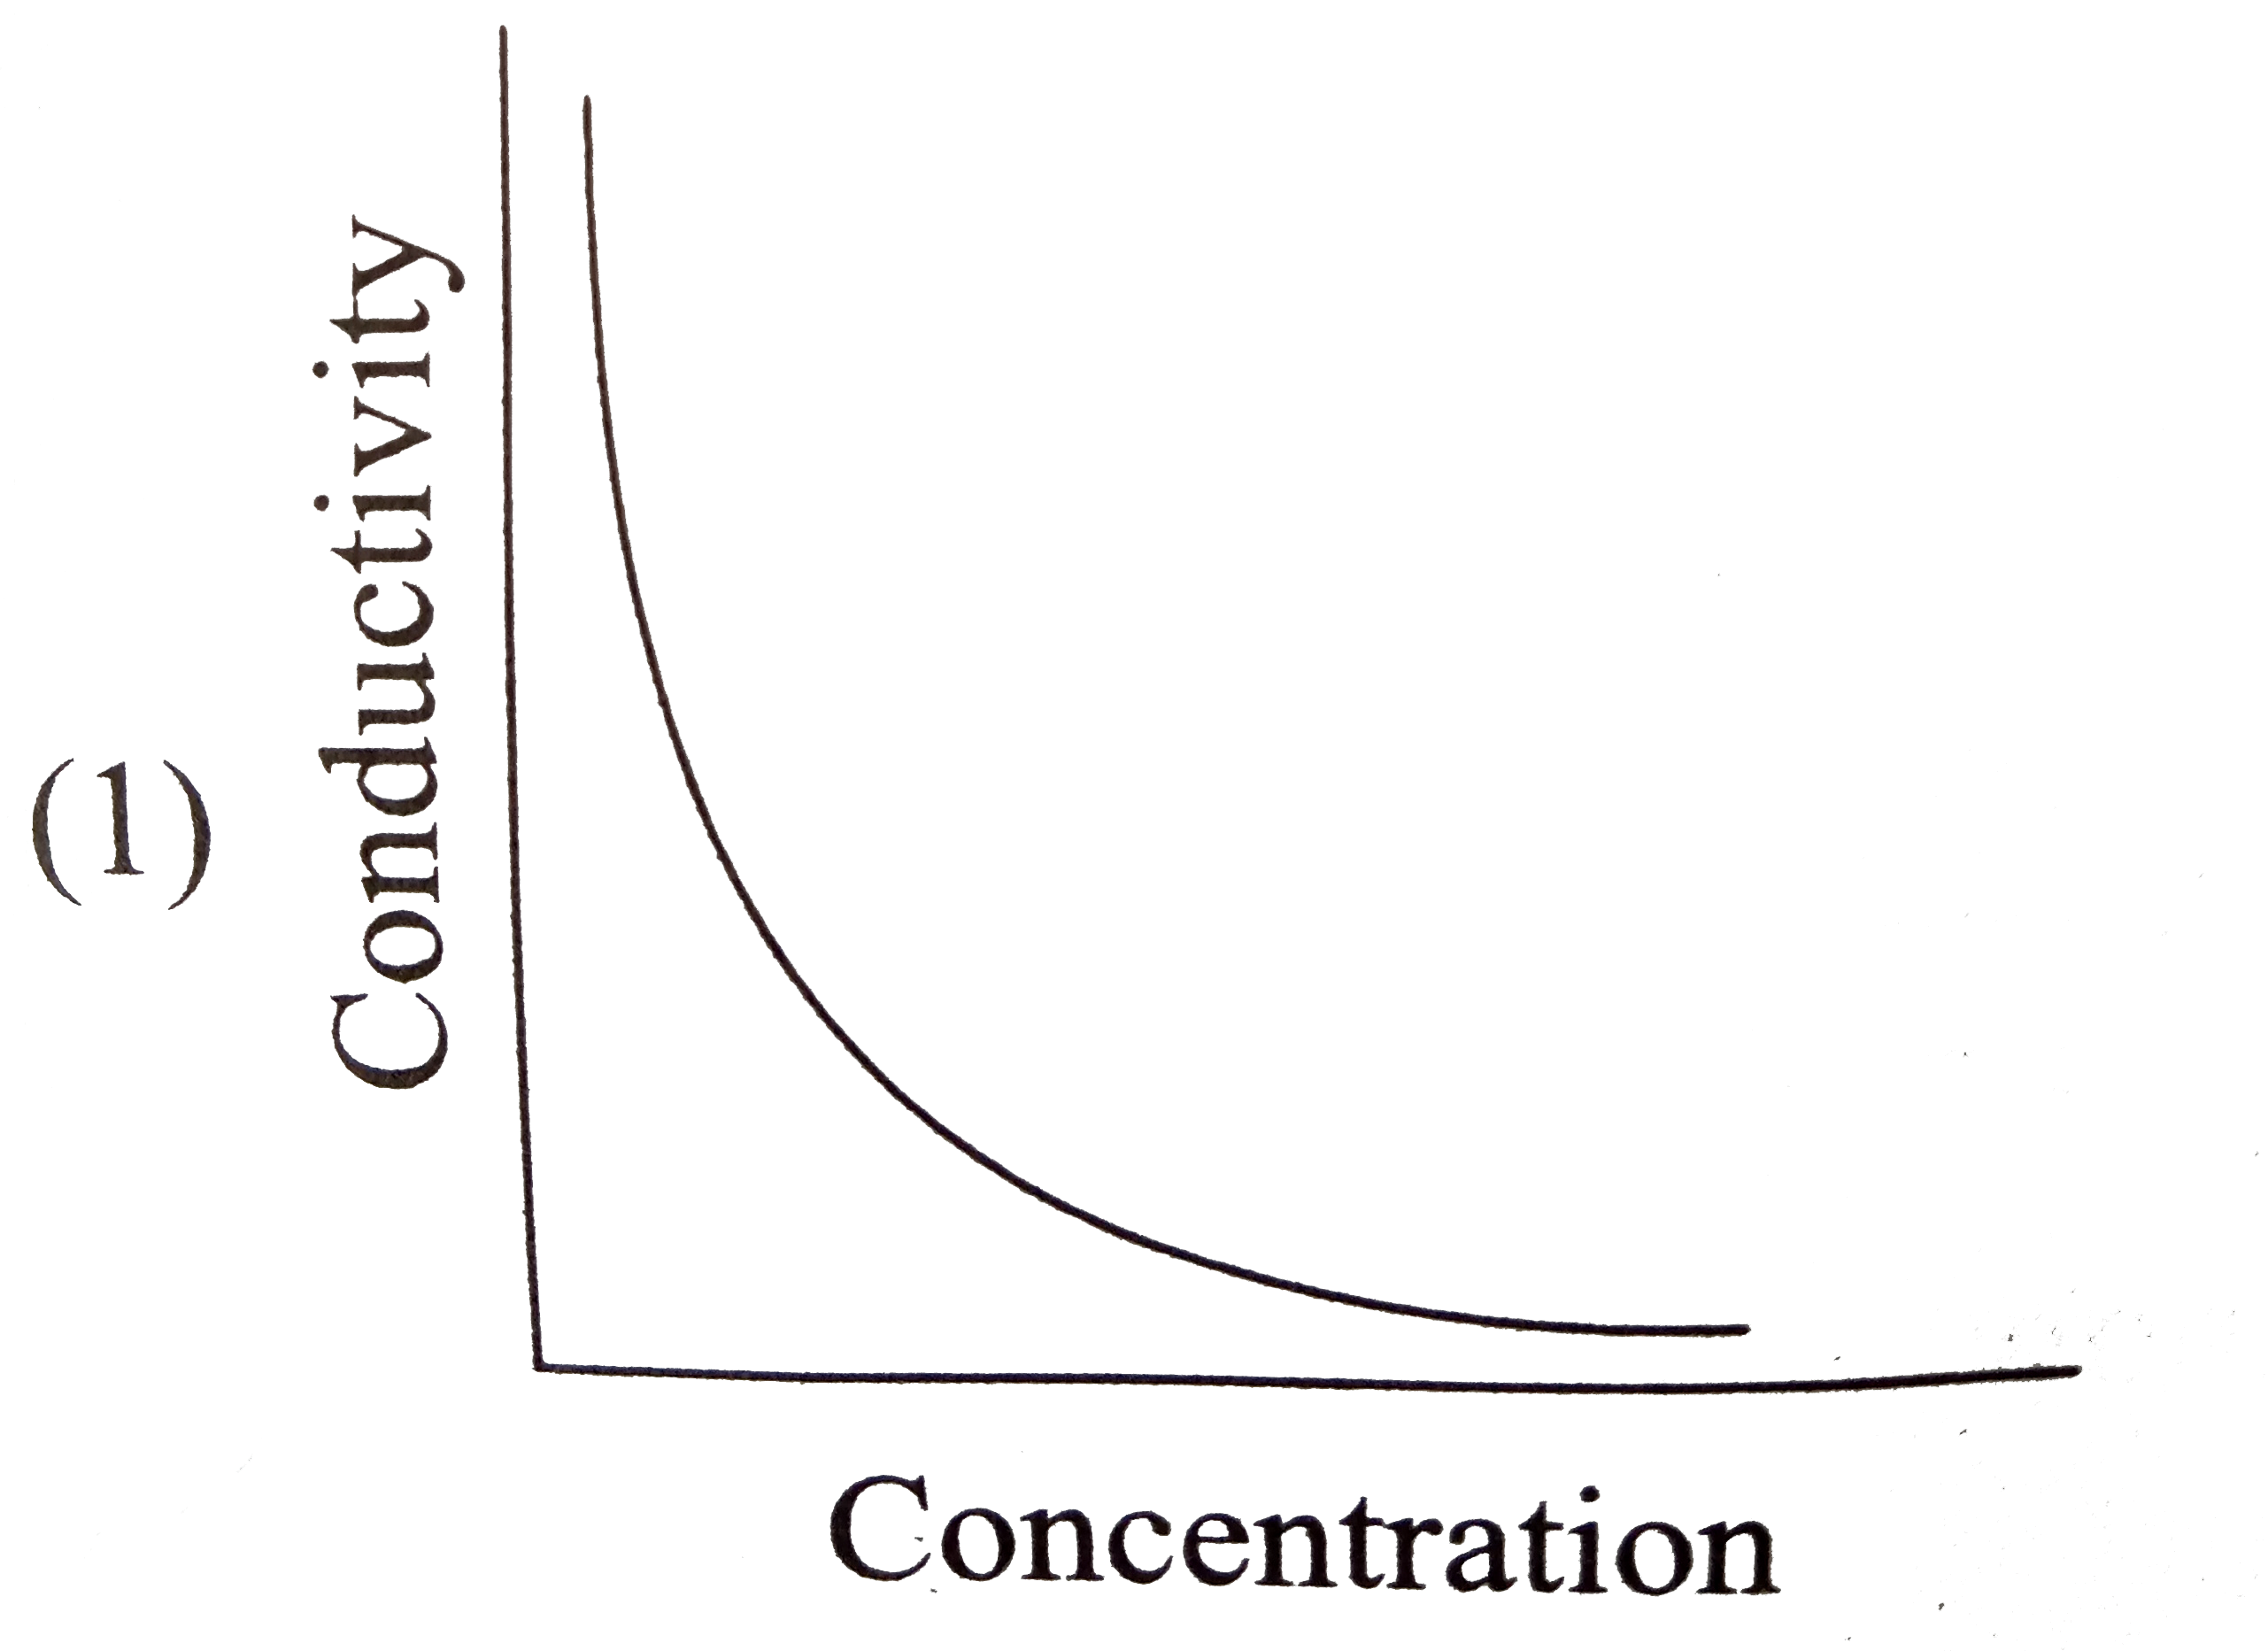
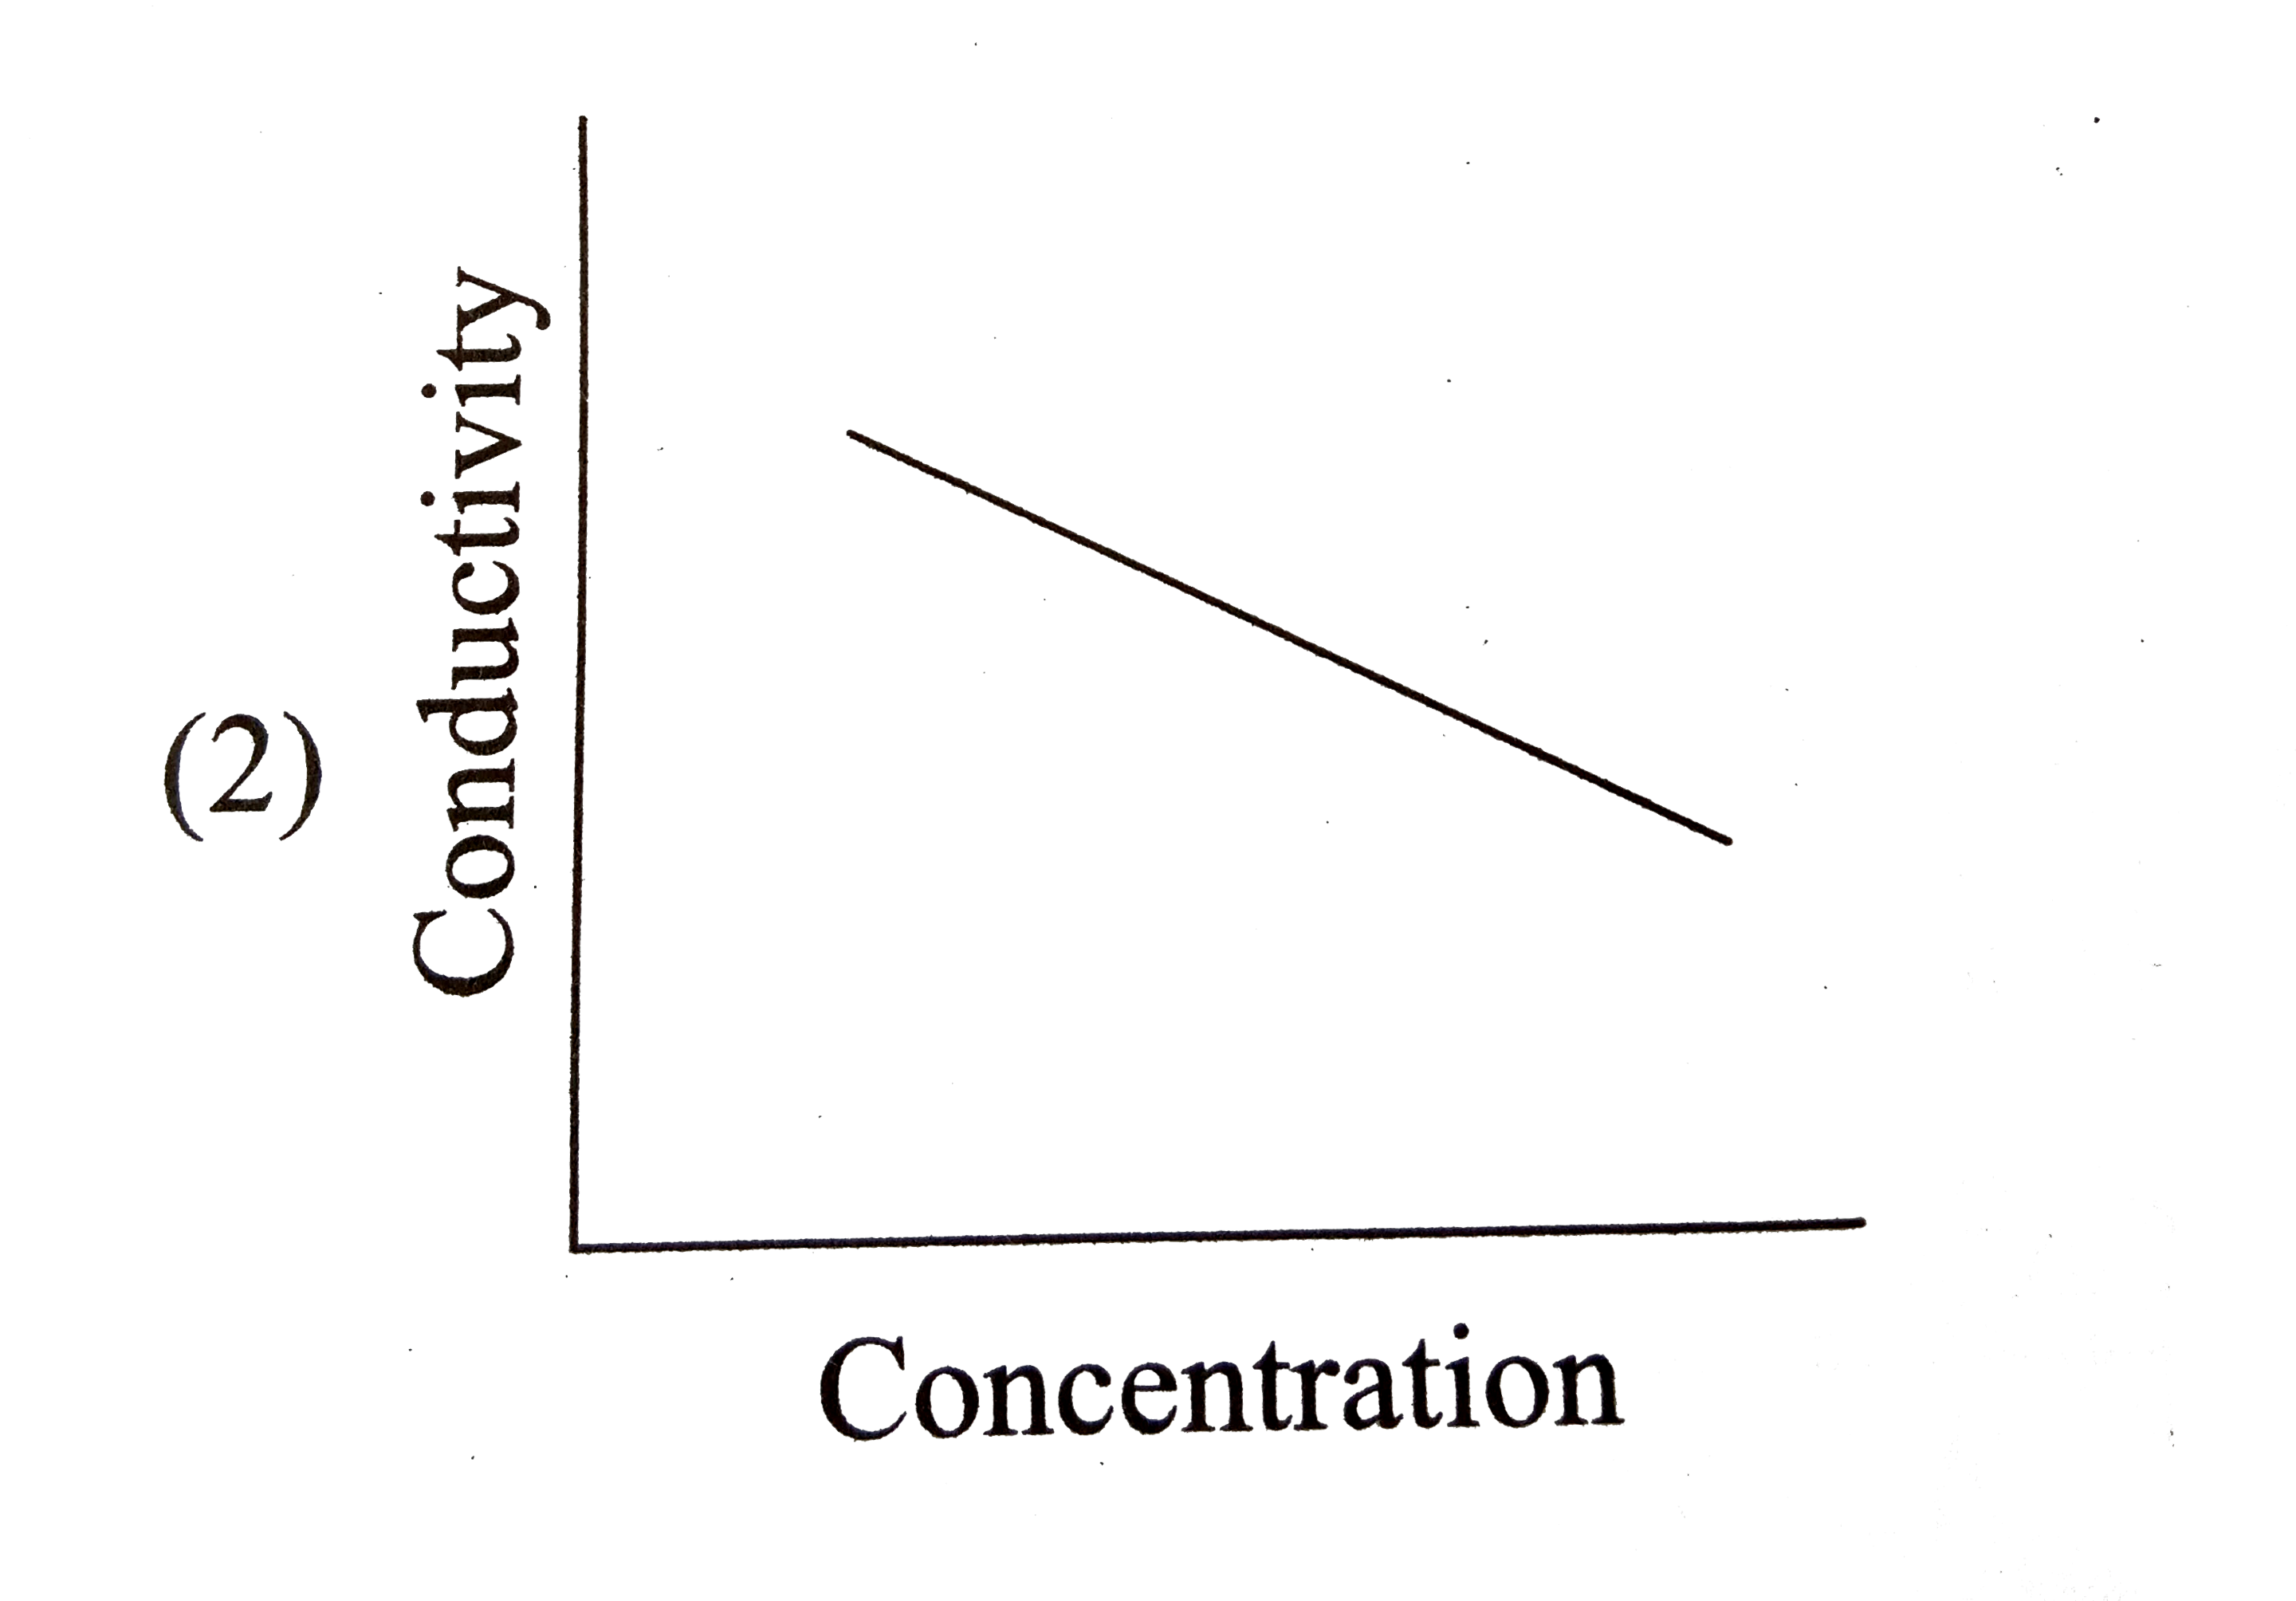
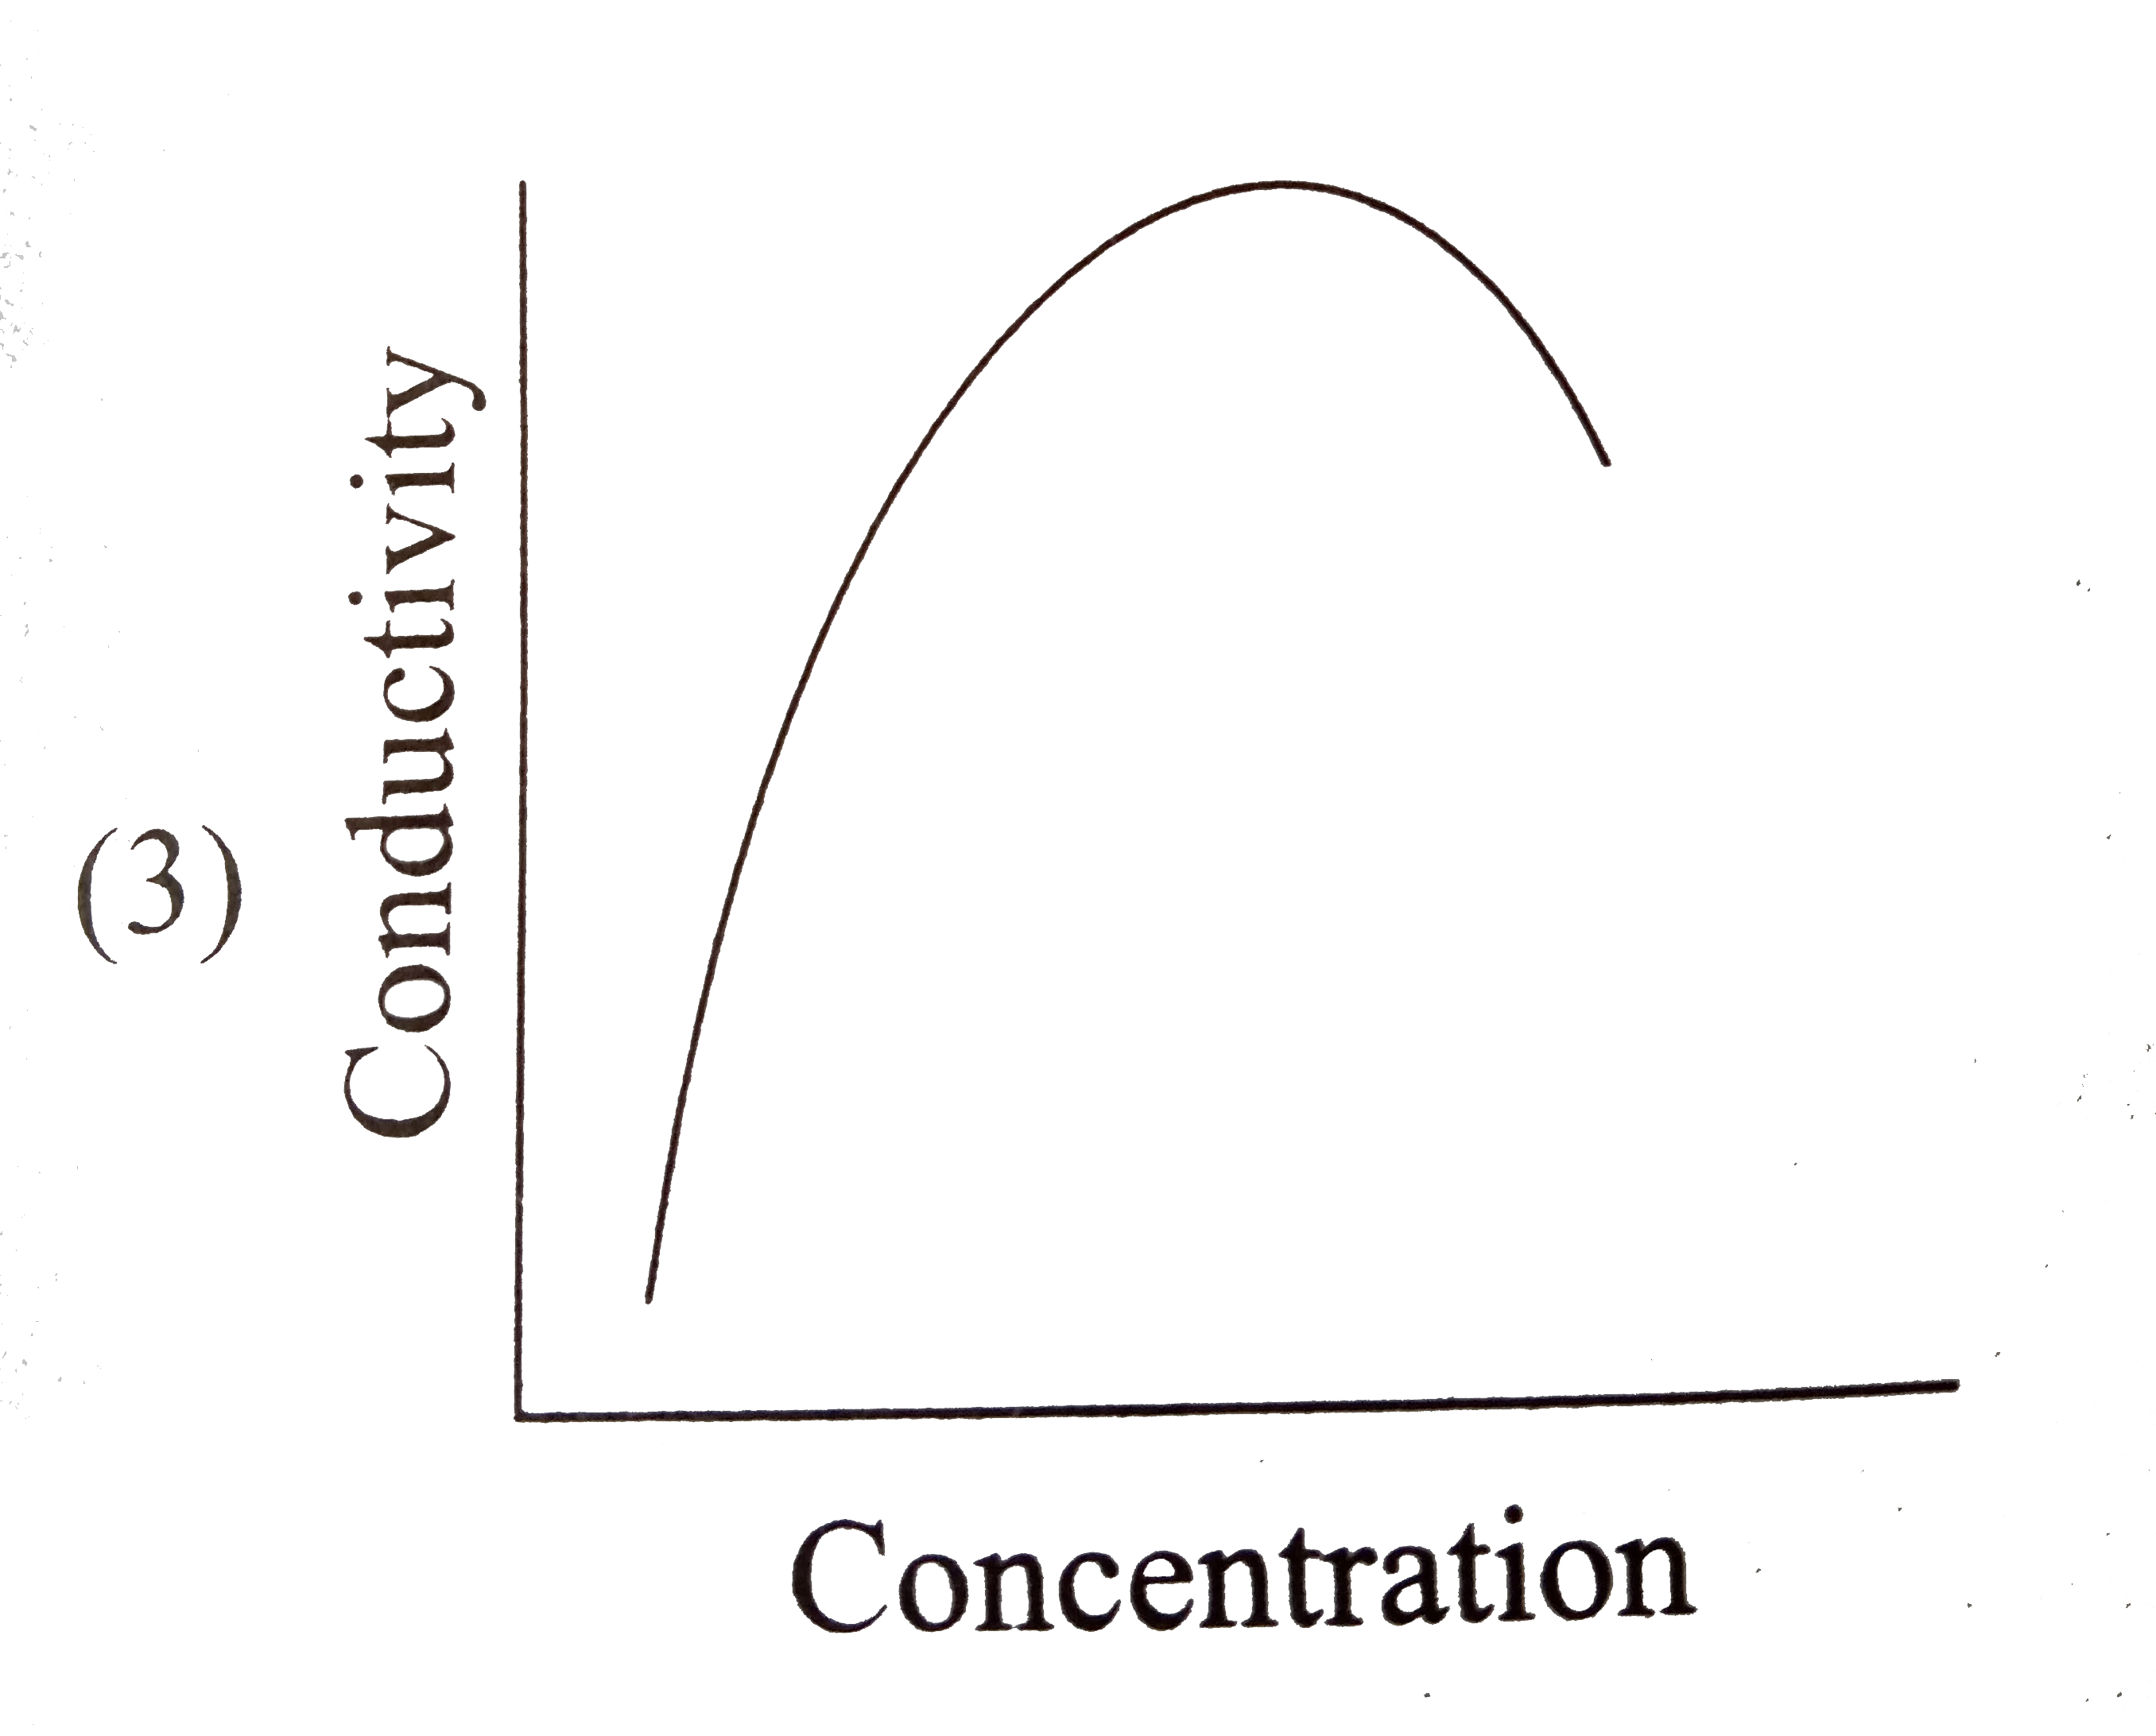
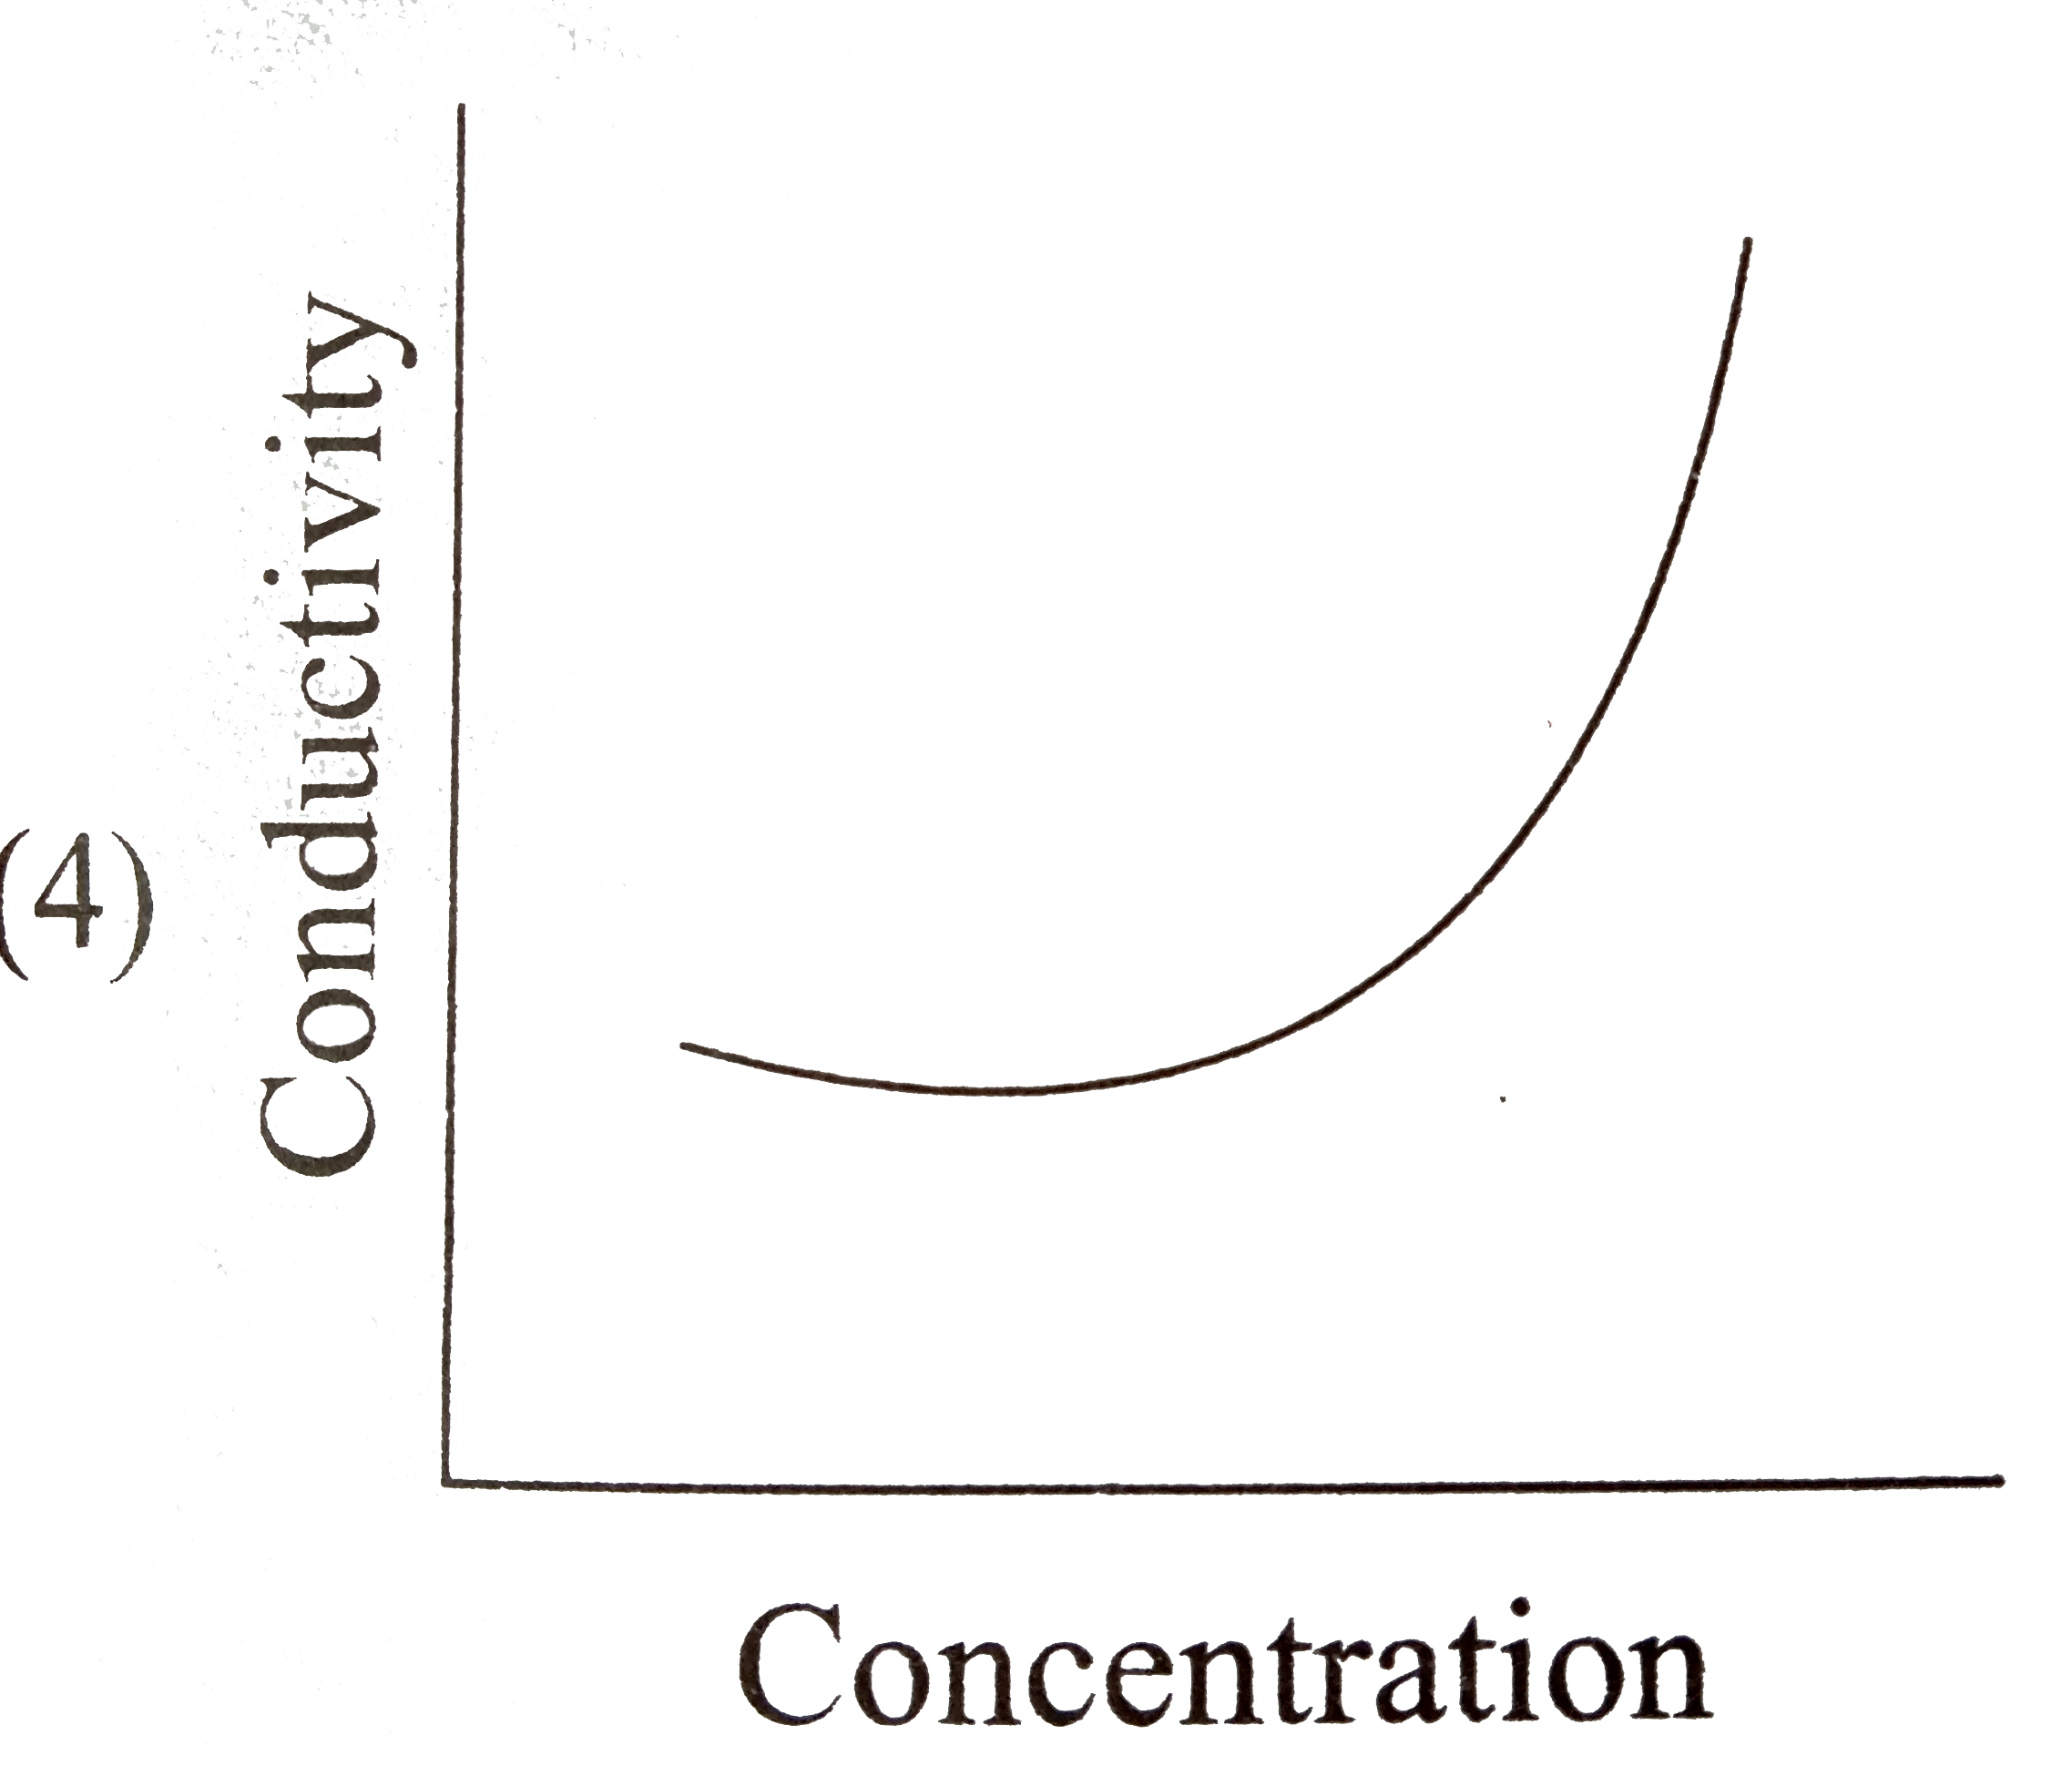
Which of the following plots represents correctly the variation of conductivity with concentration?
A
B
C
D
Video Solution
Text Solution
The correct Answer is:C
This is the general shape of the a conductivity-con-centration curve for both weak and stron electrolytes. The curves for both types of electrolytes show oa maximum, is only obtained when a wide range of concentrations is possible. In many cases, a sturateed solution is obtained before the maximum is reached so that only the left hand part of the curve is obtainable.
As a solution gets more and more concentrated there are more and more solute particles in a given volume of the solution. Because it is the solute that causes electrical conductivity [pure water and other solvents are very poor conductors) it might on this account, be expected, that conductivity and, at first, for dilute soltutions, it does so.
However, at higher concentrations the conductivity reaches a maximum and then begins to fall, and some factor other than the increase in the number of solute particles on increasing concentration must enter in.
For a weak electrolyte, this factor is the degree of ionization which decreases as the concentration increases. The maximum in the curve is due to the composite effect of an increases in the total number of ionization. For a strong electrolytes, the other factor is the increase in ionic interference (decrease in ionic freedom) as the concentration increases. A strong electrolyte is fully, or almost fully, inoized at all concentrations. However, at high concentrations the inos will interface with each other so that their freedom of movement and their speed are restricted.
As a solution gets more concentrated, the ionic interference increases and the ionic speed decreases. Thus, for a strong electrolyte, increasing concentration gived more ions, in a fixed volume of solution, but the ions that are present inter-fere with each other, which gives lower ionic speeds.
|
Topper's Solved these Questions
- ELECTROCHEMISTRYBOOK - R SHARMACHAPTER - ELECTROCHEMISTRYEXERCISE - Follow-up Test 8
20 Videos
- ELECTROCHEMISTRYBOOK - R SHARMACHAPTER - ELECTROCHEMISTRYEXERCISE - Follow-up Test 9
11 Videos
- ELECTROCHEMISTRYBOOK - R SHARMACHAPTER - ELECTROCHEMISTRYEXERCISE - Follow-up Test 6
12 Videos
- COORDINATION COMPOUNDSBOOK - R SHARMACHAPTER - COORDINATION COMPOUNDSEXERCISE - Archives
56 Videos
- GENERAL PRINCIPALS AND ISOLATION OF ELEMENTSBOOK - R SHARMACHAPTER - GENERAL PRINCIPALS AND ISOLATION OF ELEMENTSEXERCISE - Arechives
16 Videos
Similar Questions
Knowledge Check
Which of the following plots represents correctly the variation of molar conductivity with dilution for a strong electrolyte?
A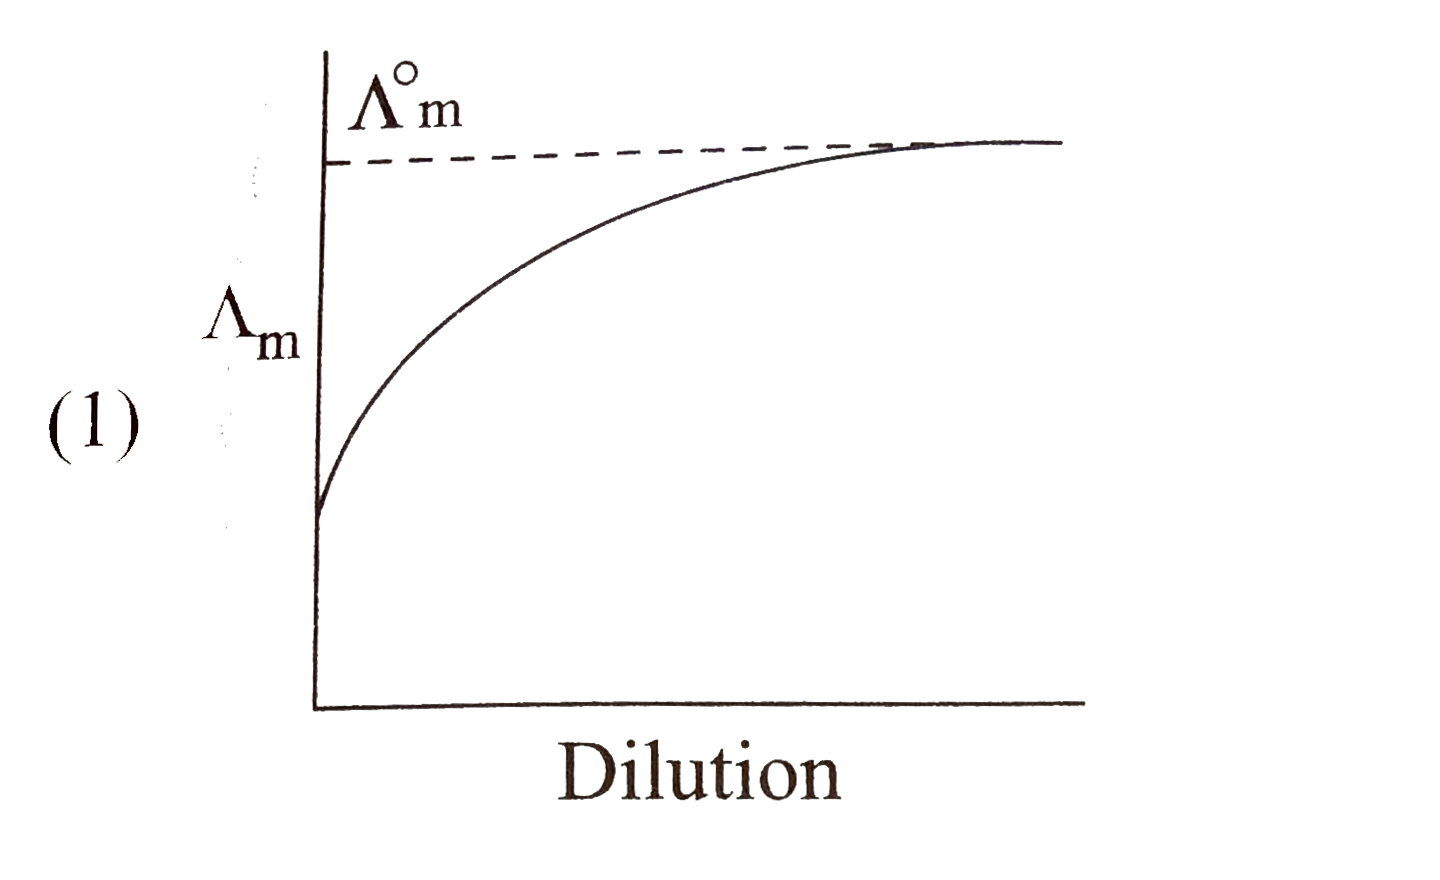 B
B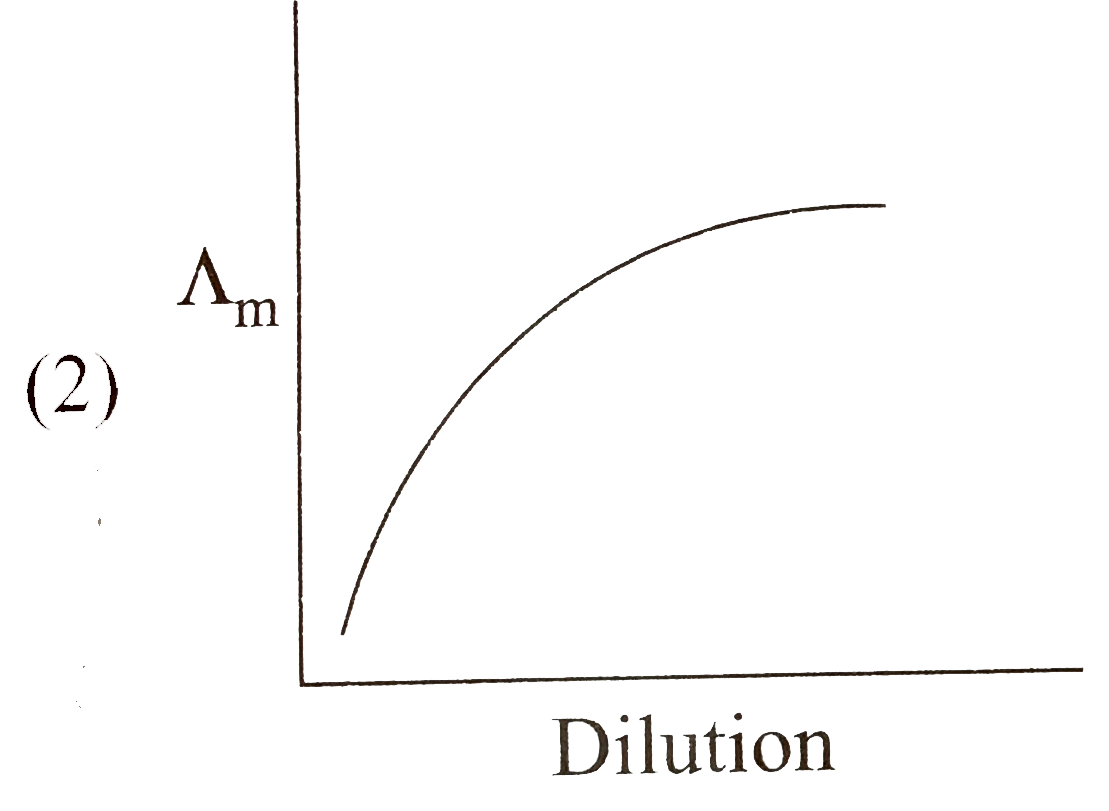 C
C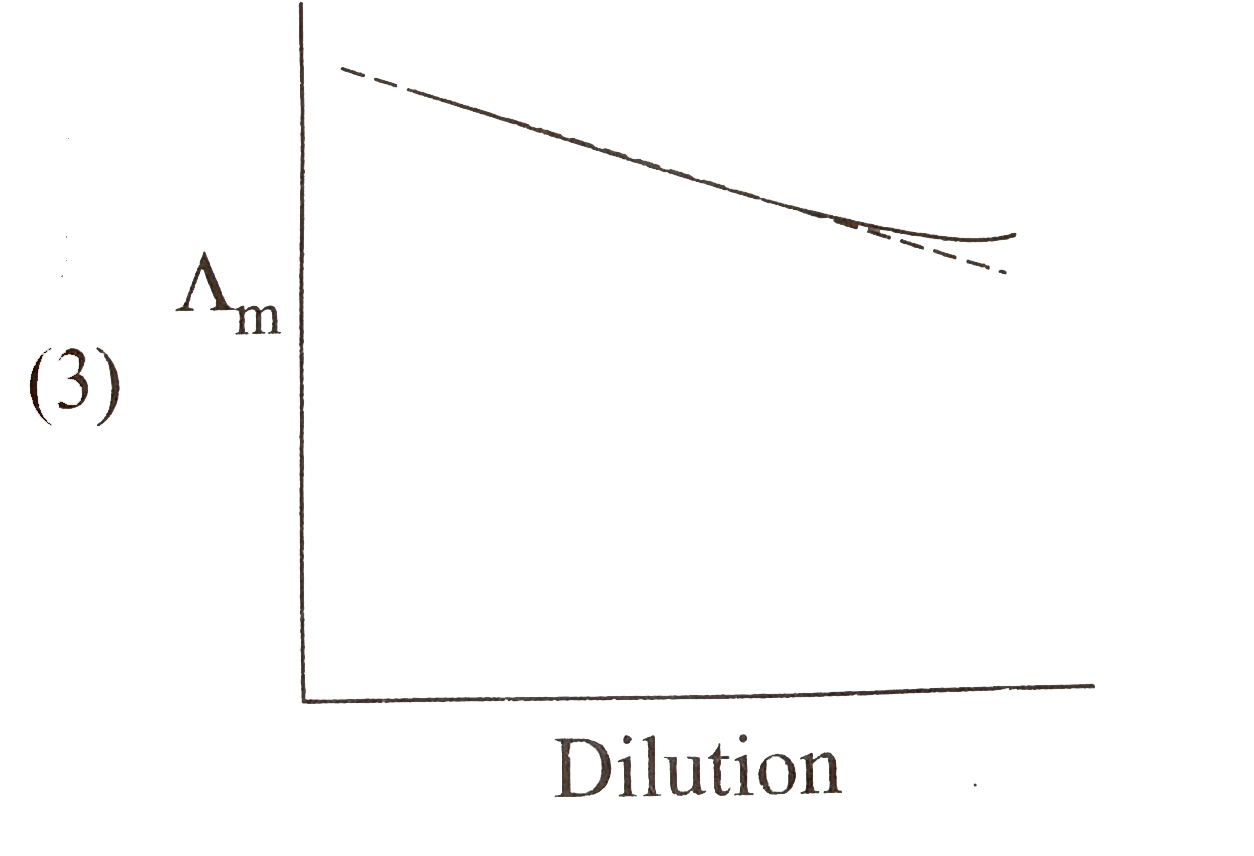 D
D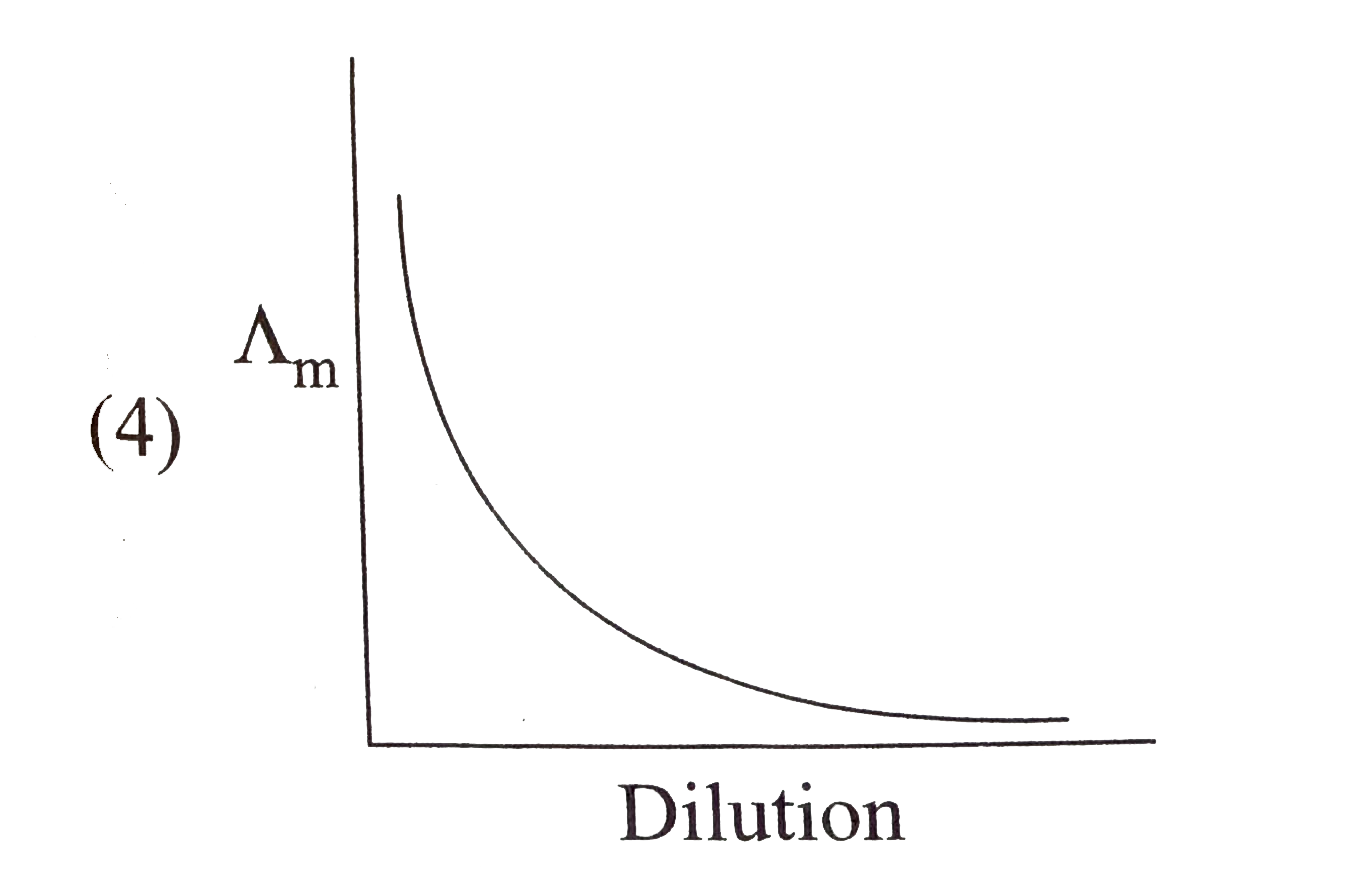
Which of the following plots represents an exothermic reaction?
A B
B C
C D
D
Which of the following plots represents an exothermic reaction?
A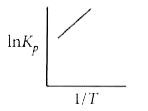 B
B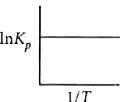 C
C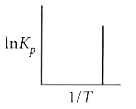 D
D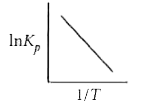
Which of the following plots represents correctly variation of equivalent conductance (Λ) with dilution for a strong electrolyte ?
View SolutionWhich one of the following represents correctly the variations of surface tension with temperature θ ?
View SolutionWhich of the following expression represents correctly the variation of density of an ideal gas with change in temperature ?
View SolutionWhich of the following graphs represents correctly the variations of 0.5mv2max with the intensity of incident radiations of a constant frequency ?
View SolutionA mass m is performing linear simple harmonic motion, then which of the following graph represents correctly the variation of acceleration a corresponding to linear velocity υ ?
View Solution
