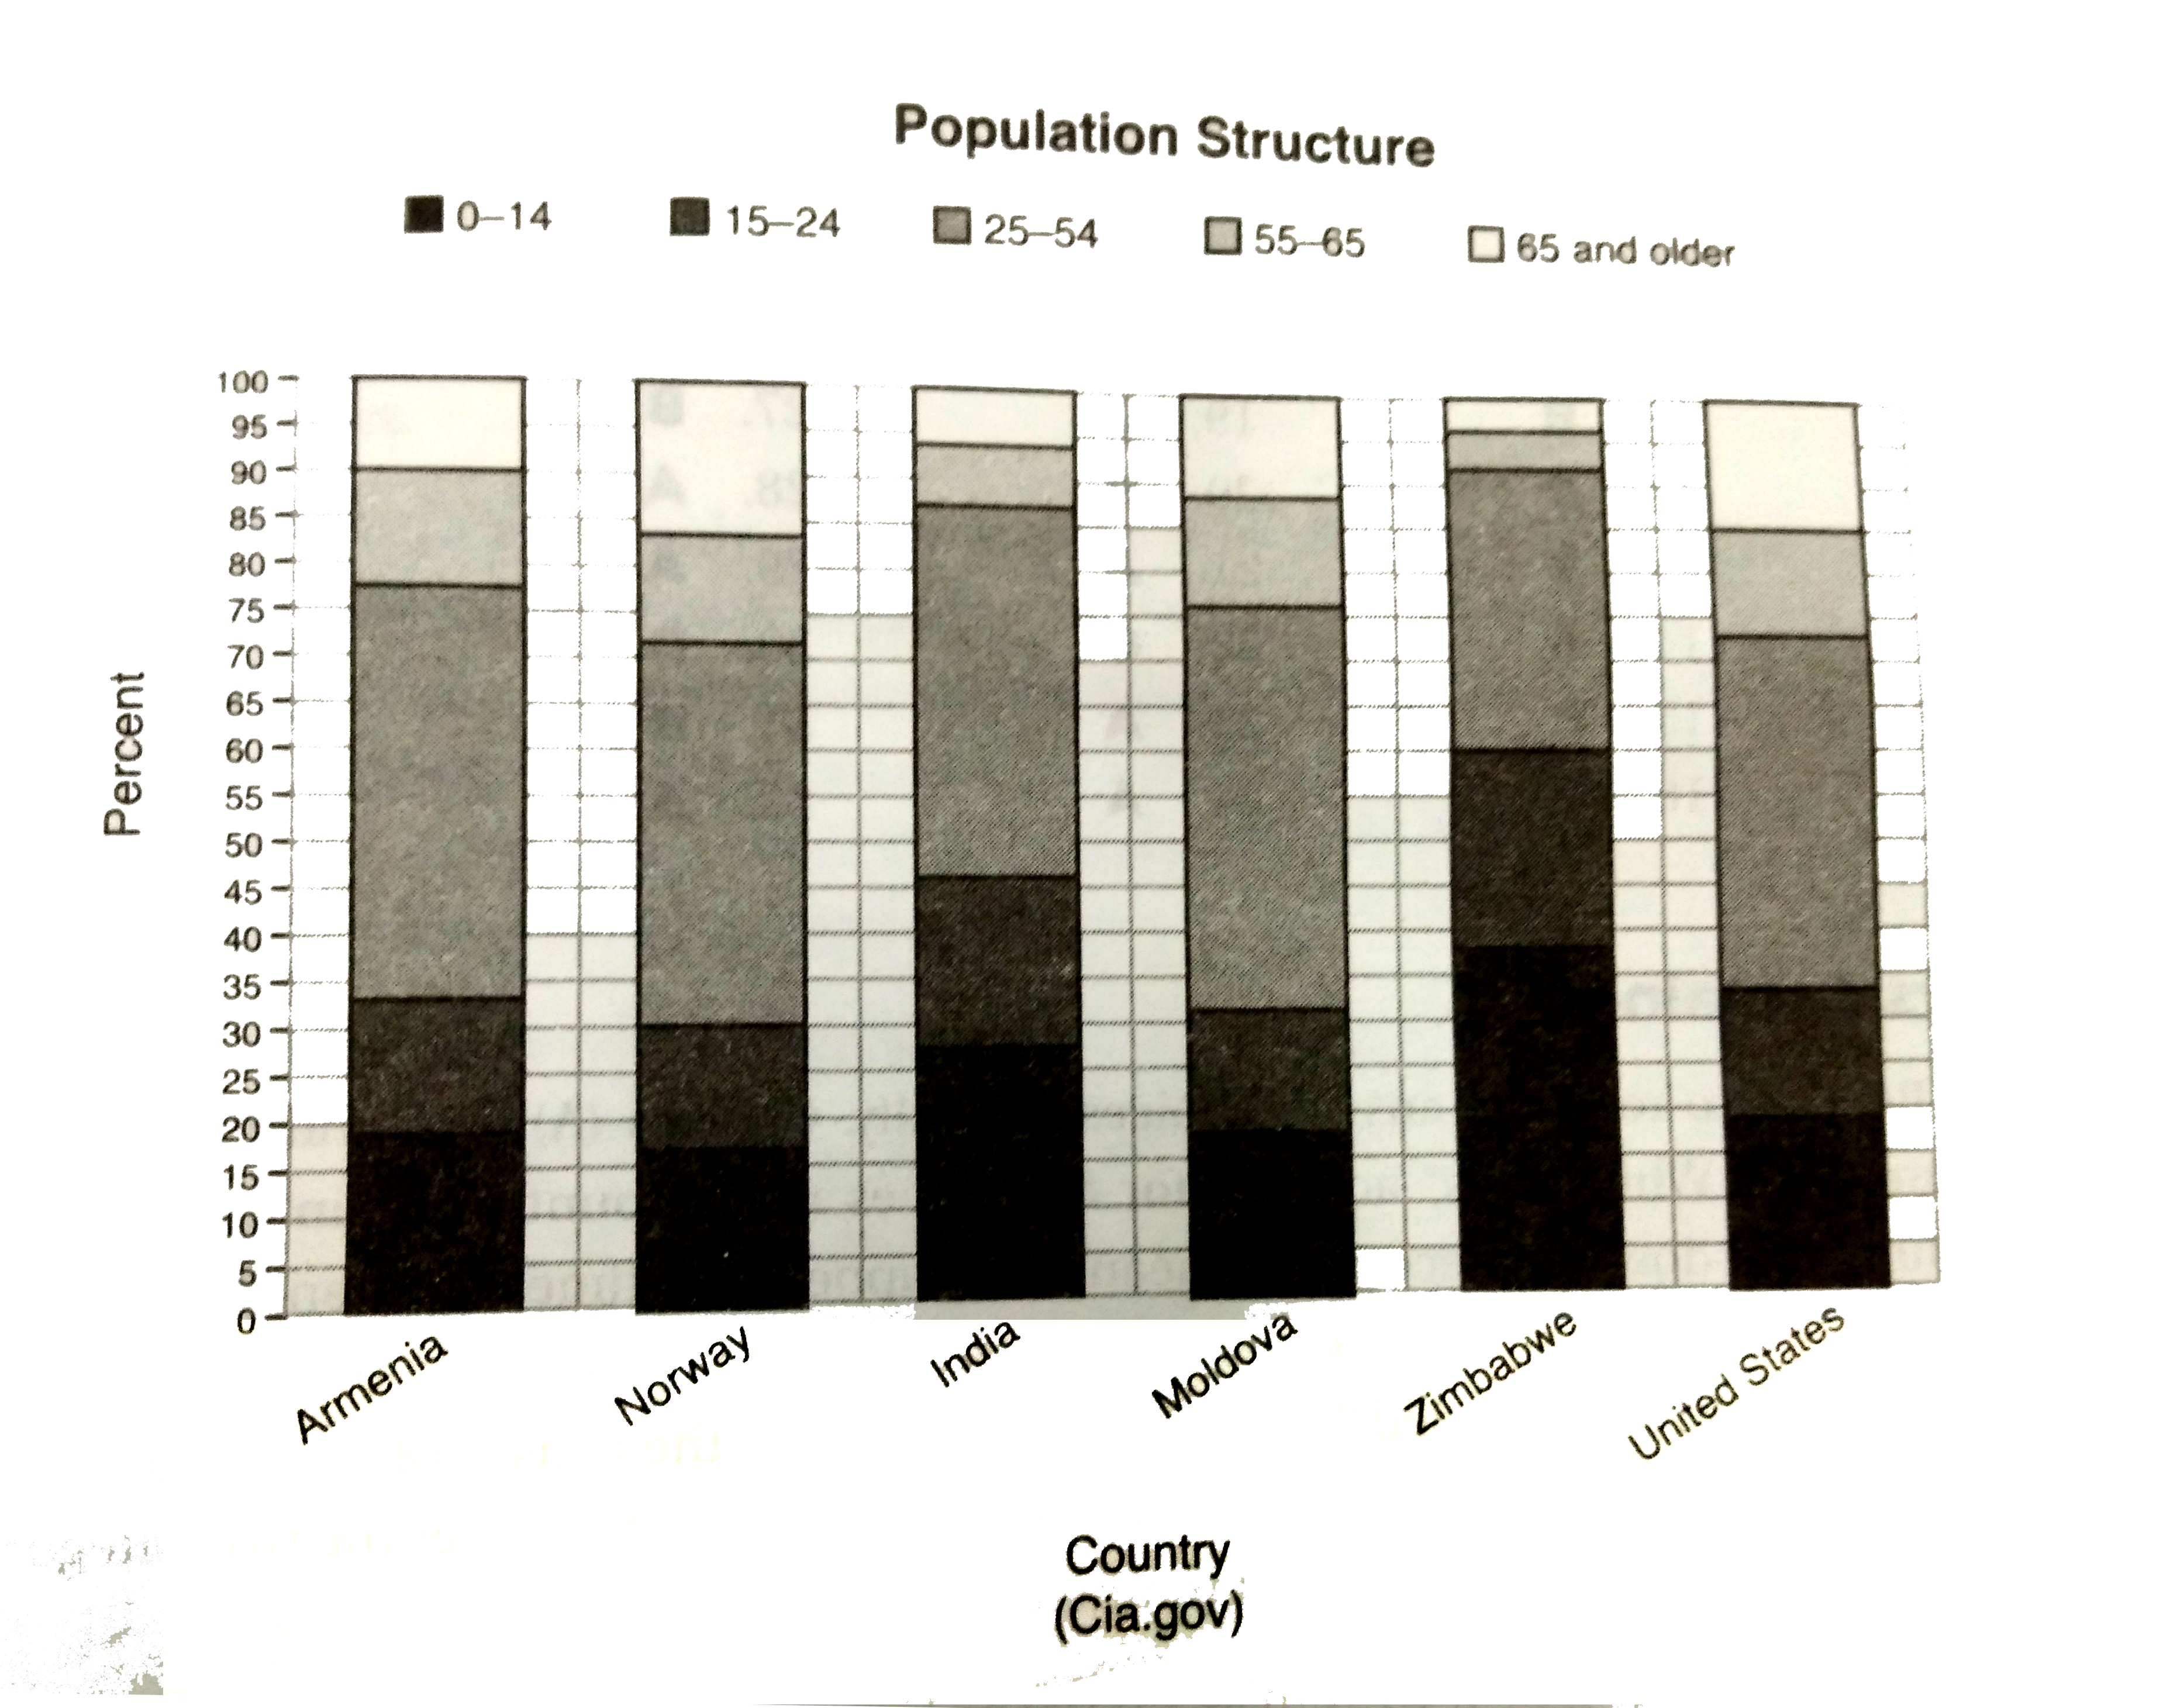
Which of the following is true based on the information in the graph?
A
Norway has the greatest percentage of prople age 65 and older.
B
Norway has the best healthcare for older adults.
C
Most Norwegians choose not to have children.
D
Norway will soon feel the economic effects of its low birth rate.
Text Solution
The correct Answer is:A
(A) The graph does not provide evidence on healthcare or birth rates, ruling out choices (B), (C ), and (D). Additionaly, we can confirm (A) be seeing that about 17% of the population is made up of those 65 and older. The only country close to this percentages is the United States with about 15% of the population being in this category.
|
Topper's Solved these Questions
Similar Questions
Knowledge Check
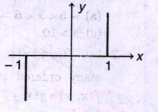
Which of the following is true about the given graph?
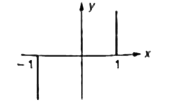 AA. x=|y|y,y≠0BB. y=|x|x,x≠0CC. x=−|y|y,y≠0DD. y=−|x|x,x≠0
Study the information given in each of these question to answer the questions
Study the graph and answer the question given below-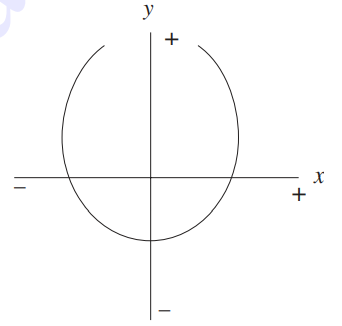
Which of the following is true about the value of x and y in the graph ?AWhen x is negative, y is also negativeBWhen x is positive, y is also negativeCFor each value of y, there are four corresponding values of xDNone of these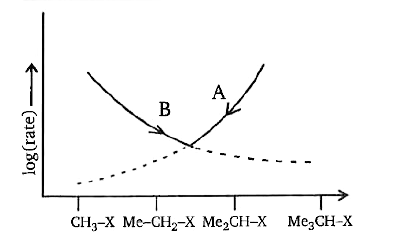
Which of the following is true about given graphs A and B ?AA→SN1 B→SN2BA→SN1 B→SN2CAandB→E1DAandB→E2
Which of the following are true for an acid- base titration?
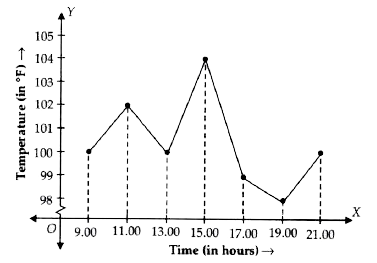
View SolutionObserve the graph and answer the following questions.
The information given by the graph is:
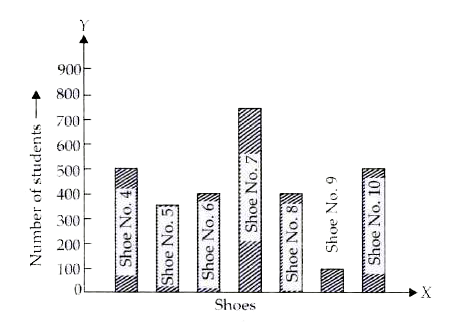
View SolutionRead the bar graph shown in figure and answer the following questions.
What is the information given by the bar graph?
View SolutionWhich of the following are true for an acid- base titration?
View Solution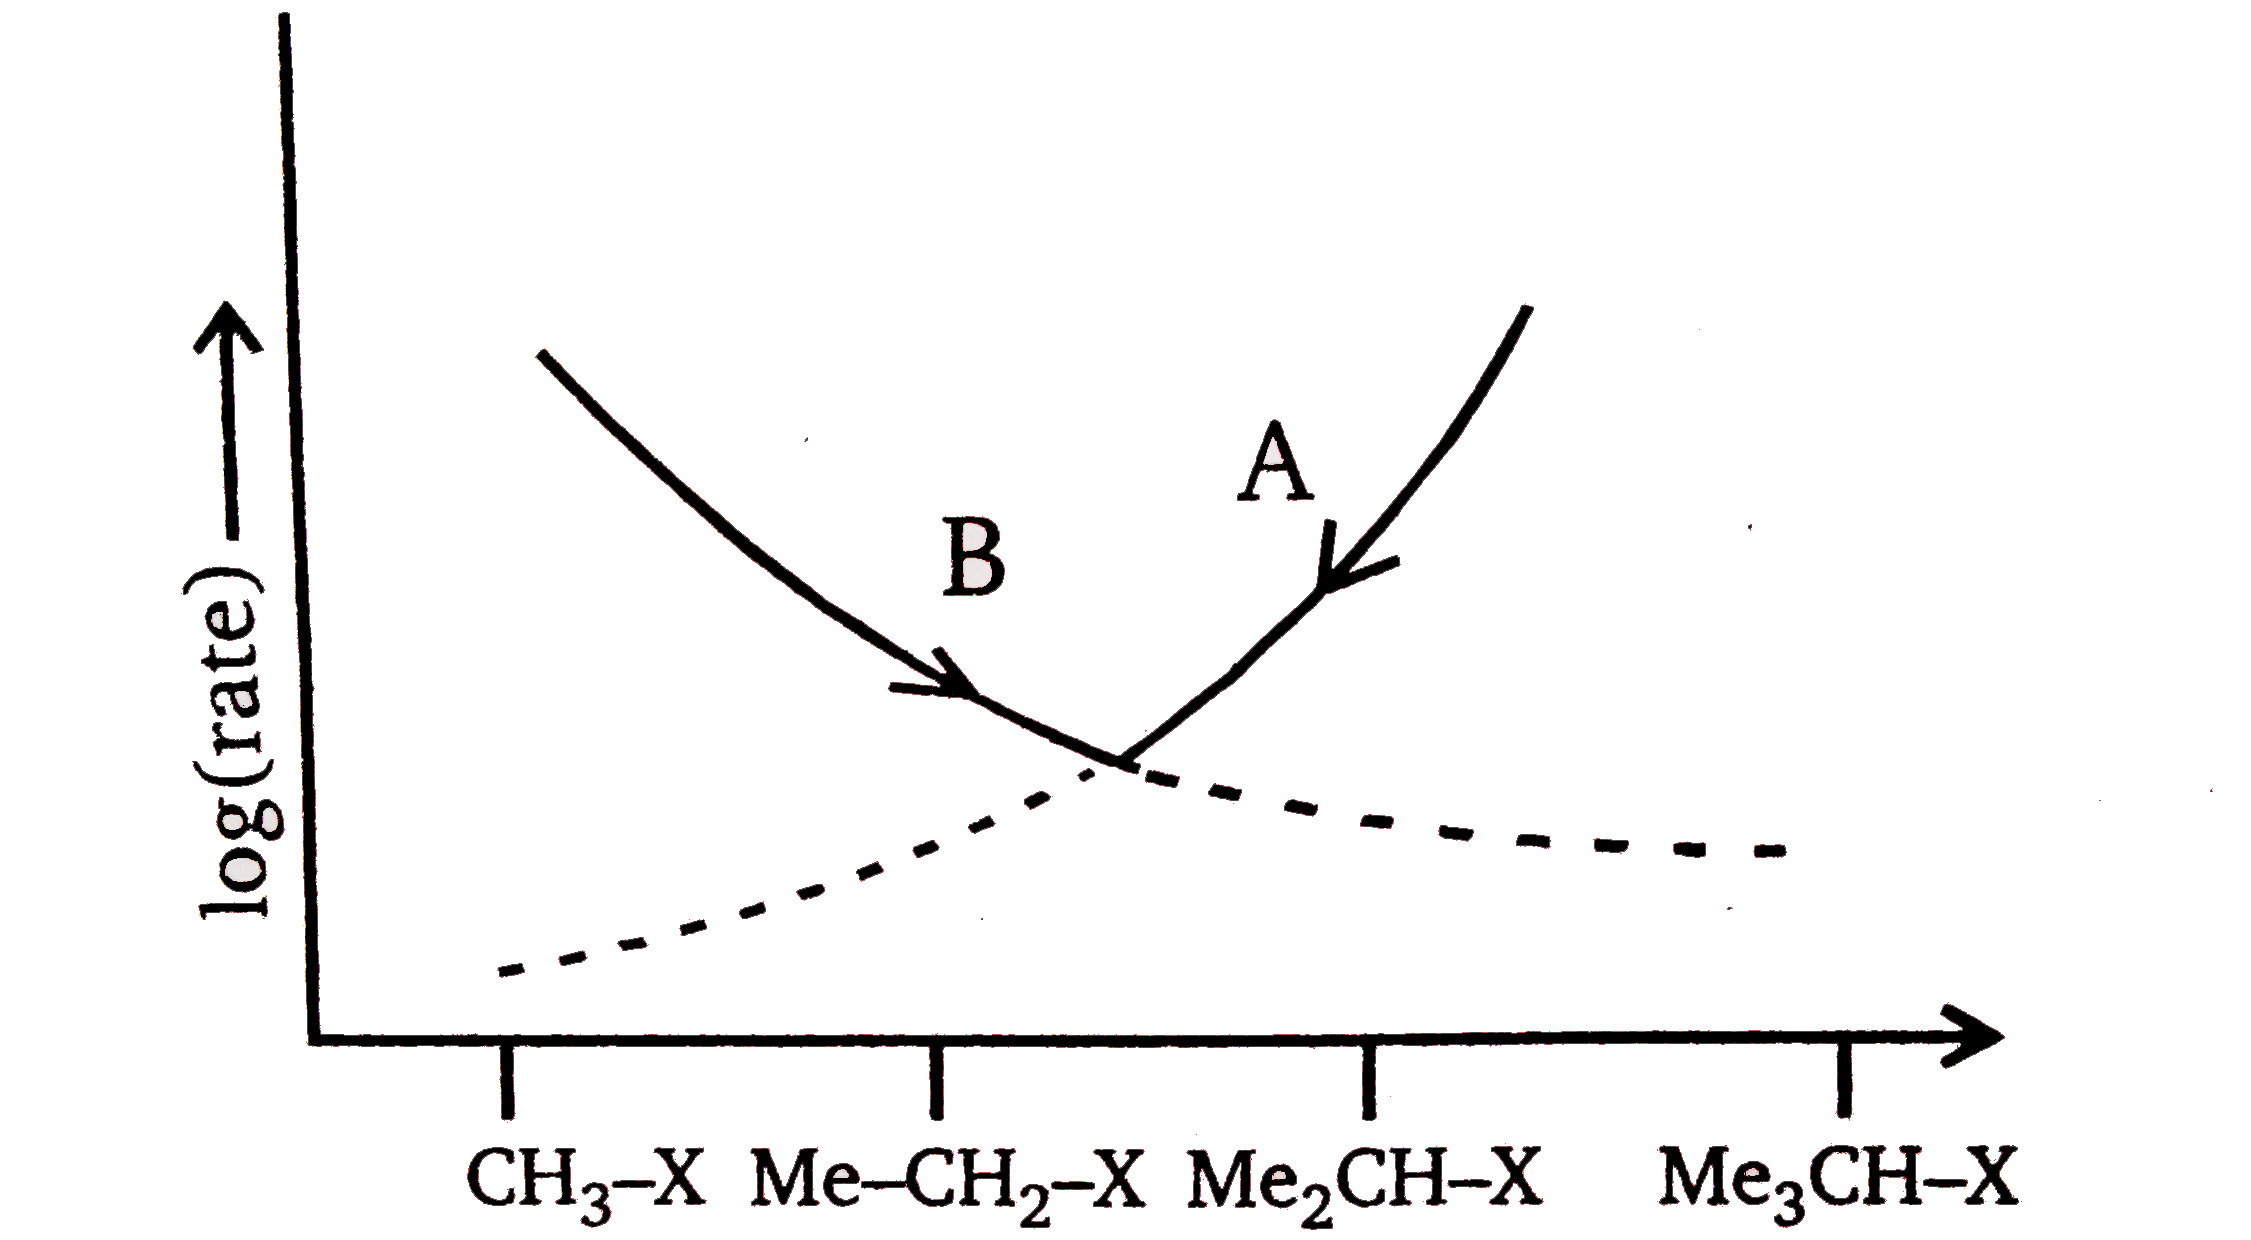
which of the following is true about given graphs A and B ?
View Solution

