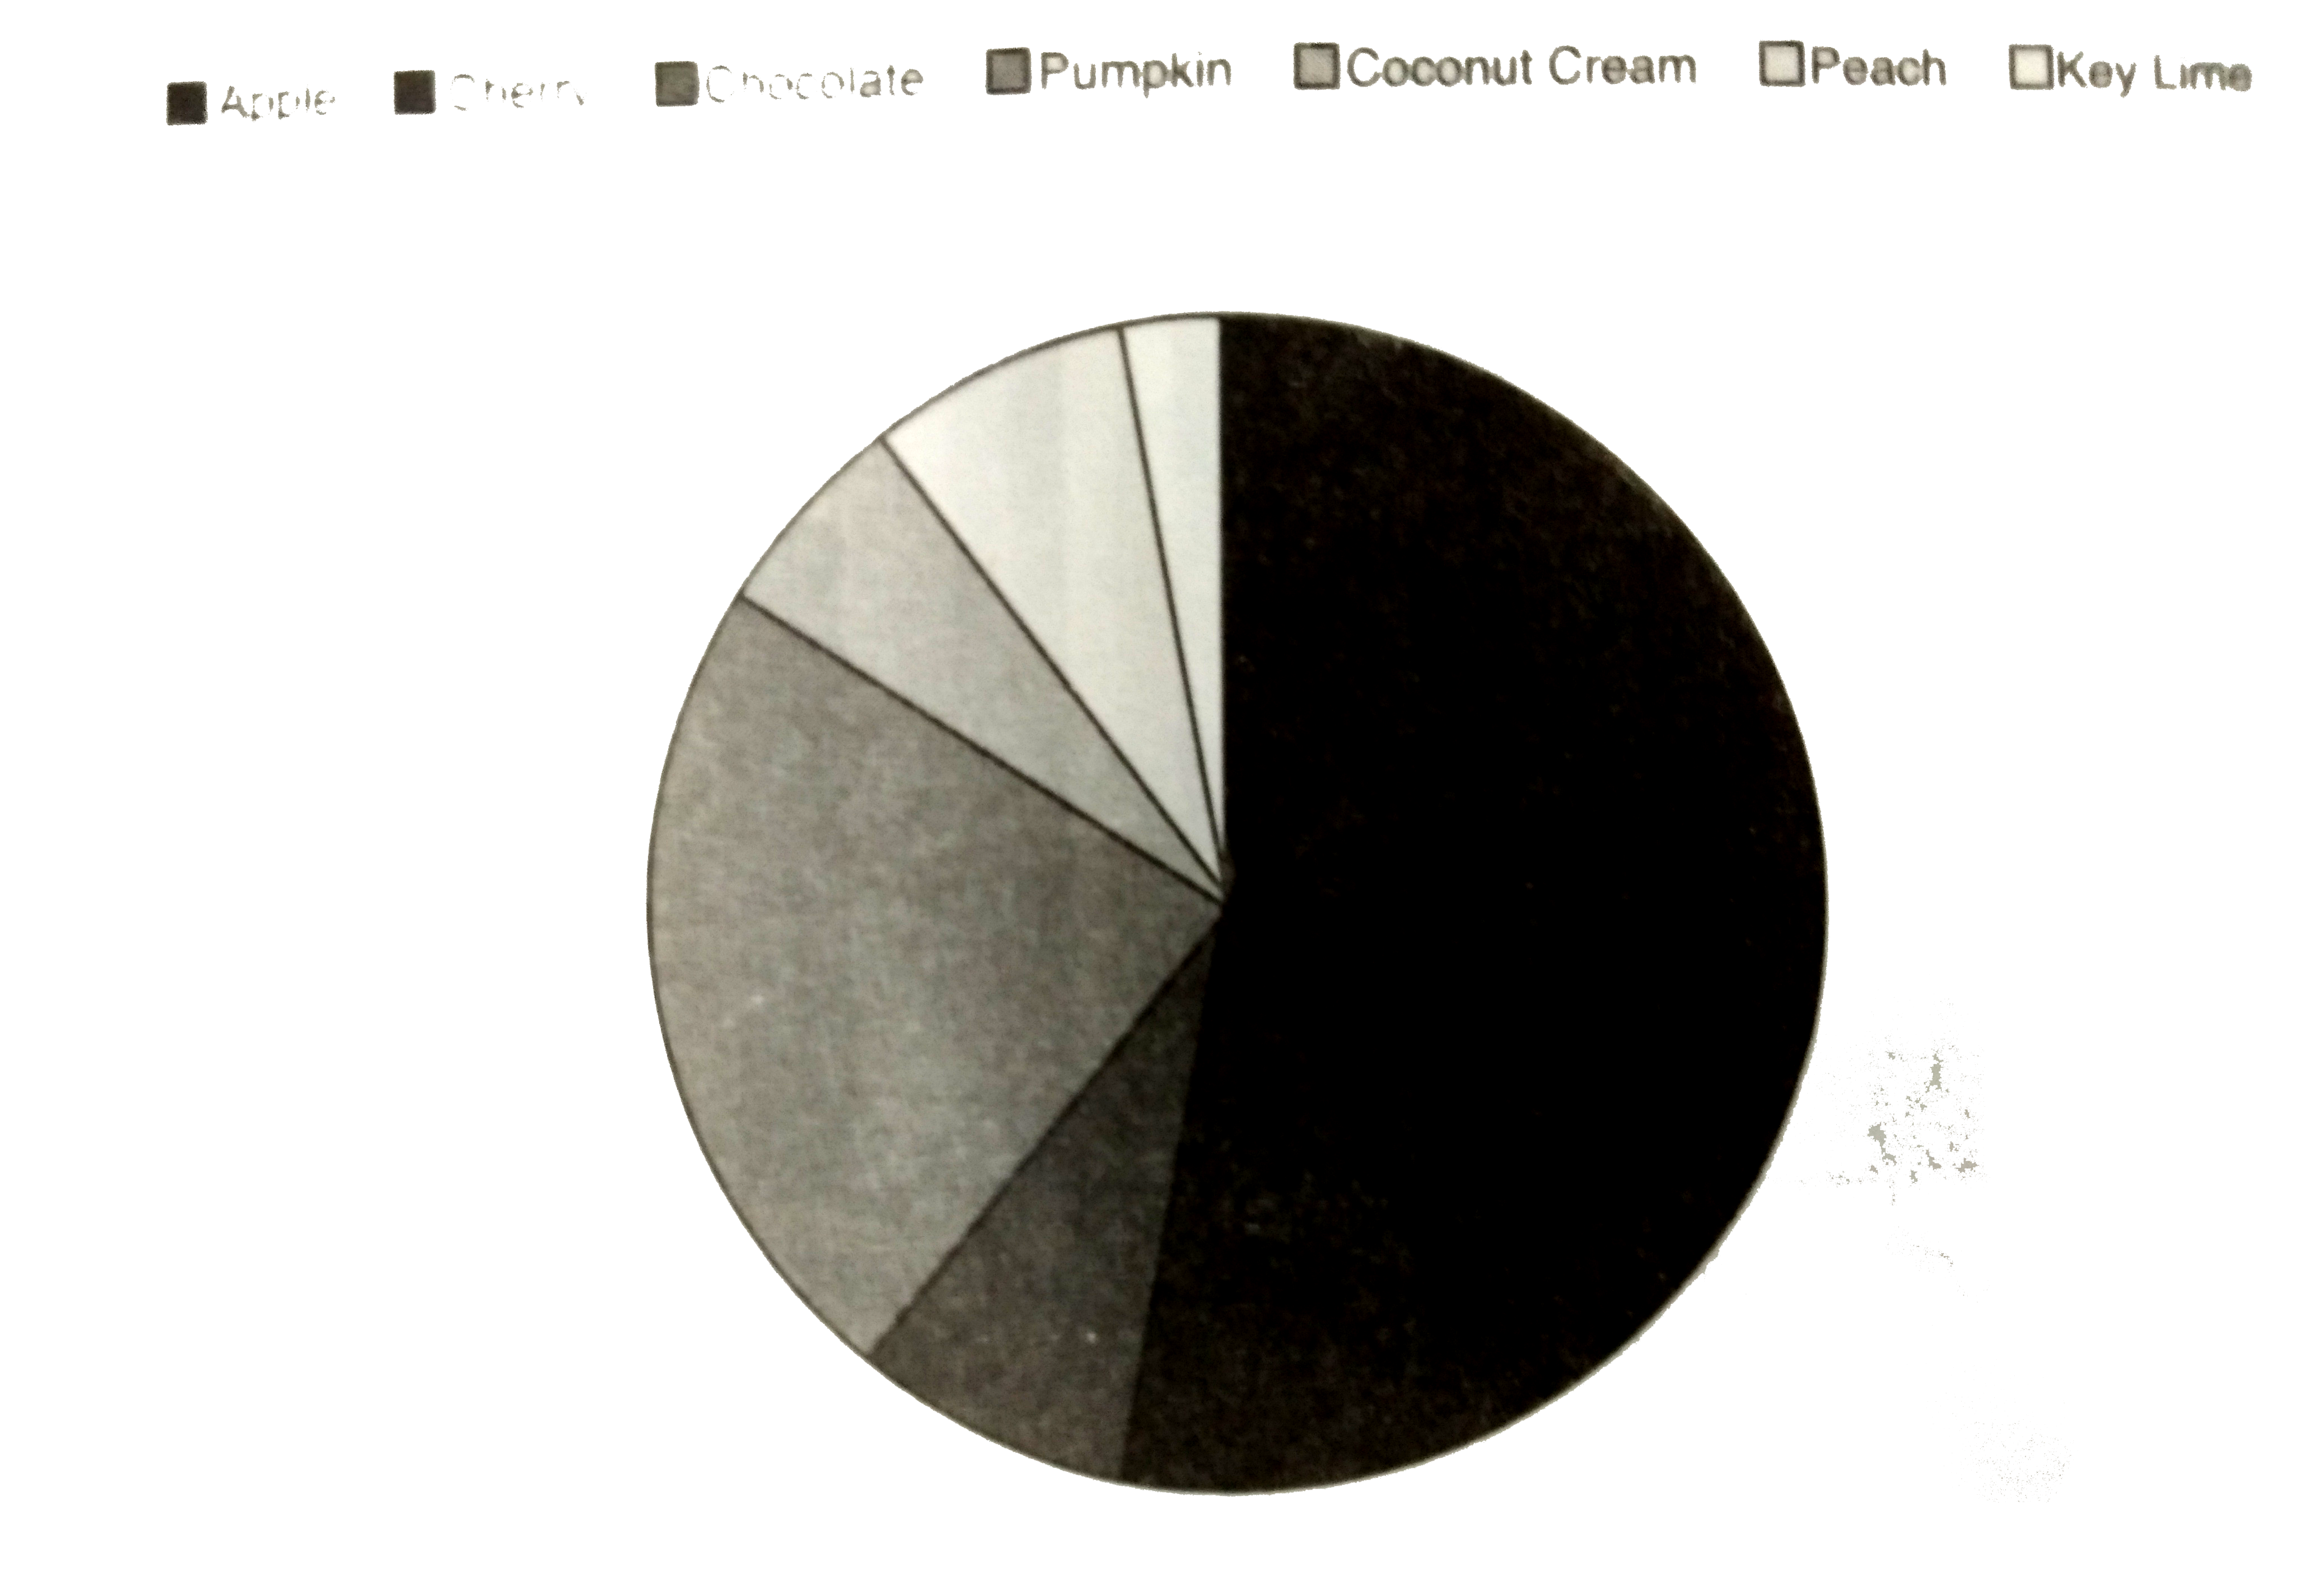
200 students were surveyed about their pie preferences, and the percentages of pies that were considered the "favourite" by respondents are fraphed below: The favourite pie approximately 25% of people is
cherry
pumpkin
apple
peach
The correct Answer is:B
(B) To approach this question, look for a chunk that makes up about one-fourth of the entire pie chart. (B) is the best answer. (C ) is much bigger than a fourth and the other options are obviously less.
Topper's Solved these Questions
Similar Questions
In City X, there were 900 residents. A survey was conducted in it reagrding the favourite beverages of the residents. The results of the survey are partially conveyed in the table below.
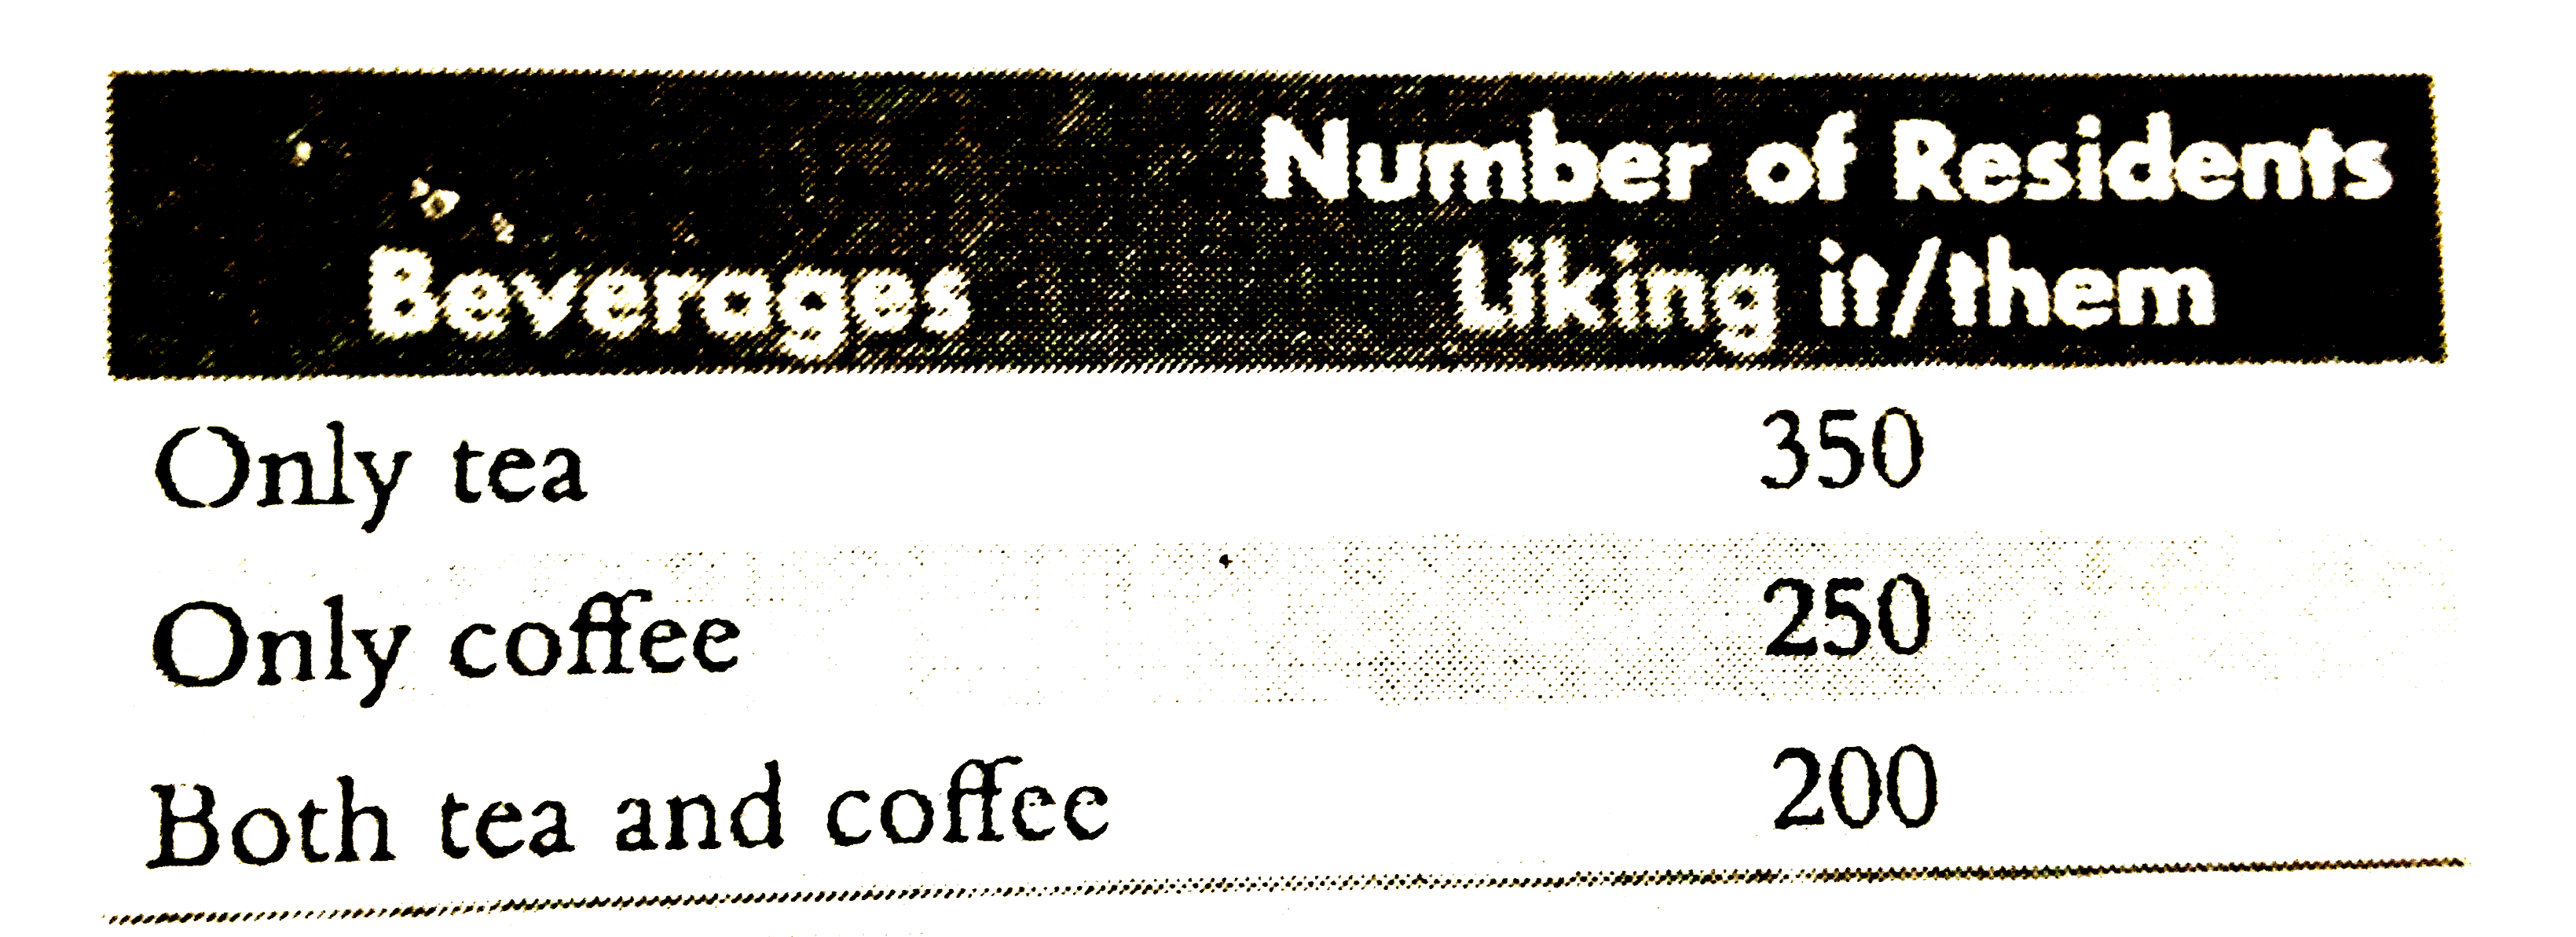
Find the probability that a resident chosen at random likes only tea or only coffee.
View SolutionA survey was conducted. 1200 people answered the survey. 24% people who were mailed the survey questionnaire answered the survey. The survey questionnaire was mailed to how many people?
View Solution
Knowledge Check
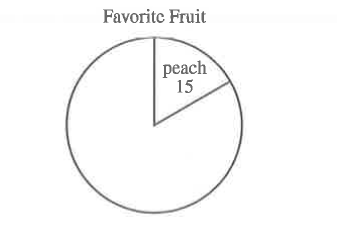
Jie asked 90 students to choose 1 favourite fruit from 4 options. Jie has begun to represent the results in the circle graph below. Peaches were chosen as the favourite of 15 students. Apples, bananas, and strawberries were each chosen as favourite by an equal number of the remaining students. What must be the measure of the central angle in the circle graph for banana?
 A100∘B102∘C105∘D112.5∘
The pie chart shows the results of an online survey which asked people about their favourite author. Study the diagram and answert he following questions.
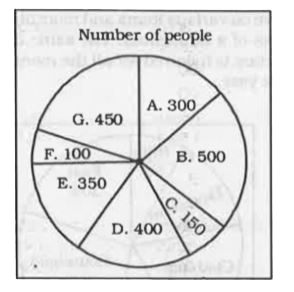
Respondents who say their favourite author is A and those who say their favourite author is B constitute what per cent of the total respendents?A30%B20%C44.44%D35.55%The pie charts shows the results of an online survey which asked people about their favourite game. Study the diagram and answer the following questions. Find percentage people who say their favorite game is Cricket and Hockey of the total people?
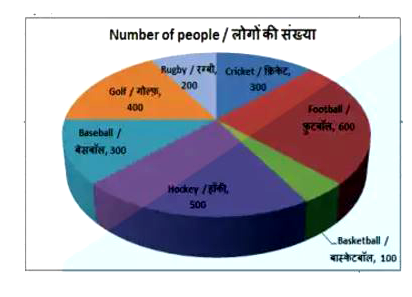
A0.3B33.33C0.25D32.34
The pie chart shows the results of an online survey which asked people about their favourite movie. Study the diagram and answert he following questions.
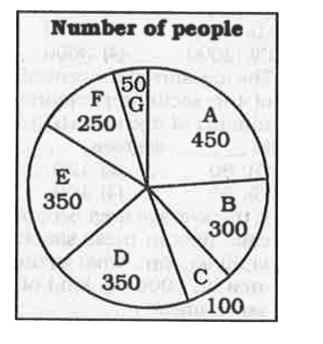
Respondents who say their favourite movie is D and those who say their favourite movie is B constitute what per cent of the total respendents?
View SolutionThe pie chart shows the results of an online survey which asked people about their favourite author. Study the diagram and answert he following questions.

Respondents who say their favourite author is A and those who say their favourite author is B constitute what per cent of the total respendents?
View SolutionThe pie chart shows the results of an online survey which asked people about their favourite game. Study the diagram and answer the following questions.
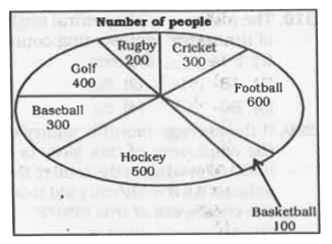
Respondents who say their favourite game is Cricket and those who say their favourite game is Hockey constitute what per cent of the total respendents?
View SolutionThe table shows the number of people who responded to a survey about their favorite style of music.What percentage of respondents aged 21−30 indicated a favourite style other than Rock music?
View SolutionThe table shows the number of people who responded to a survey about their favorite style of music. What percentage of respondents under 31 indicated that Blues is their favourite style of music?
View Solution
