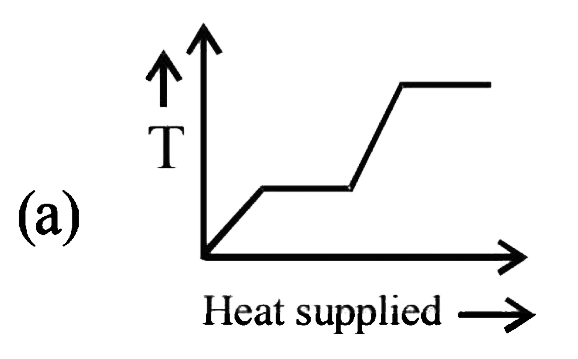
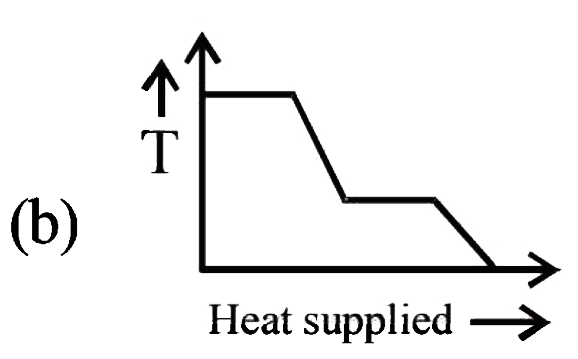
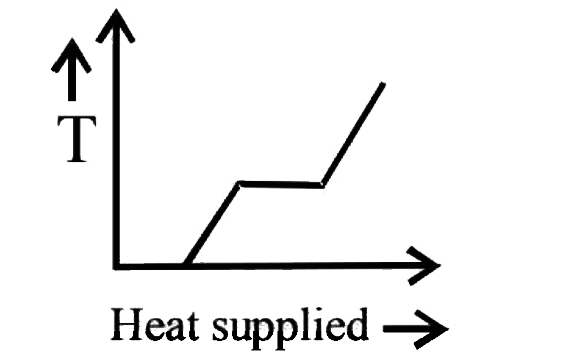
A block of ice at −10∘C is slowly heated and converted to steam at 100∘C. Which of the following curves represents the phenomenon qualitatively?
\
The correct Answer is:A
To solve the problem of heating a block of ice at -10°C and converting it to steam at 100°C, we can break down the process into several steps, each corresponding to a phase change or temperature change. Here’s a step-by-step solution:
Step 1: Heating the Ice from -10°C to 0°C
- Initially, we have a block of ice at -10°C. We need to heat it to 0°C.
- During this phase, the temperature of the ice increases linearly until it reaches 0°C.
Step 2: Melting the Ice at 0°C
- At 0°C, the ice begins to melt. This is a phase change from solid (ice) to liquid (water).
- During this phase change, the temperature remains constant at 0°C while the ice absorbs heat and converts to water.
Step 3: Heating the Water from 0°C to 100°C
- Once all the ice has melted, we now have water at 0°C. We need to heat this water to 100°C.
- Again, during this phase, the temperature of the water increases linearly until it reaches 100°C.
Step 4: Boiling the Water at 100°C
- At 100°C, the water begins to boil. This is another phase change from liquid (water) to gas (steam).
- During this phase change, the temperature remains constant at 100°C while the water absorbs heat and converts to steam.
Step 5: Heating the Steam Above 100°C
- After all the water has turned to steam, if we continue to add heat, the temperature of the steam will increase above 100°C.
- This phase will show a linear increase in temperature as we heat the steam.
Summary of the Curve
- The curve representing this process will have:
- A linear increase in temperature from -10°C to 0°C (heating ice).
- A flat line at 0°C (melting ice).
- A linear increase in temperature from 0°C to 100°C (heating water).
- A flat line at 100°C (boiling water).
- A linear increase in temperature above 100°C (heating steam).
Final Answer
The qualitative representation of this phenomenon can be depicted as a curve with two flat sections (phase changes) and three linear sections (temperature changes).
---
- Initially, we have a block of ice at -10°C. We need to heat it to 0°C.
- During this phase, the temperature of the ice increases linearly until it reaches 0°C.
- At 0°C, the ice begins to melt. This is a phase change from solid (ice) to liquid (water).
- During this phase change, the temperature remains constant at 0°C while the ice absorbs heat and converts to water.
- Once all the ice has melted, we now have water at 0°C. We need to heat this water to 100°C.
- Again, during this phase, the temperature of the water increases linearly until it reaches 100°C.
- At 100°C, the water begins to boil. This is another phase change from liquid (water) to gas (steam).
- During this phase change, the temperature remains constant at 100°C while the water absorbs heat and converts to steam.
- After all the water has turned to steam, if we continue to add heat, the temperature of the steam will increase above 100°C.
- This phase will show a linear increase in temperature as we heat the steam.
- The curve representing this process will have:
- A linear increase in temperature from -10°C to 0°C (heating ice).
- A flat line at 0°C (melting ice).
- A linear increase in temperature from 0°C to 100°C (heating water).
- A flat line at 100°C (boiling water).
- A linear increase in temperature above 100°C (heating steam).
The qualitative representation of this phenomenon can be depicted as a curve with two flat sections (phase changes) and three linear sections (temperature changes).
Topper's Solved these Questions
Similar Questions
Knowledge Check
- Question 1 - Select One
A block of ice −10∘C is slowly heated and converted to steam at 100∘C. Which of the following curves represent the phenomenon qualitatively?
A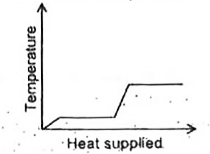 B
B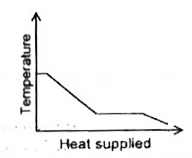 C
C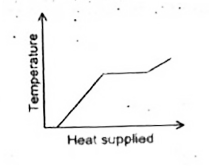 D
D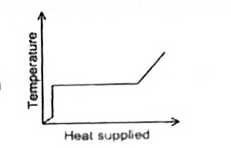
- Question 2 - Select One
A block of ice at −12∘C is slowly heated and converted into steam at 100∘C. Which of the following curves best represents the event ?
A B
B C
C D
D
- Question 3 - Select One
A block of ice at temperature −20∘C is slowly heated and converted to steam at 100∘C. Which of the following diagram is most appropriate?
A B
B C
C D
D
a block of ice at temperature −20∘C is slowly heated and converted to steam at 100∘C which of the following diagram is most appropriate
View Solutiona block of ice at temperature −20∘C is slowly heated and converted to steam at 100∘C which of the following diagram is most appropriate
View SolutionA block of ice at −5∘C is slowly heated and converted to steam at 100∘C . The process can be qualitatively represented by the curve
View SolutionA block of ice at 0∘C is converted to steam at 100∘C. Which process will require the most amount of heat?
View Solution1g of ice at 0∘C is mixed 1g of steam at 100∘C. The mass of water formed is
View Solution

