A body is acted upon by a constant force fromtime t=0 to a time t=T after which it does not experience any force. Which of the following graphs best represents the variation of the velocity of the body with time ?
A
br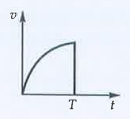
B
br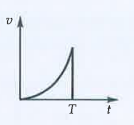
C
br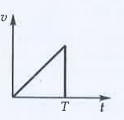
D
br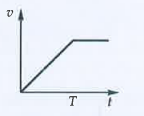
Video Solution
|
Answer
Step by step video & image solution for A body is acted upon by a constant force fromtime t=0 to a time t=T after which it does not experience any force. Which of the following graphs best represents the variation of the velocity of the body with time ? by Physics experts to help you in doubts & scoring excellent marks in Class 11 exams.
Updated on:21/07/2023
Related Playlists
Similar Practice Problems
- Question 1 - Select One
Which of the following graphs represents the variation of activity (A) of a radioactive substance with time (t).
A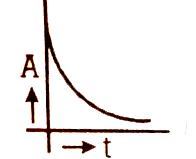 B
B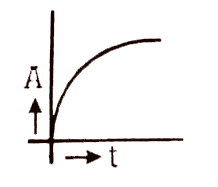 C
C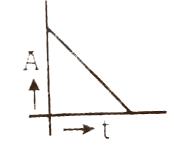 D
D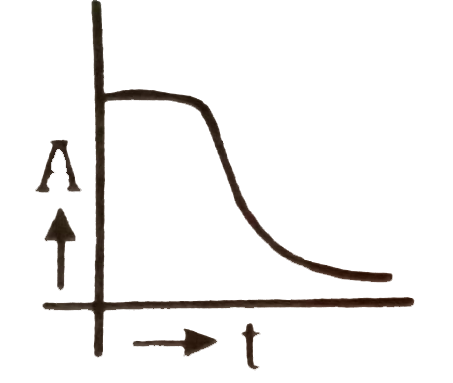
- Question 1 - Select One
A body is acted upon by a constant force, then it will have a uniform
AspeedBvelocityCmomentumDacceleration - Question 1 - Select One
A body is acted upon by a constant force, then it will have a uniform
AspeedBvelocityCmomentumDacceleration - Question 1 - Select One
The graph shown the variation with times t of the velocity v of an object . Which one of the following graphs best represents the variation of acceleration a of the object with time t?
 A
A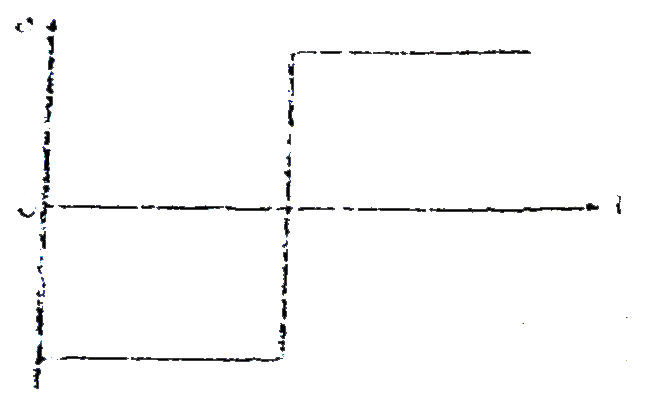 B
B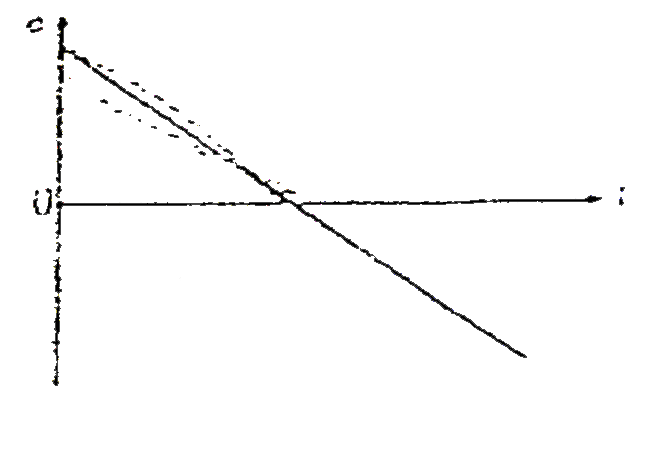 C
C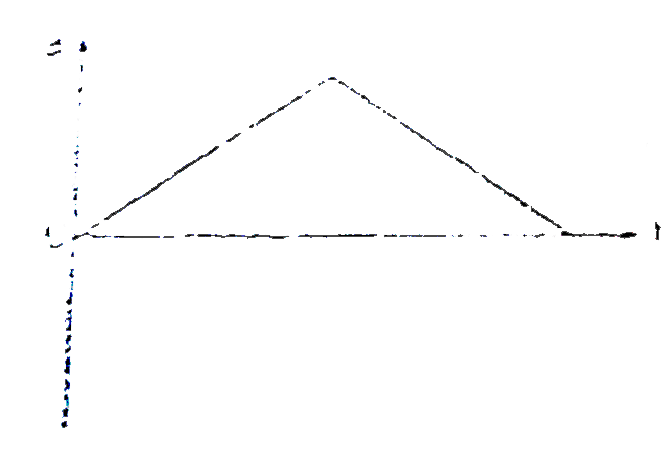 D
D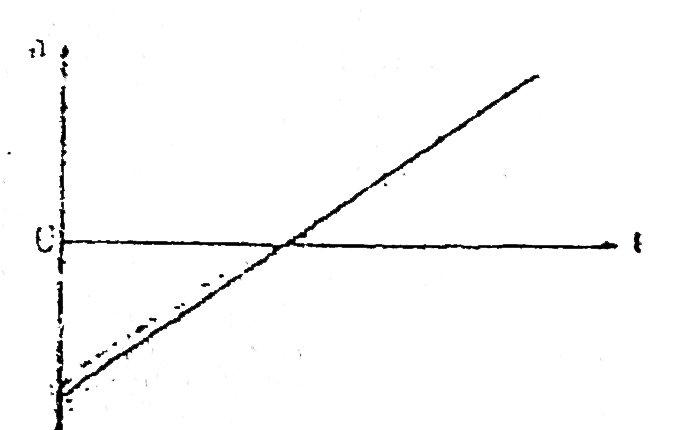
- Question 1 - Select One
Which of the following x-t graphs represents the distance-time variation of a body released from the top of a buiding?
A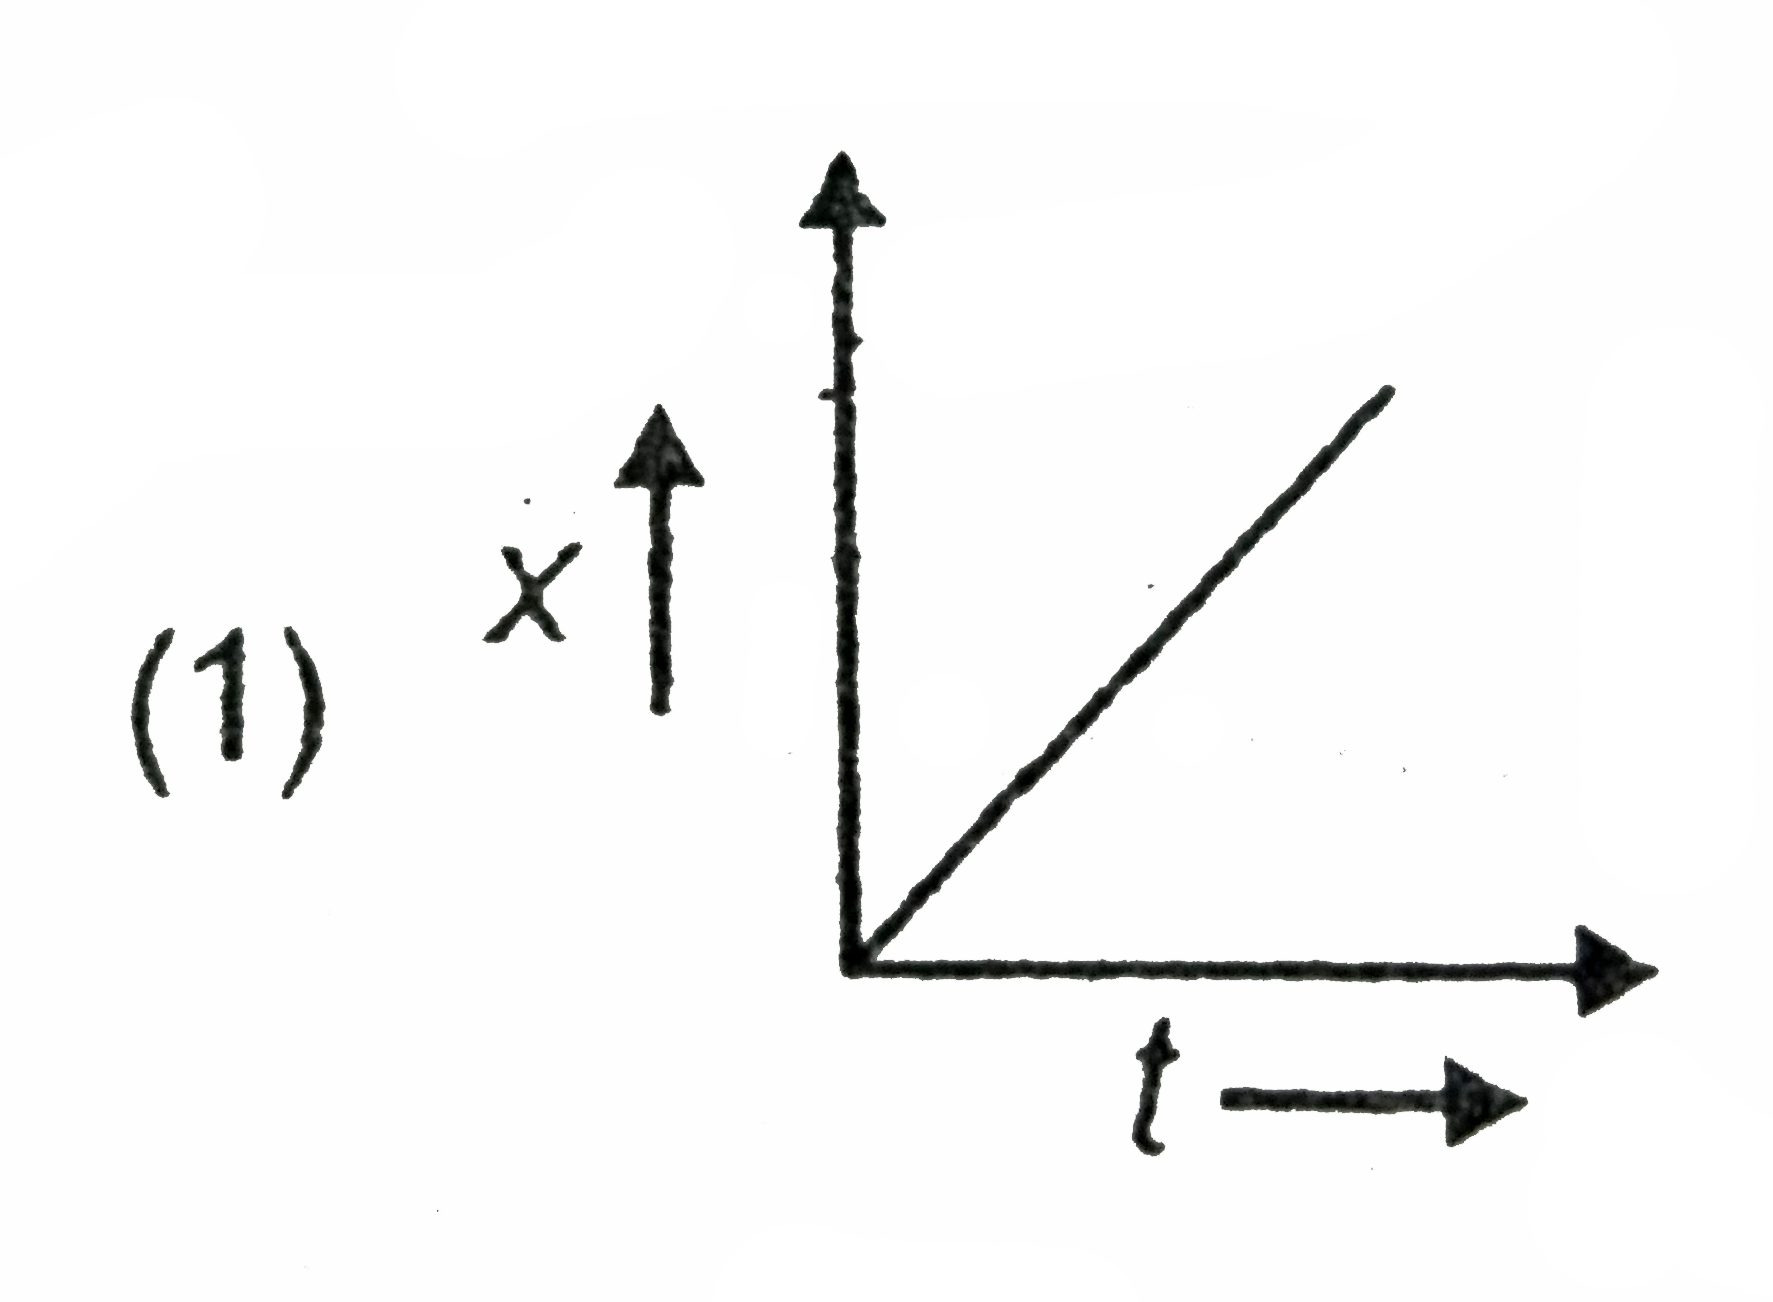 B
B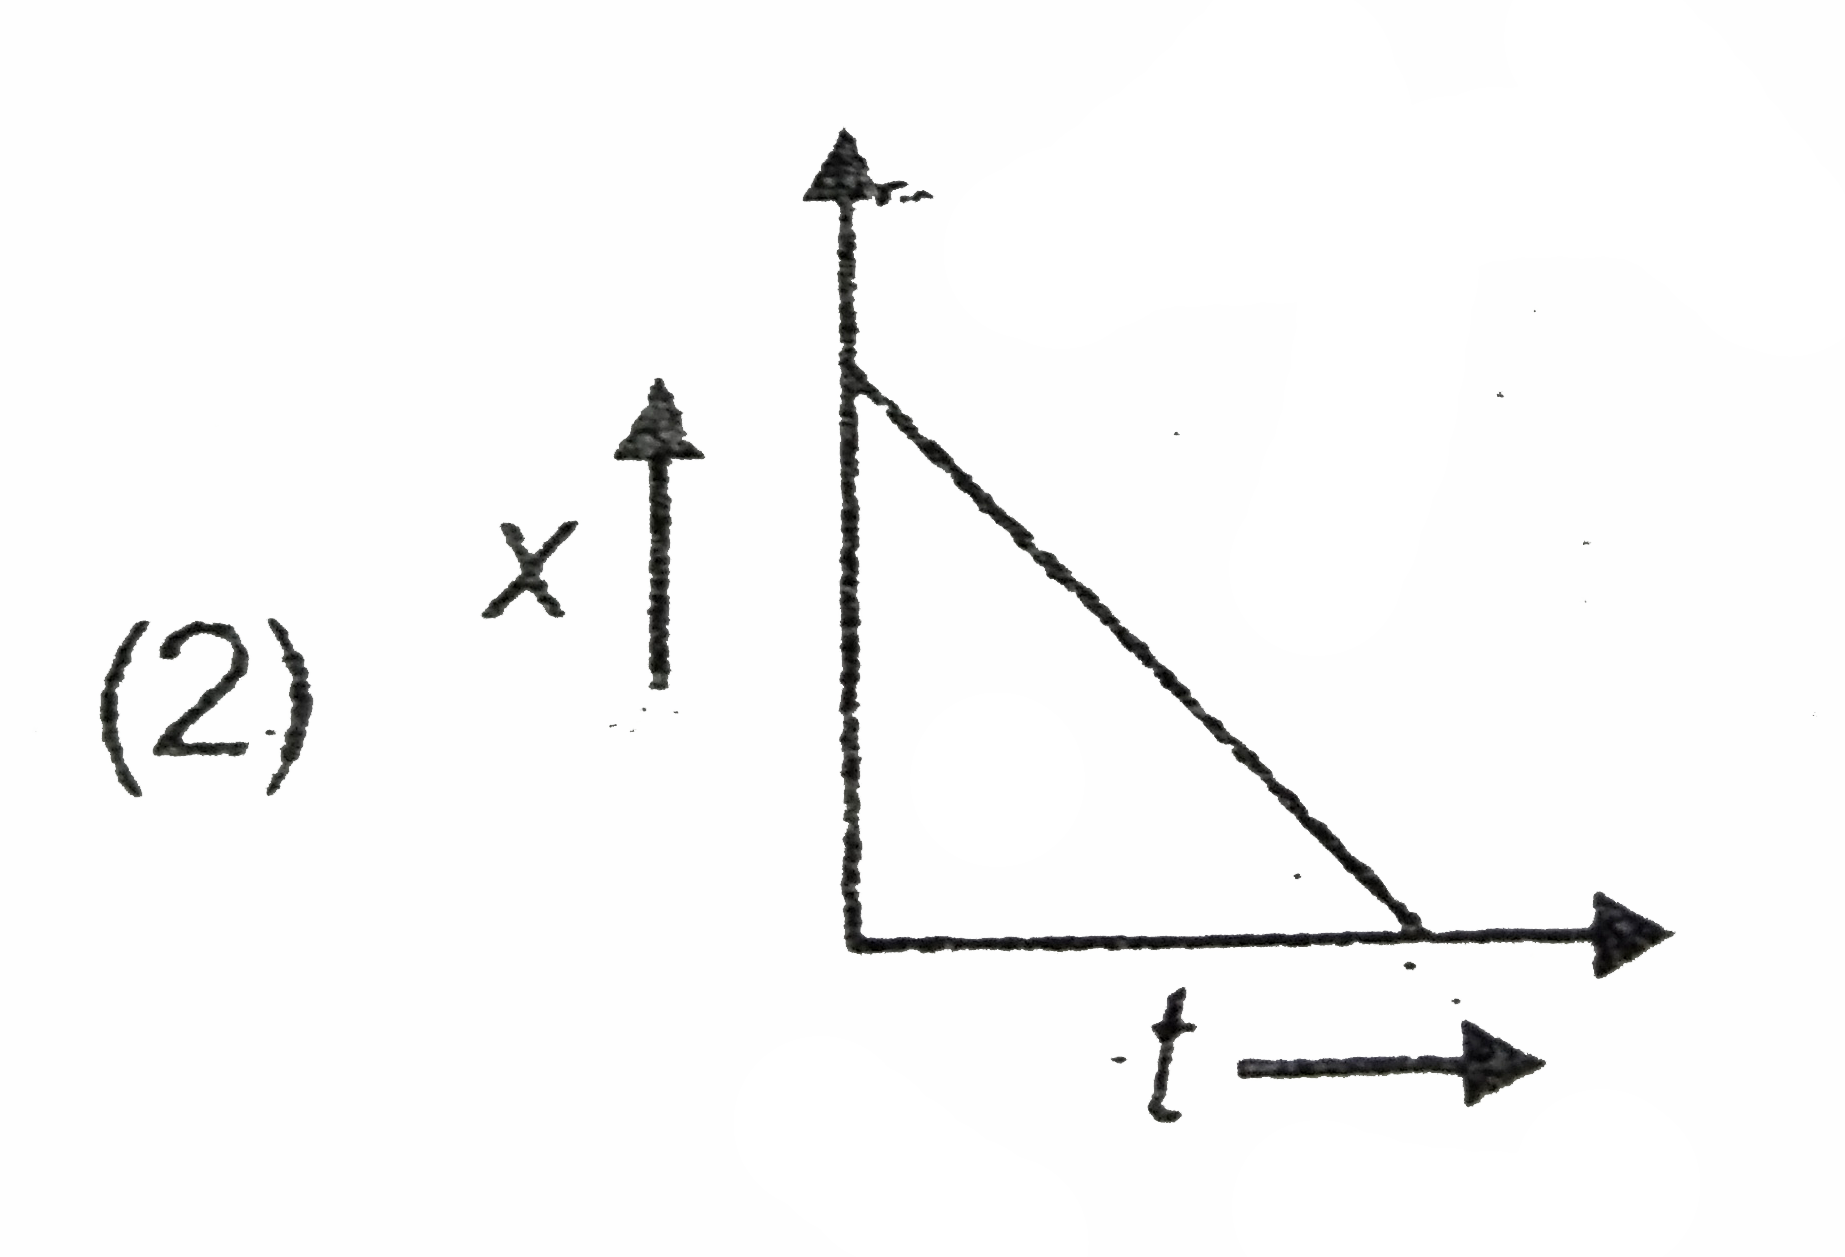 C
C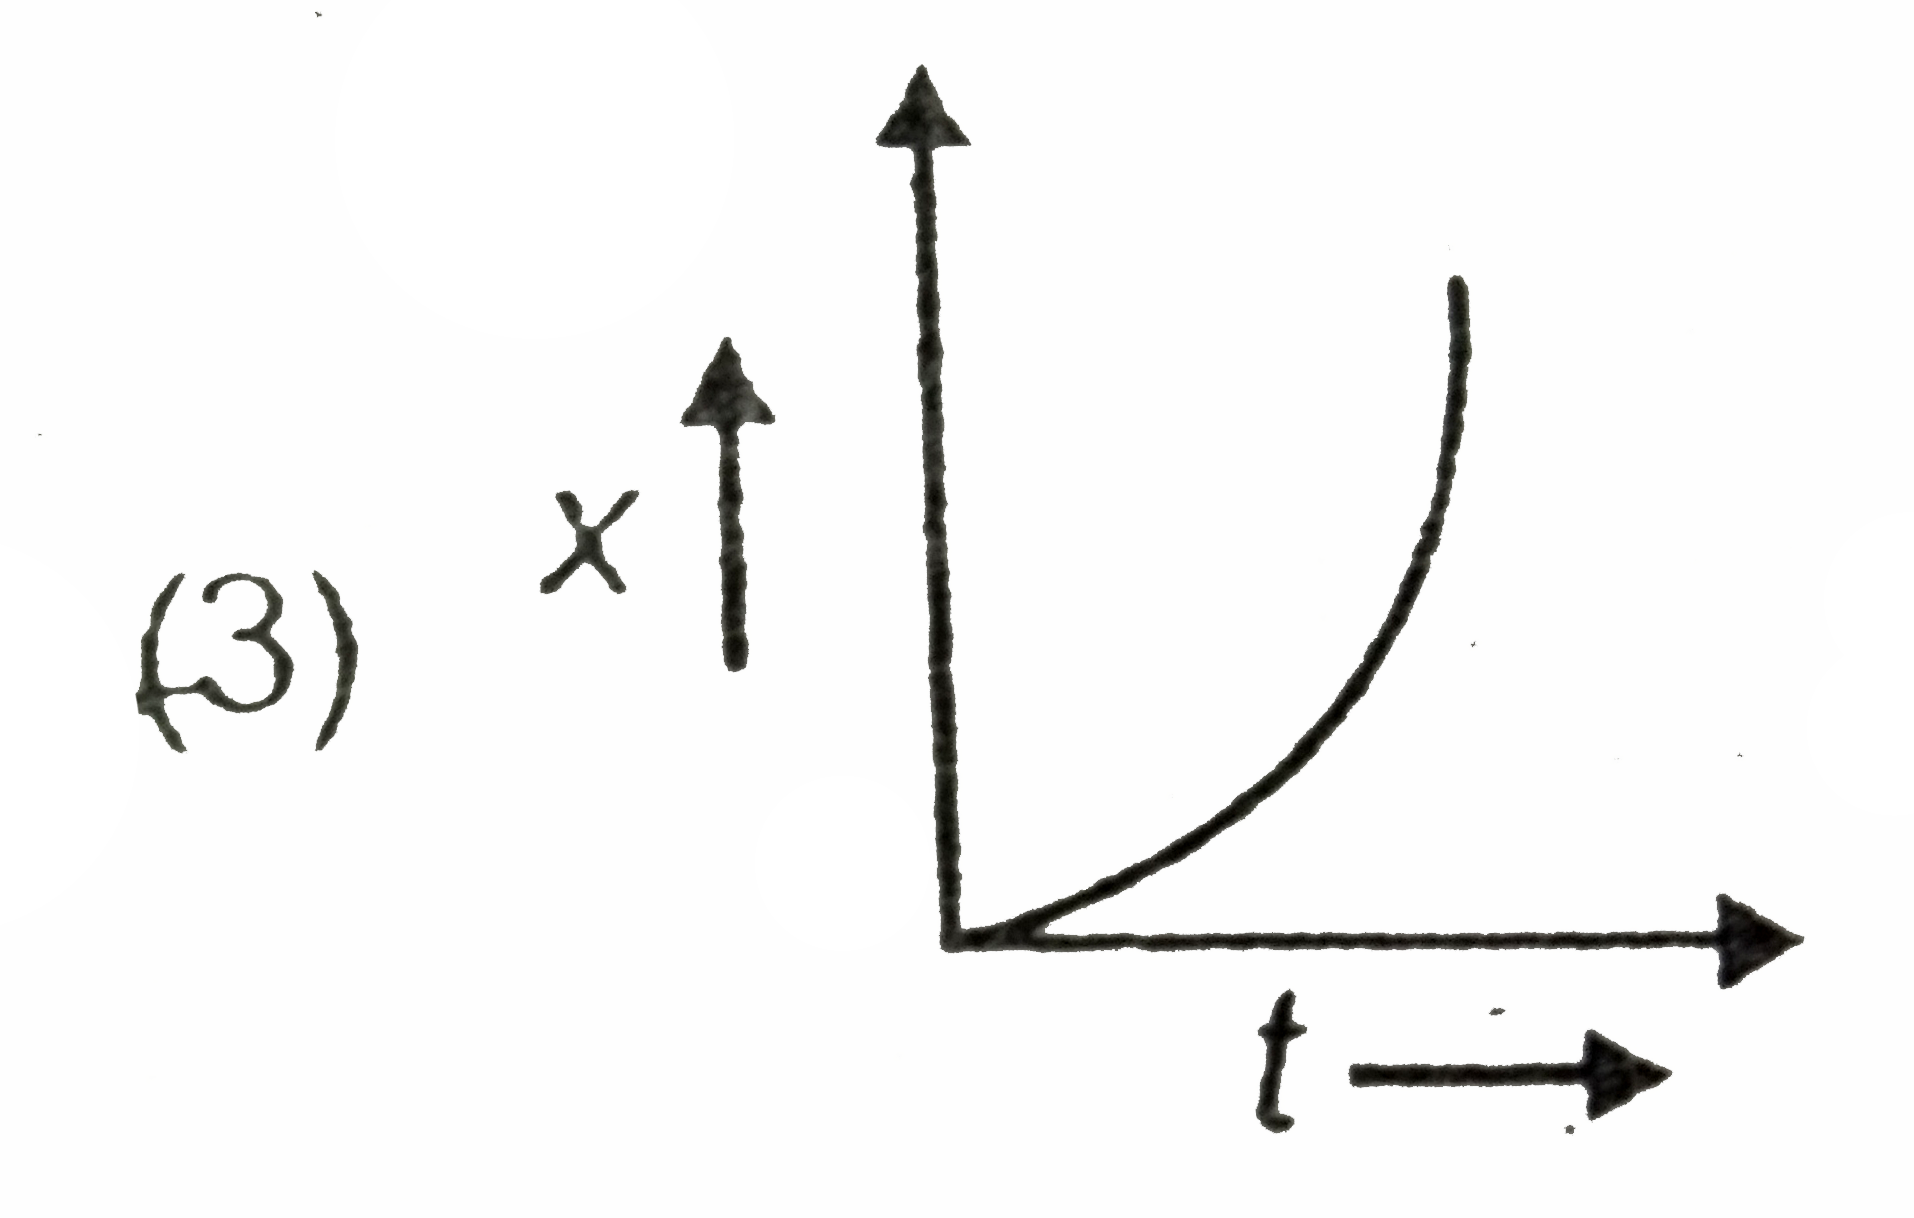 D
D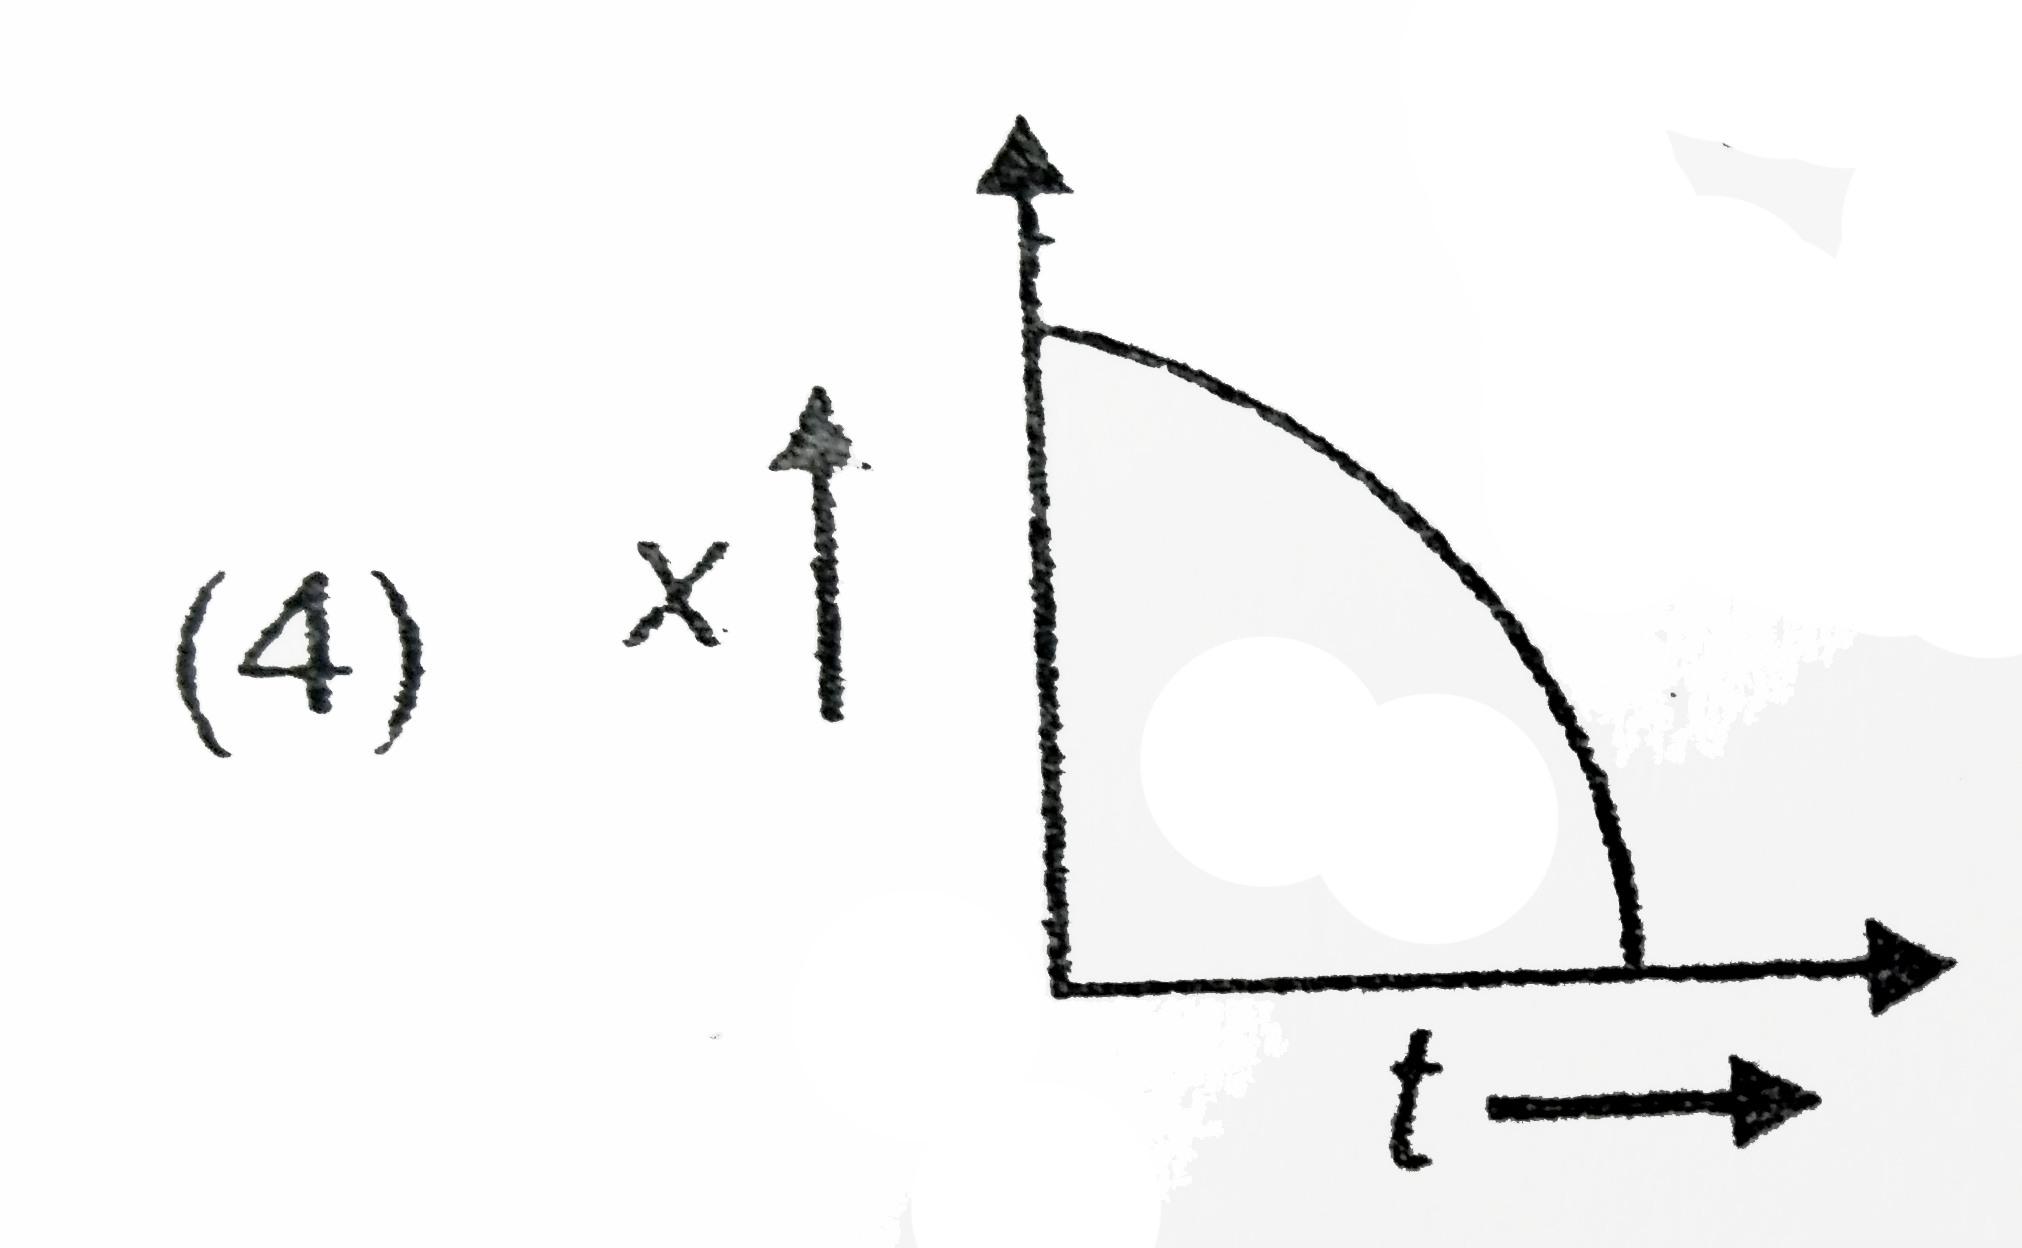
- Question 1 - Select One
At time t=0, some radioactive gas is injected into a sealed vessel. At time T, some more of the same gas is injected into the same vessel. Which one of the following graphs best represents the variation of the logarithm of the activity A of the gas with time t?
A B
B C
C D
D
- Question 1 - Select One
At time t=0, some radioactive gas is injected into a sealed vessel. At time T, some more of the same gas is injected into the same vessel. Which one of the following graphs best represents the variation of the logarithm of the activity A of the gas with time t?
A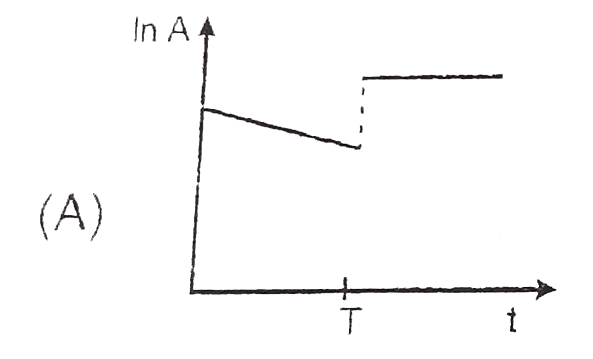 B
B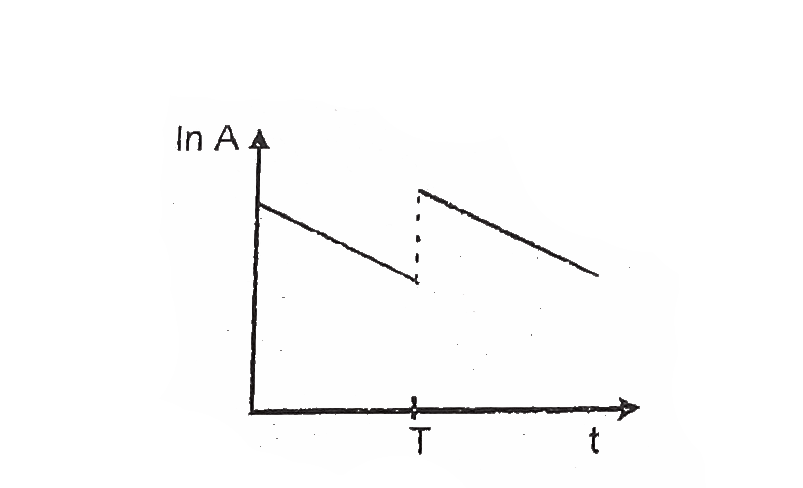 C
C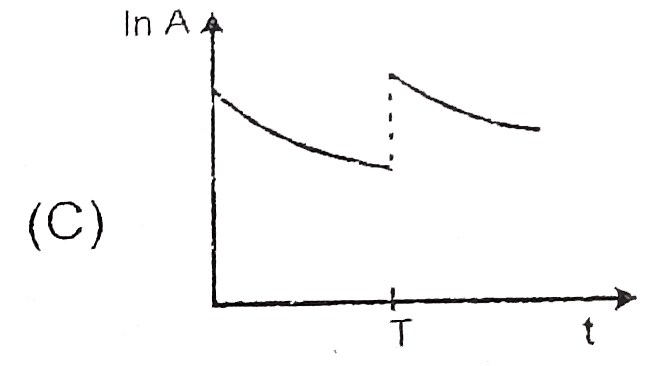 D
D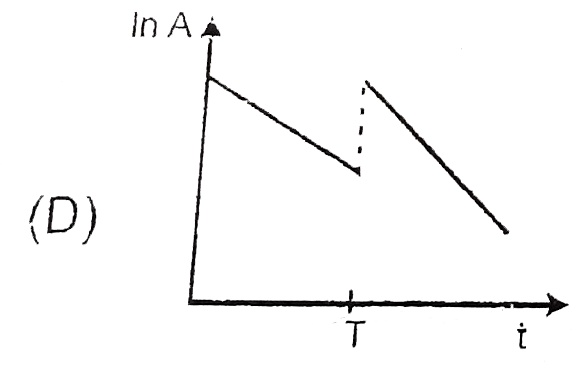
- Question 1 - Select One
A body is thrown vertically upwards which graph represents variation of velocity w.r.t time
A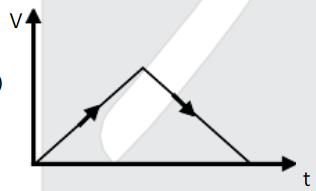 B
B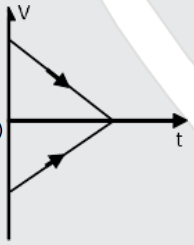 C
C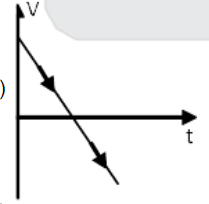 D
D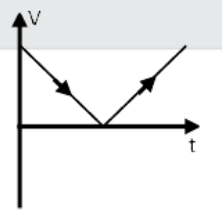
- Question 1 - Select One
The displacement versus time graph for a body moving in a straight line is shown in figure. Which of the following regions represents the motion when no force is acting on the body
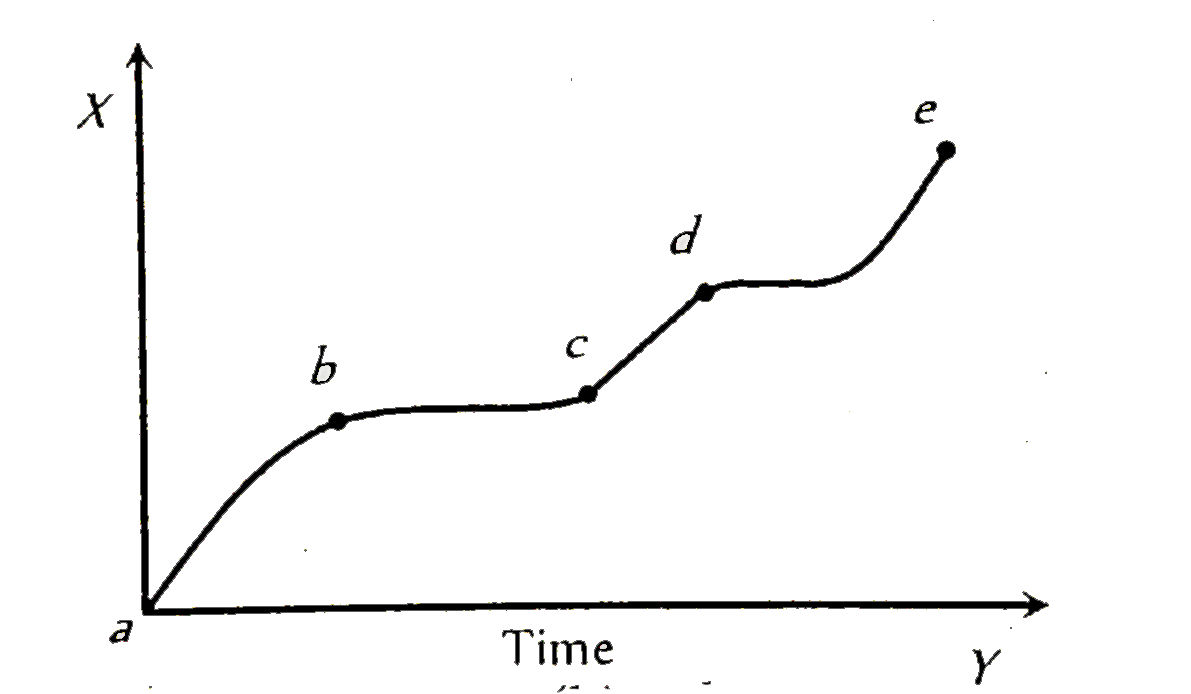 AabBbcCcdDde
 - Question 1 - Select One
If an uniform force is acted upon a body which of the following remains constant?
AKinetic energy,BVelocityCMomentumDAcceleration

