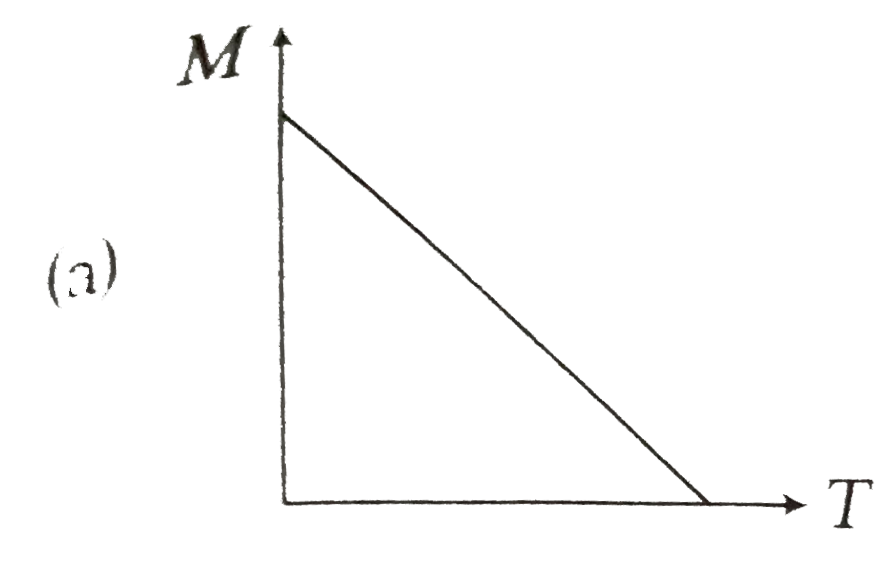
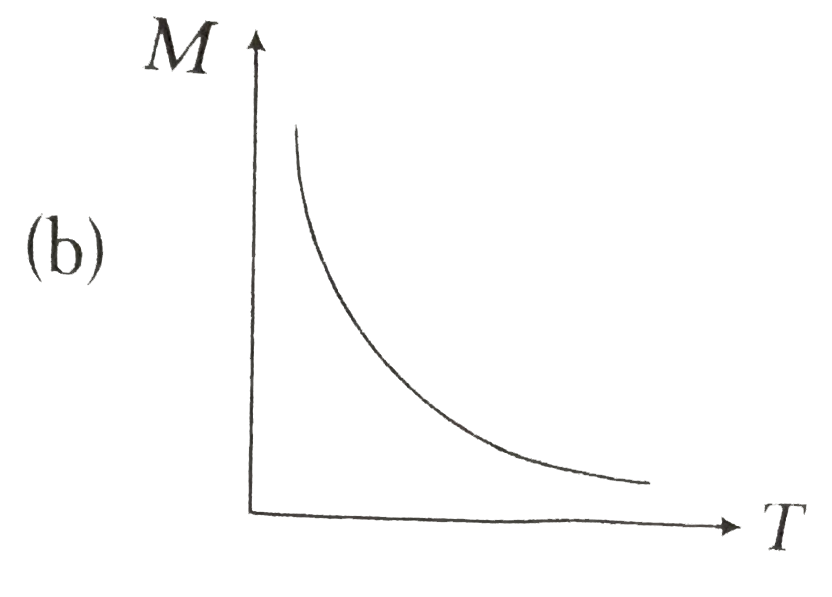
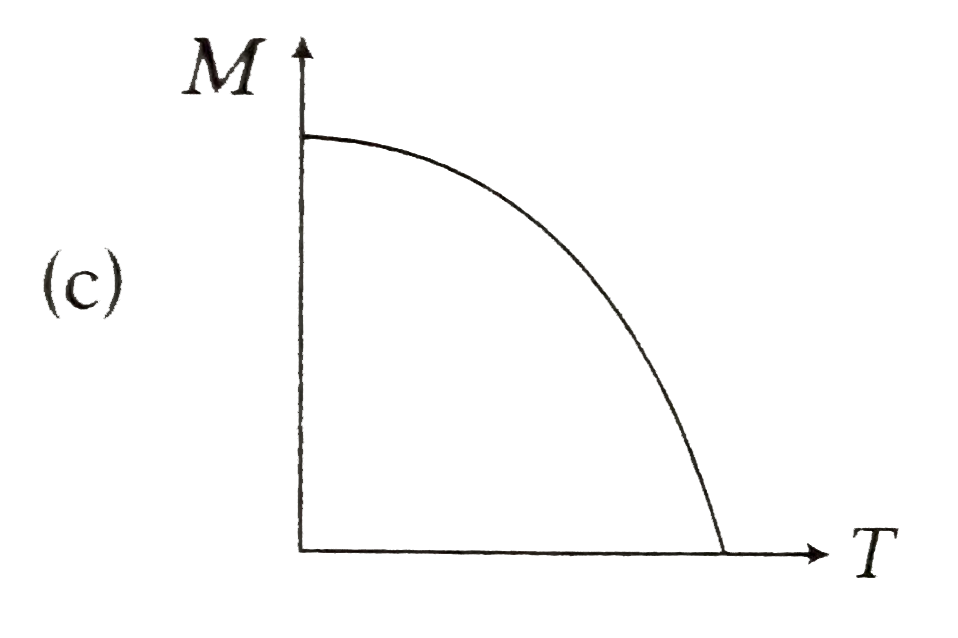
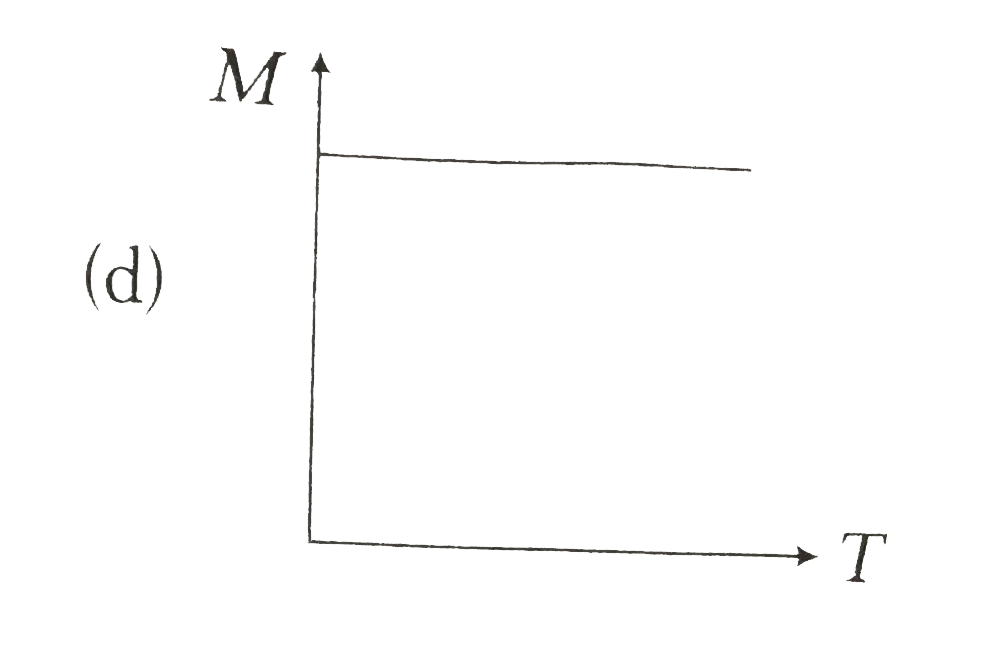
A curve between magnetic moment and temperature of magnet is
The correct Answer is:C
To solve the problem of determining the curve between magnetic moment and temperature of a magnet, we can follow these steps:
Step 1: Understand the Relationship Between Magnetic Moment and Temperature
The magnetic moment of a material is influenced by its temperature. As temperature changes, the magnetic properties of the material can transition between different states such as ferromagnetism, paramagnetism, and diamagnetism.
Step 2: Identify the Different Regions of Magnetic Behavior
1. Ferromagnetism (Region AB): At low temperatures, materials exhibit ferromagnetism, where the magnetic moments are aligned.
2. Paramagnetism (Region BC): As the temperature increases, the thermal agitation causes the alignment of magnetic moments to decrease, leading to paramagnetism.
3. Diamagnetism (Region CD): At even higher temperatures, materials may exhibit diamagnetism, where the magnetic susceptibility becomes negative and does not change significantly with temperature.
Step 3: Analyze the Susceptibility vs. Temperature Curve
The curve of magnetic susceptibility (χ) versus temperature (T) typically shows:
- A sharp increase in susceptibility as the temperature approaches the Curie temperature (T_C) for ferromagnetic materials.
- A peak at T_C, after which susceptibility decreases, transitioning into paramagnetism.
- A plateau or slight decrease in susceptibility as temperature continues to rise, indicating diamagnetism.
Step 4: Relate Susceptibility to Magnetic Moment
Magnetic susceptibility (χ) is proportional to the magnetic moment (μ) of the material. Therefore, the curve of magnetic moment versus temperature will follow a similar trend to that of susceptibility:
- It will increase in the ferromagnetic region, peak at the Curie temperature, and then decrease in the paramagnetic region, eventually leveling off in the diamagnetic region.
Step 5: Choose the Correct Option
Based on the analysis of the curve:
- Option A does not show the correct trend.
- Option B also fails to represent the expected behavior.
- Option C shows an initial increase followed by a decrease, which aligns with our understanding of the magnetic moment's behavior with temperature.
- Option D does not correctly represent the trend.
Thus, Option C is the correct choice.
Summary of the Solution
The curve between magnetic moment and temperature shows an initial increase in the ferromagnetic region, a peak at the Curie temperature, followed by a decrease in the paramagnetic region, and a plateau in the diamagnetic region. The correct option representing this behavior is Option C.
---
The magnetic moment of a material is influenced by its temperature. As temperature changes, the magnetic properties of the material can transition between different states such as ferromagnetism, paramagnetism, and diamagnetism.
1. Ferromagnetism (Region AB): At low temperatures, materials exhibit ferromagnetism, where the magnetic moments are aligned.
2. Paramagnetism (Region BC): As the temperature increases, the thermal agitation causes the alignment of magnetic moments to decrease, leading to paramagnetism.
3. Diamagnetism (Region CD): At even higher temperatures, materials may exhibit diamagnetism, where the magnetic susceptibility becomes negative and does not change significantly with temperature.
The curve of magnetic susceptibility (χ) versus temperature (T) typically shows:
- A sharp increase in susceptibility as the temperature approaches the Curie temperature (T_C) for ferromagnetic materials.
- A peak at T_C, after which susceptibility decreases, transitioning into paramagnetism.
- A plateau or slight decrease in susceptibility as temperature continues to rise, indicating diamagnetism.
Magnetic susceptibility (χ) is proportional to the magnetic moment (μ) of the material. Therefore, the curve of magnetic moment versus temperature will follow a similar trend to that of susceptibility:
- It will increase in the ferromagnetic region, peak at the Curie temperature, and then decrease in the paramagnetic region, eventually leveling off in the diamagnetic region.
Based on the analysis of the curve:
- Option A does not show the correct trend.
- Option B also fails to represent the expected behavior.
- Option C shows an initial increase followed by a decrease, which aligns with our understanding of the magnetic moment's behavior with temperature.
- Option D does not correctly represent the trend.
The curve between magnetic moment and temperature shows an initial increase in the ferromagnetic region, a peak at the Curie temperature, followed by a decrease in the paramagnetic region, and a plateau in the diamagnetic region. The correct option representing this behavior is Option C.
Similar Questions
Magnetic moment of the lap
View SolutionA: The relation between magnetic moment and angular momentum is true for every finite size body.
R: Ratio of magnetic dipole moment and angular momentum is just dependent on specific charge of the body.
View SolutionUnit of magnetic moment is
View SolutionThe magnetic moment has dimensions of
View SolutionRelation between magnetic moment and angular velocity is -
View SolutionWhat is the net magnetic moment of an atom of a diamagnetic material?
View SolutionTo measure the magnetic moment of a bar magnet, one may use
View SolutionThe magnetic moment of atomic neon is
View SolutionThe magnetic moment of a diamagnetic substance is
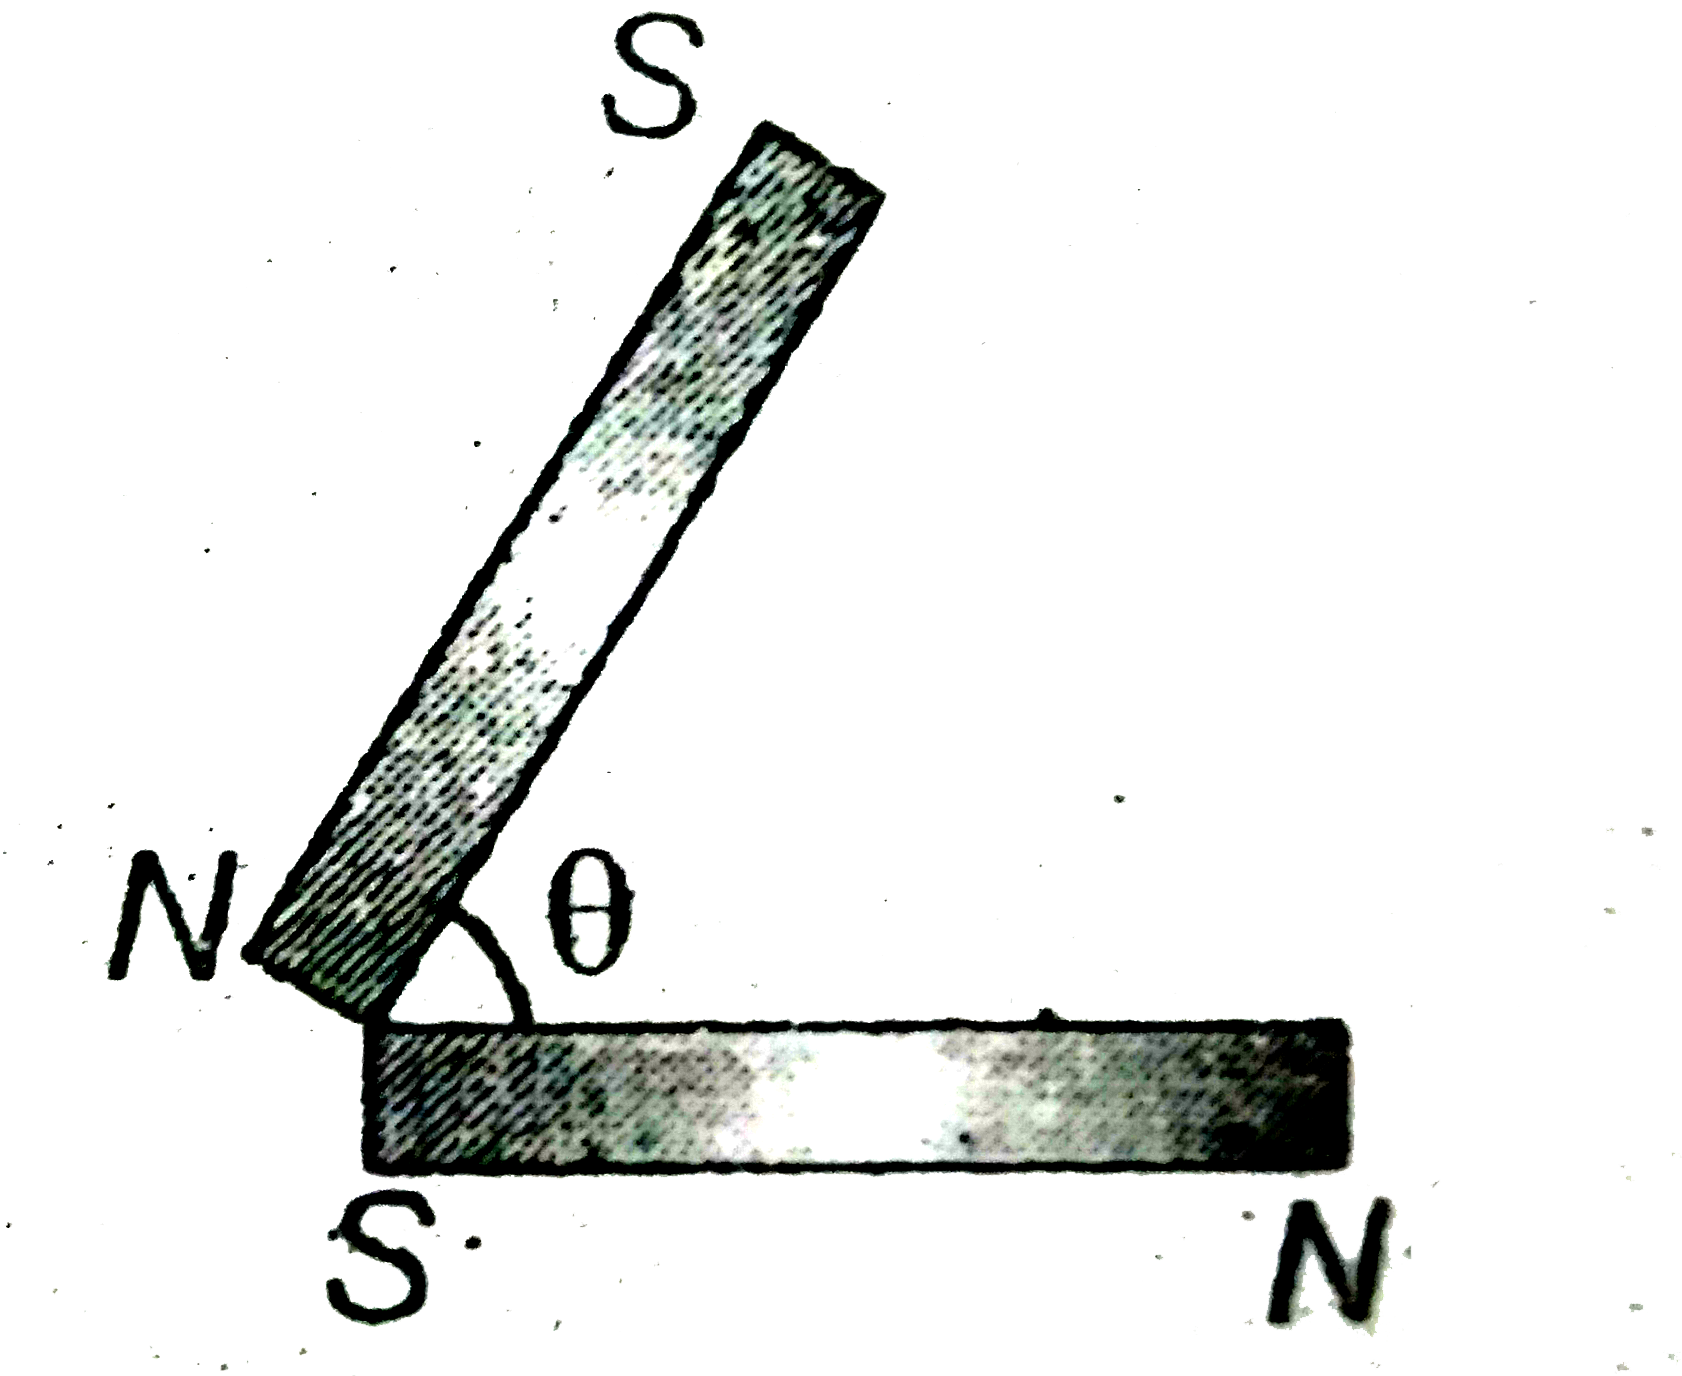
View SolutionTwo magnets of equal magnetic moments M each are placed as shown in figure below . The resultant magnetic moment is M . Then value of θ is
View Solution
