A cylinder is placed on a balance as shown in the figure. Water is poured into the cylinder and the reading of the balance is recorded for different heights of water in the cylinder.
Which graph correctly shows the variation of the balance reading (say m) with the height (say h)?
Which graph correctly shows the variation of the balance reading (say m ) with the height ( say h )?

Text Solution
The correct Answer is:C
When container is put on balance, its reading is m0. When water is poured in it, its reading will change as
m=m0+m1, where m1 is the mass of water.
As mass, = volume × density
= area × height × density
For water, density remains constant and area of the base of container is also constant.
∴ mass ∝ height of the water in container
∴m=m0+pgh
So, according to equation (i), when h = 0, m=m0, i.e., mass of containe.r and after that mass increases with height linearly.
|
Topper's Solved these Questions
- NSO QUESTION PAPER 2017-18 SET-ABOOK - SCIENCE OLYMPIAD FOUNDATION CHAPTER - NSO QUESTION PAPER 2017-18 SET-AEXERCISE - ACHIEVERS SECTION
3 Videos
- NSO MODEL TEST PAPER -1BOOK - SCIENCE OLYMPIAD FOUNDATION CHAPTER - NSO MODEL TEST PAPER -1EXERCISE - ACHIEVERS SECTION
2 Videos
- NSO QUESTION PAPER 2017-18 SET-BBOOK - SCIENCE OLYMPIAD FOUNDATION CHAPTER - NSO QUESTION PAPER 2017-18 SET-BEXERCISE - ACHIEVERS SECTION
3 Videos
Similar Questions
Knowledge Check
The readings of the spring balance will be :
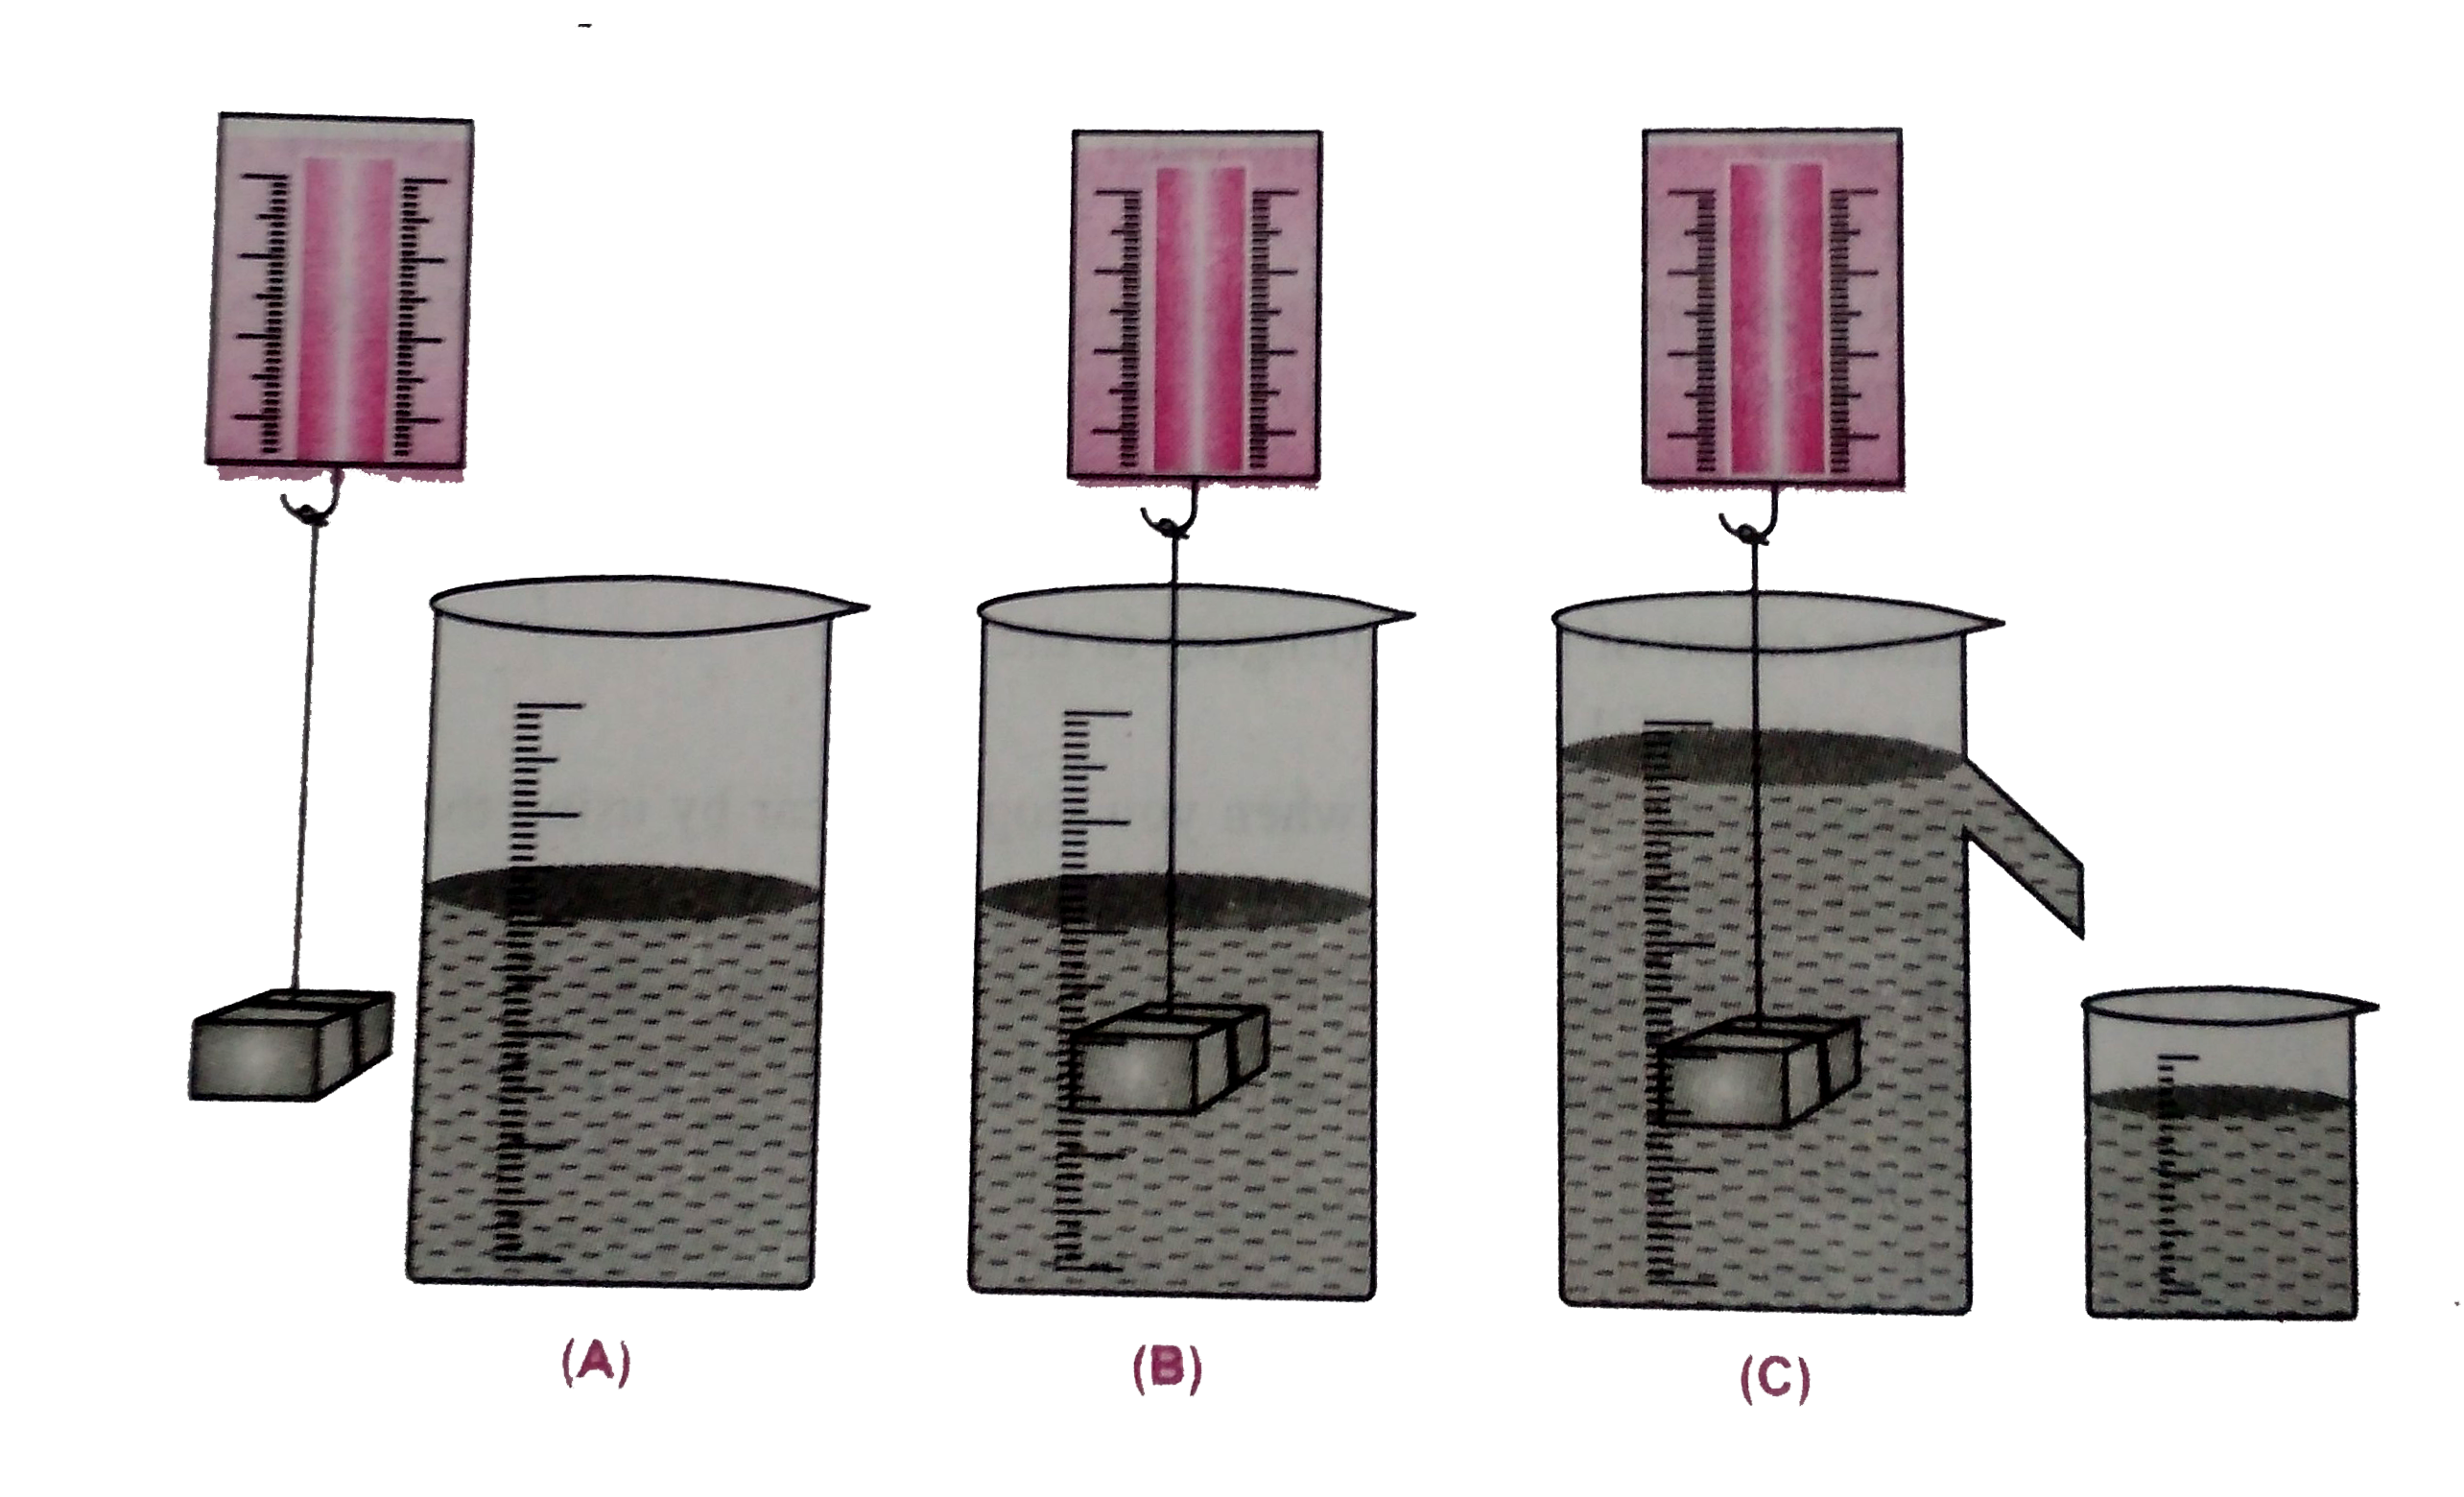 Aequal to each other in all cases A,BandC.Bequal to each other in cases AandC only.Cequal to each other in cases BandC only.Ddifferent in every case.
For the arrangement shown in the figure, the reading of spring balance is
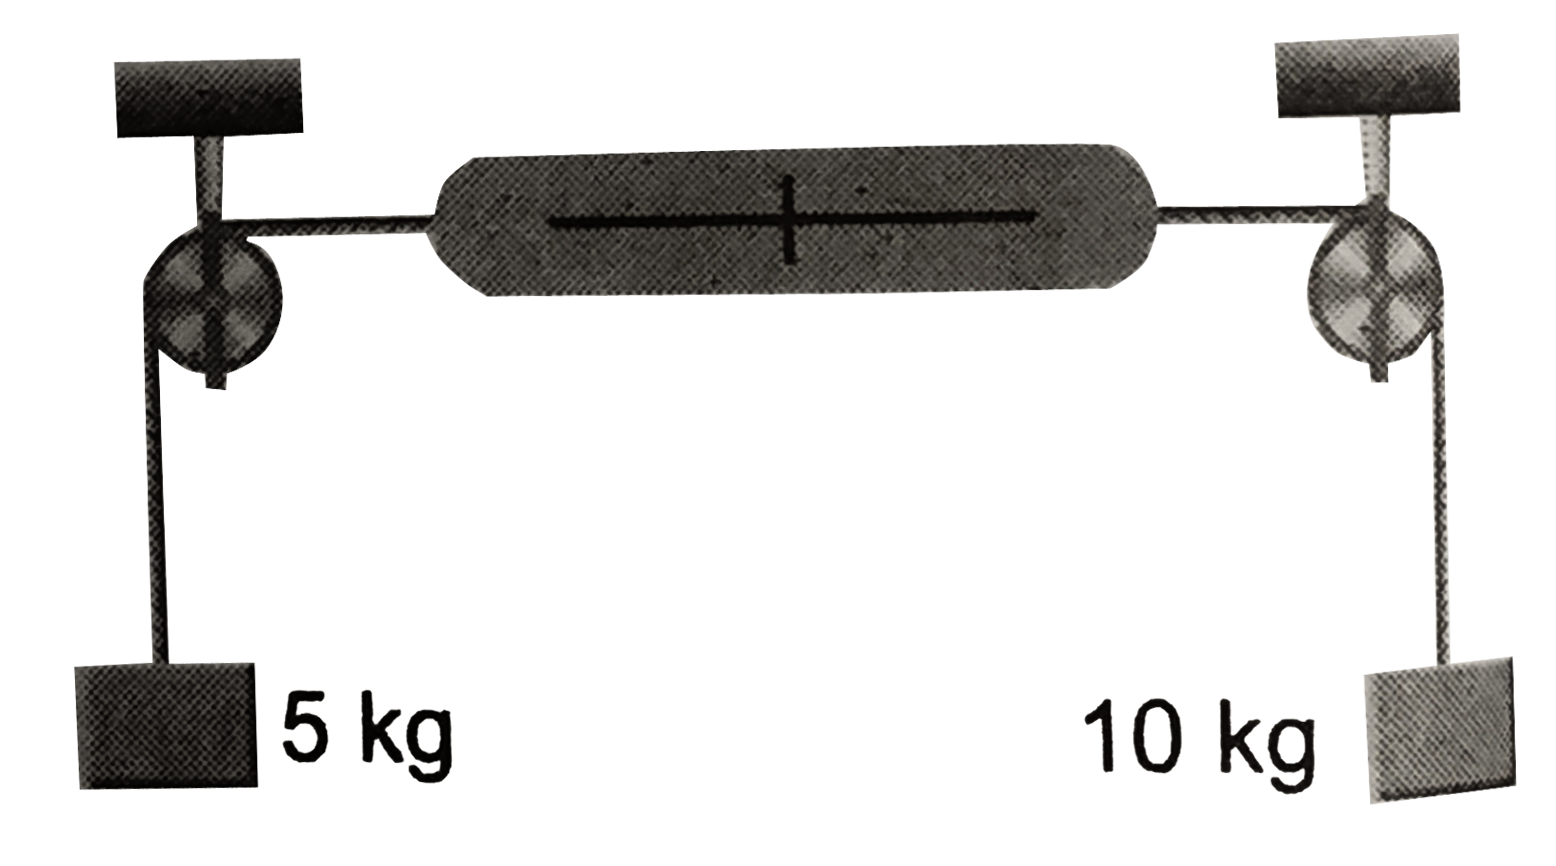 A50NB100NC150NDNone of the above
In the given figure, what is the reading of the spring balance?
 A10 NB20 NC5 NDZero
For the arrangement shown in the figure, the reading of spring balance is

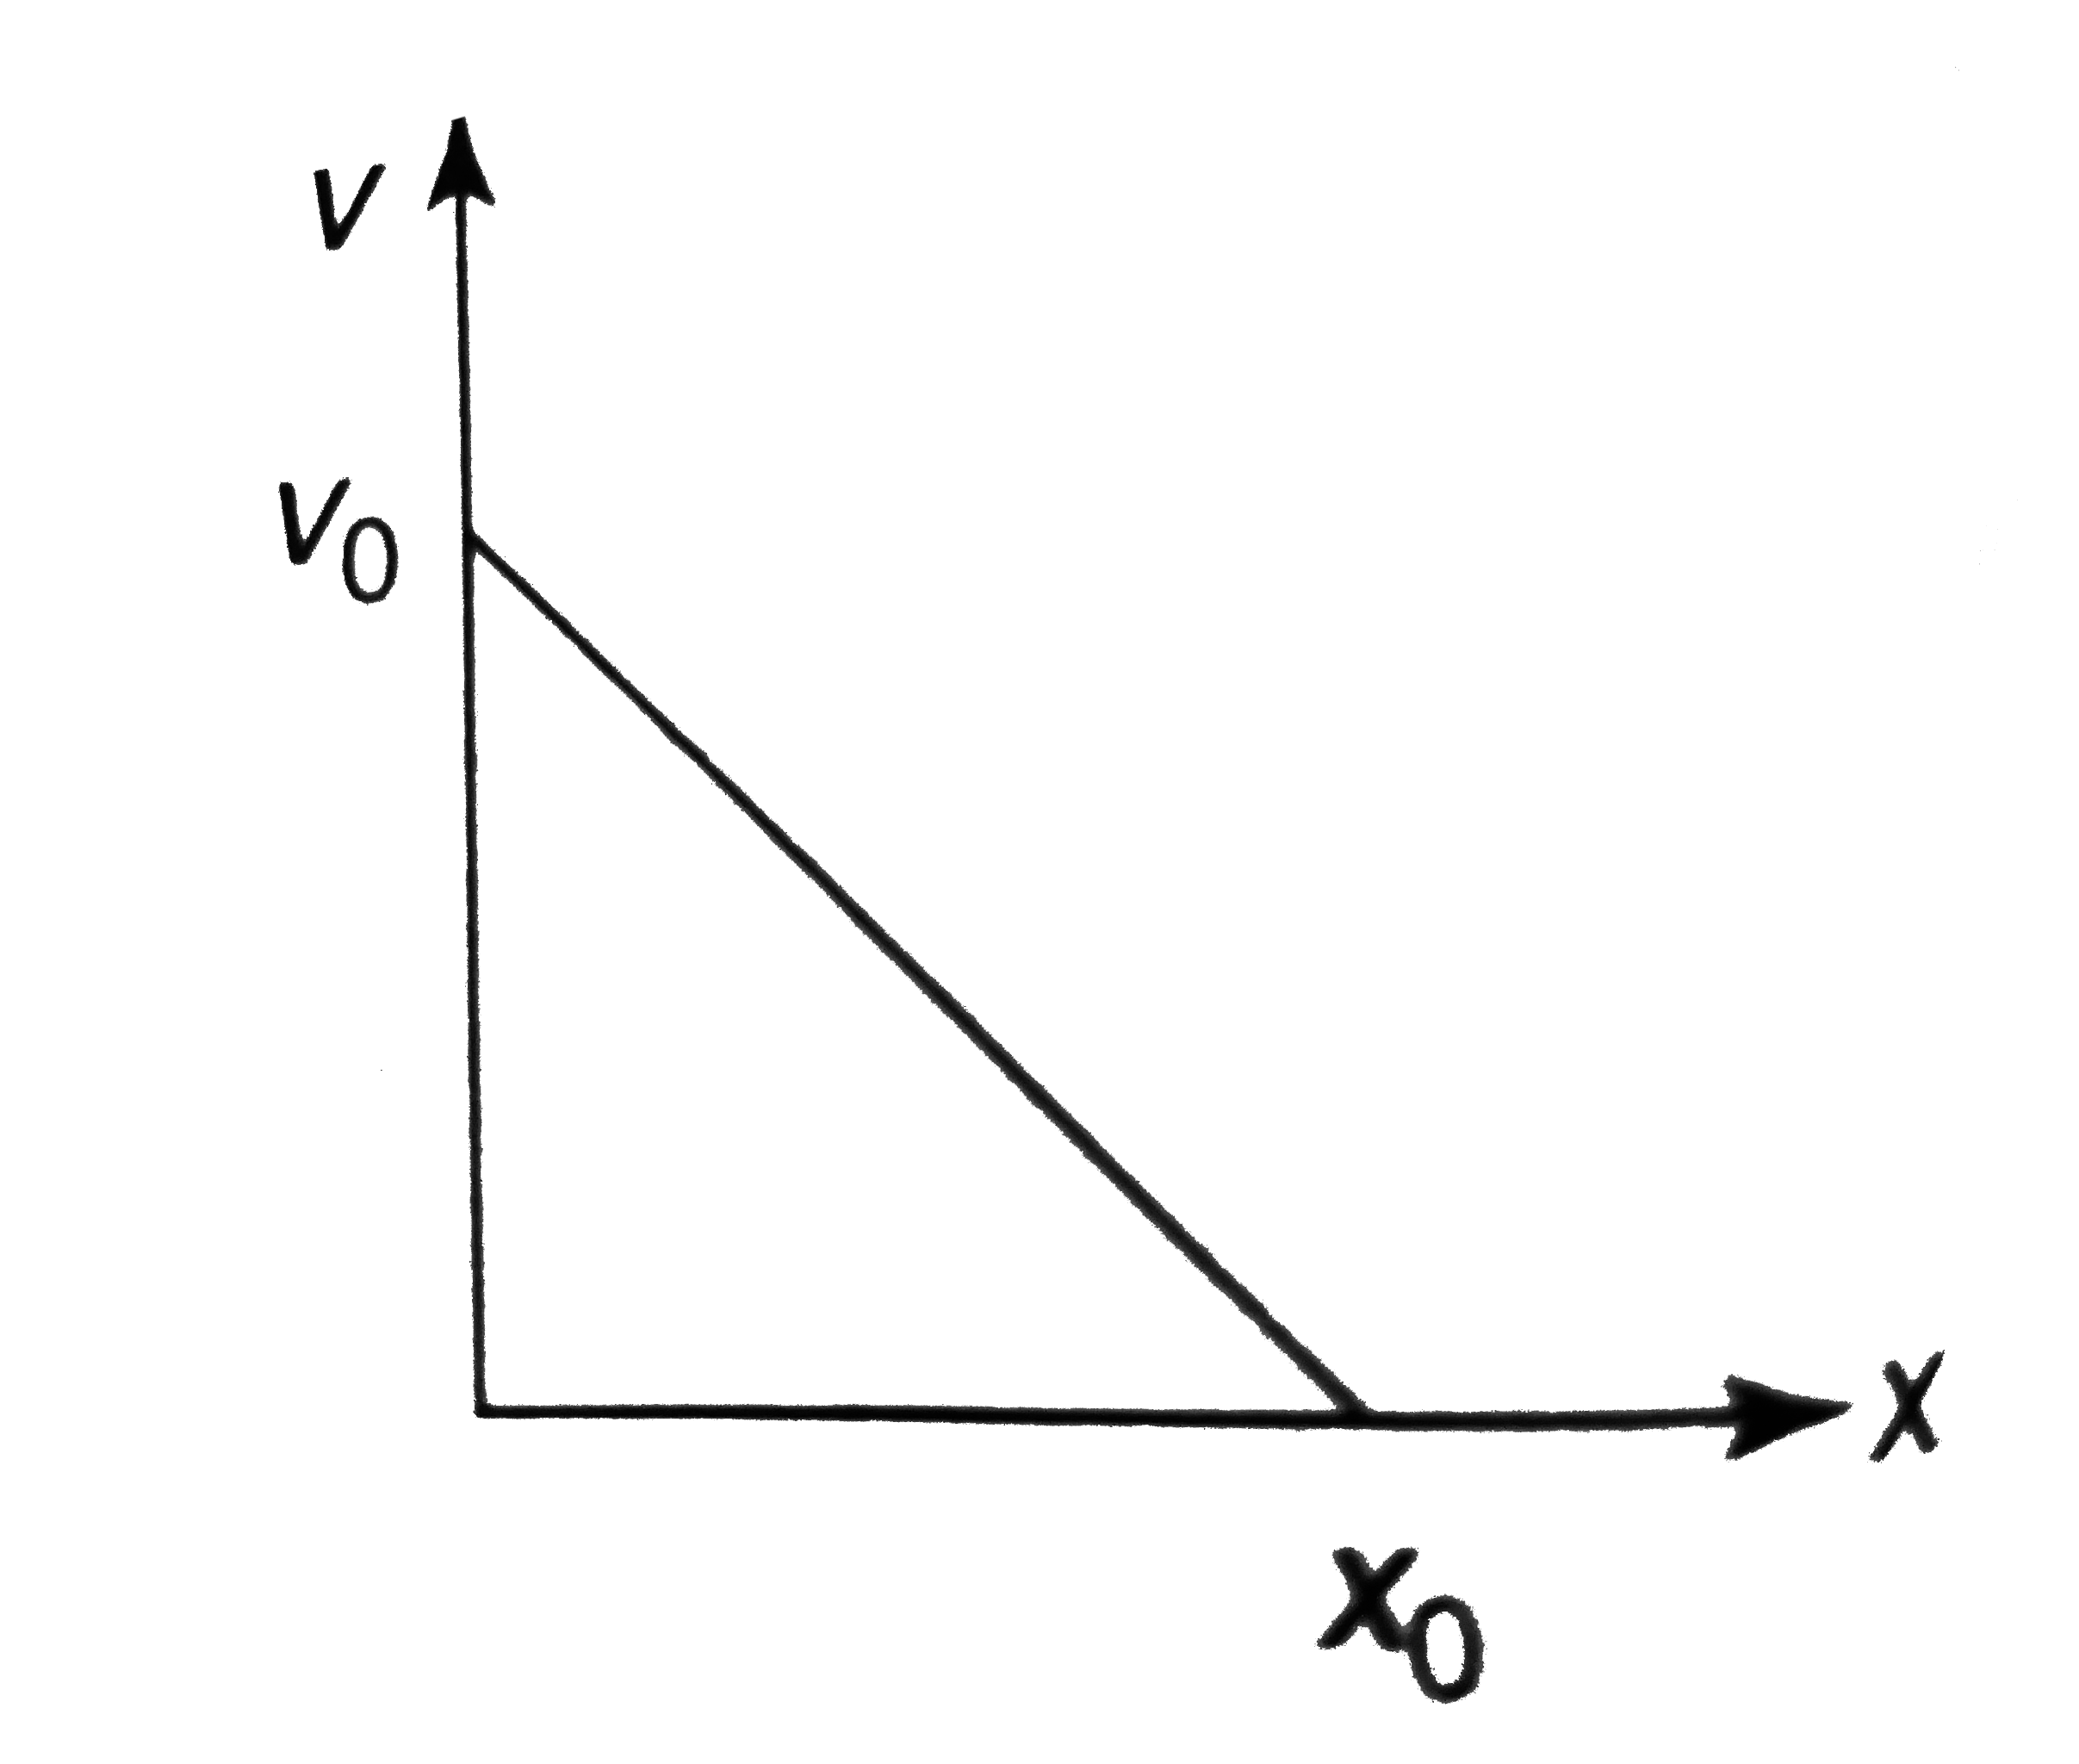
View SolutionThe given graph shows the variation of velocity with displacement. Which one of the graph given below correctly represents the variation of acceleration with displacement :-
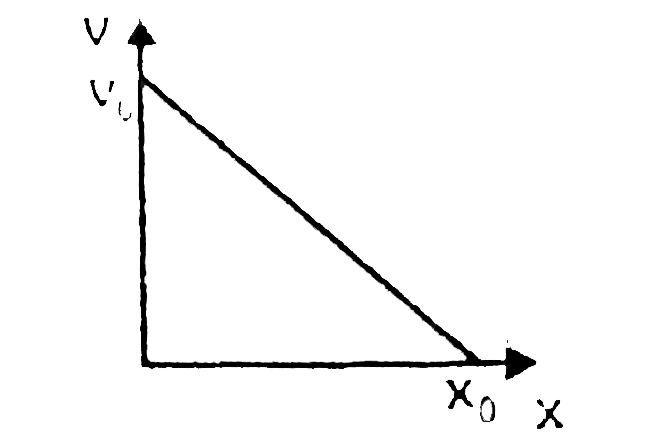
View SolutionThe given graph shows the variation of velocity with displacement. Which one of the graphs given below correctly represents the variation of acceleration with displacement ?
View SolutionTwo 10 kg bodies are attached to a spring balance as shown in figure. The reading of the balance will be:

View SolutionThe given graph shows the variation of velocity with displacement. Which one of the graphs given below correctly represents the variation of acceleration with displacement ?

View Solution


