A force F=t is applied to block A as shown in figure. The force is applied at t=0 seconds when the system was at rest and string is just straight without tension. Which of the following graphs gives the friction force between B and horizontal surface as a function of time 't'.
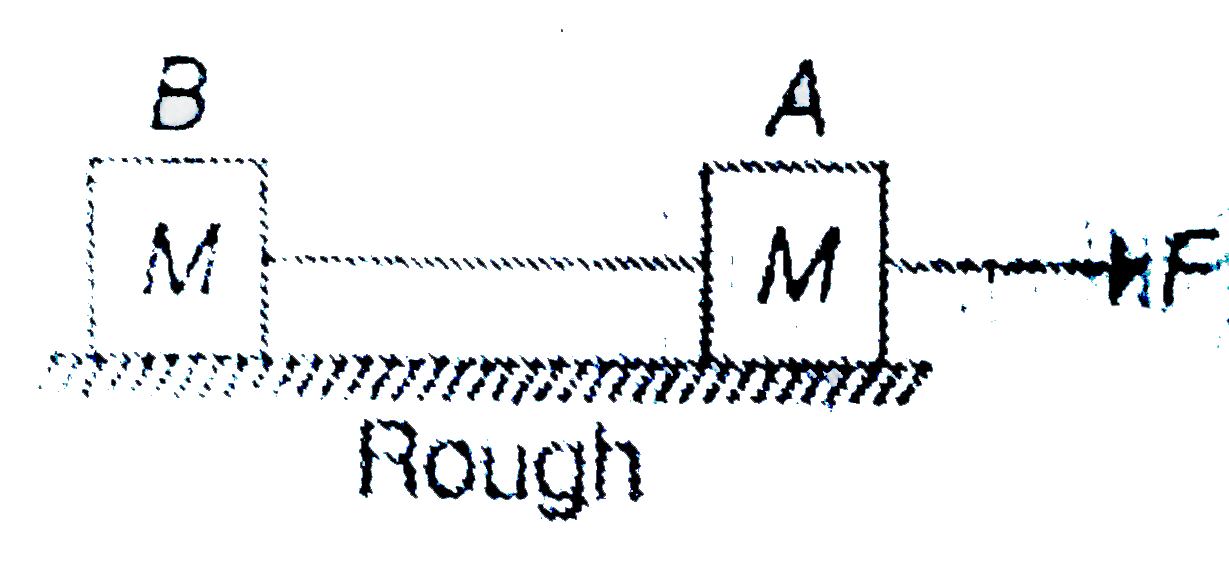
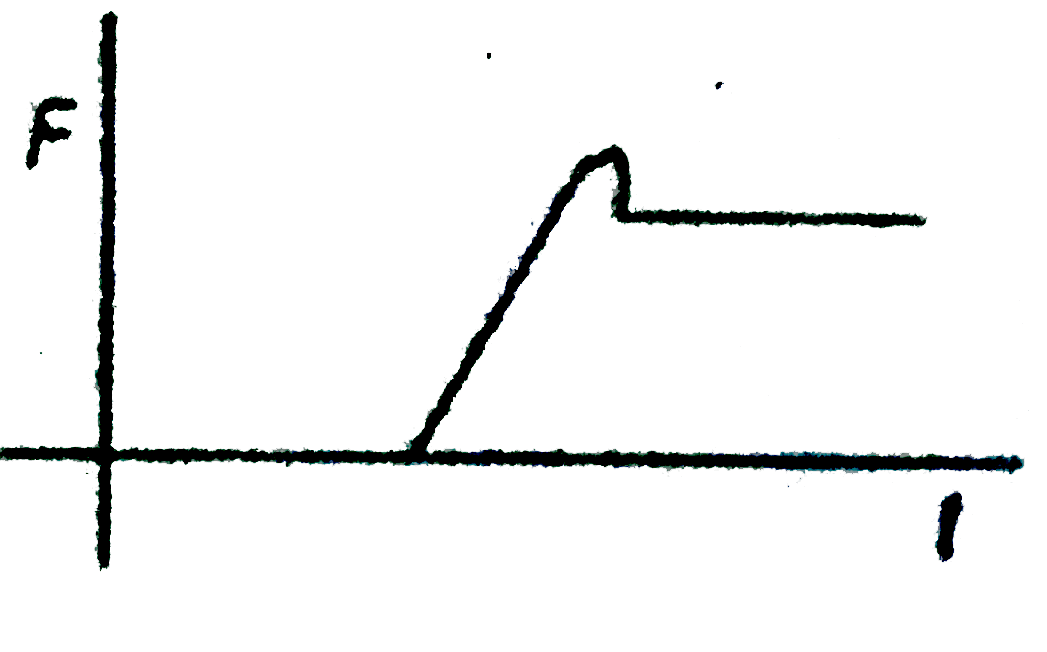
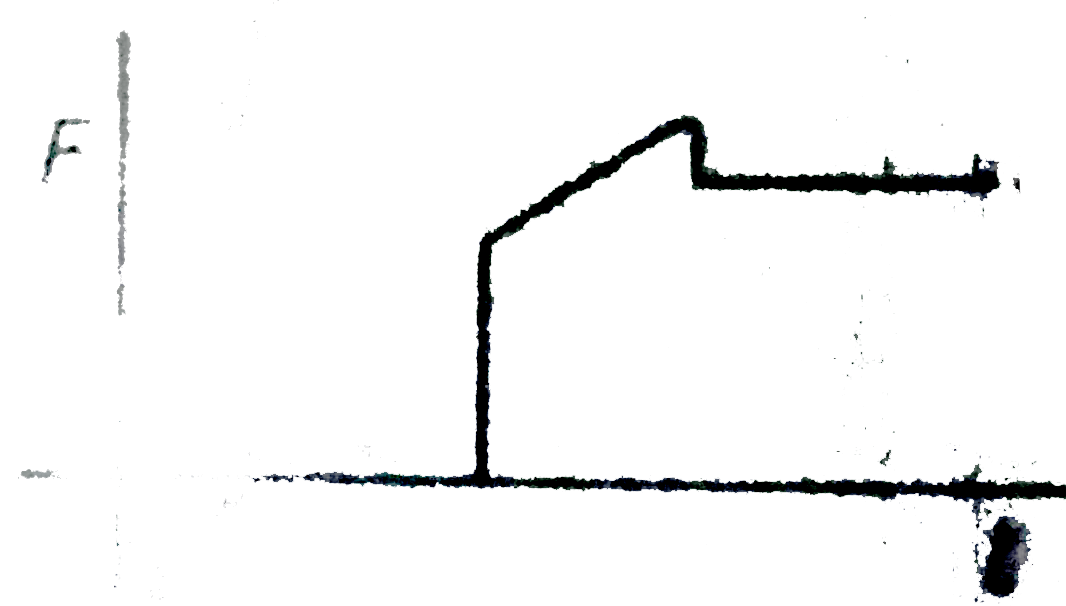
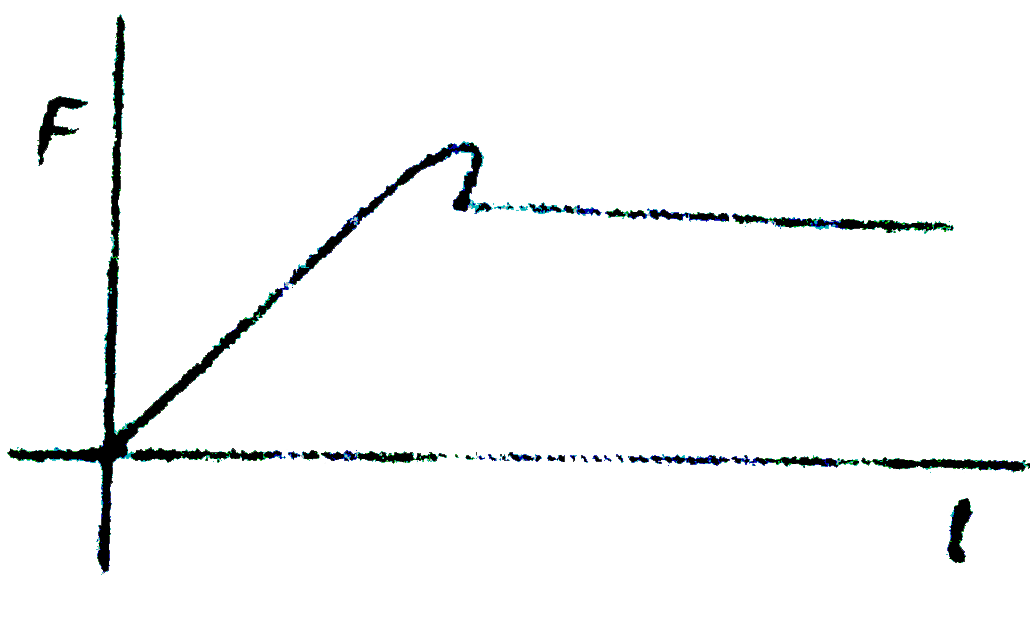
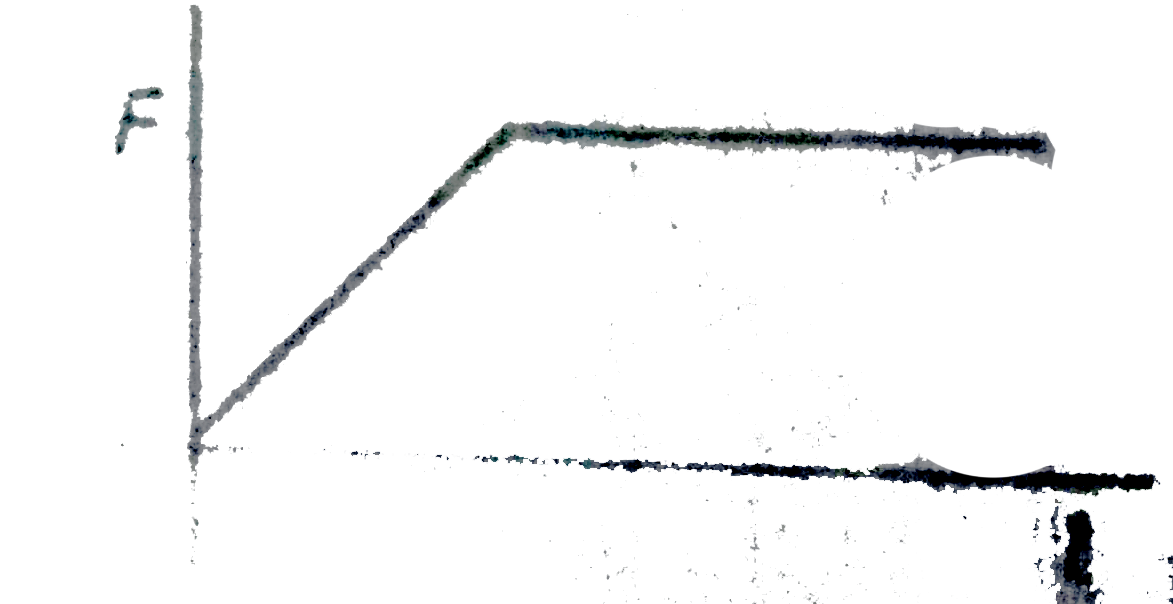
The correct Answer is:A
Step by step video, text & image solution for A force F=t is applied to block A as shown in figure. The force is applied at t=0 seconds when the system was at rest and string is just straight without tension. Which of the following graphs gives the friction force between B and horizontal surface as a function of time 't'. by Physics experts to help you in doubts & scoring excellent marks in Class 11 exams.
Updated on:21/07/2023Similar Questions
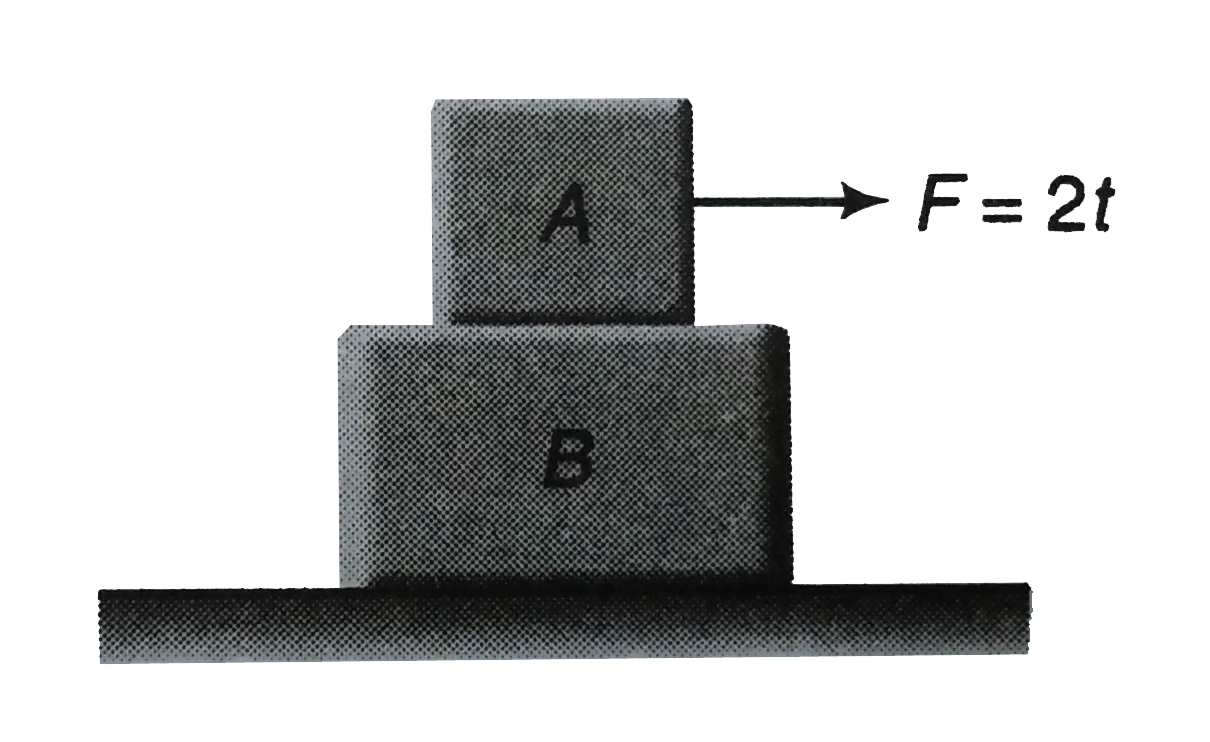
Two blocks A and B of masses 2kg and 4kg are placed one over the other as shown in figure. Atime varying horizontal force F=2t is applied on the upper block as shown in figure. Here t is in second and F is in newton. Drow a graph showing acceleration of A and B on y-axis and time on x-axis.Coefficient of friction between A and B is μ=12 and the horizontal surface over which B is placed smooth. (g=10m/s2)
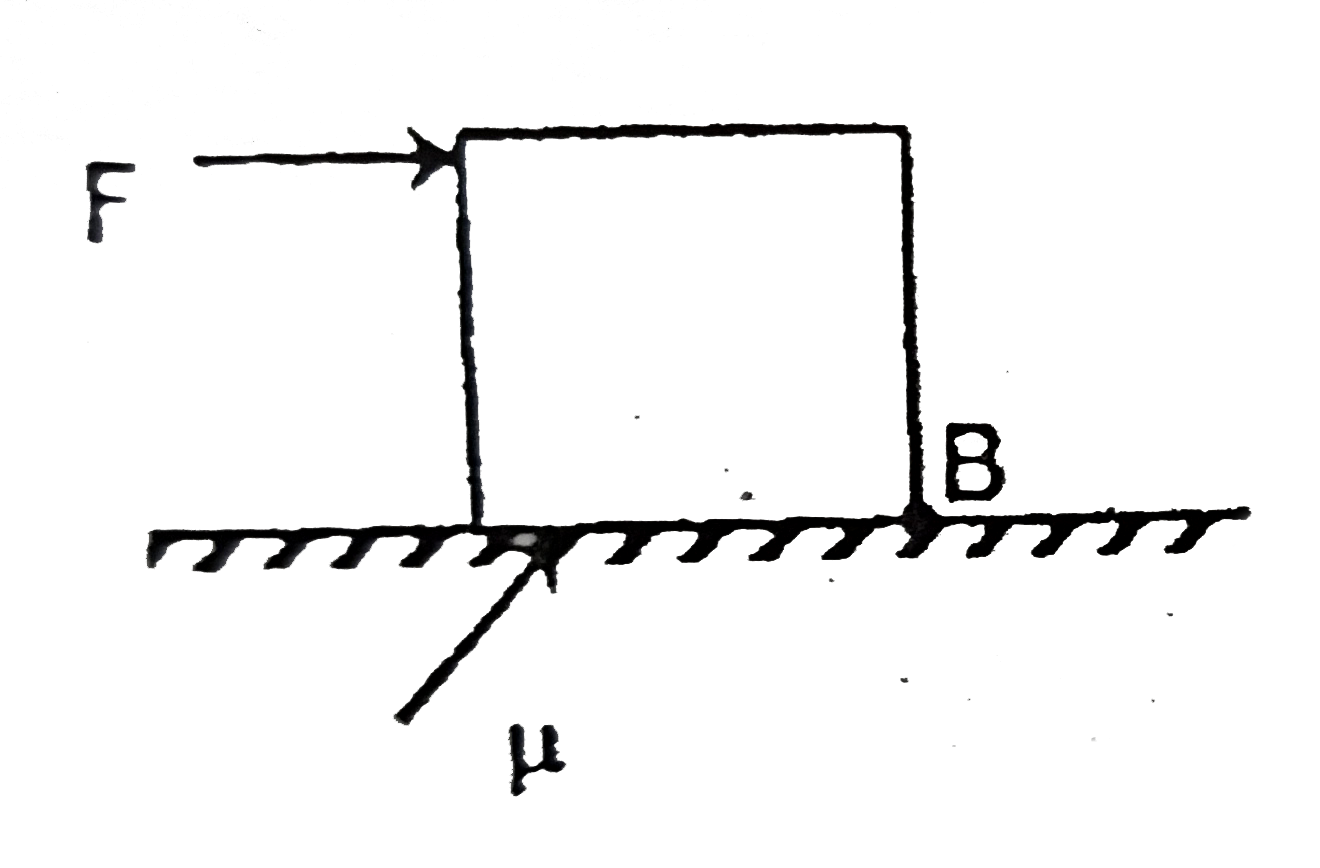
View SolutionA cubical box of side length L rests on a rough horizontal surface having coefficient of friction μ. A variable horizontal force F=αt is applied on the top of the block as shown in figure, where α is a constant and t is time. The coefficient of friction is sufficient so that the block does not slide before toppling. The graph between torque due to normal reaction about end B and time before toppling start is
View Solution
Knowledge Check

A force F=t is applied to a block A as shoen in figure where t is time in seconds. The force is applied at t=0 seconds when the system was at rest. Which of the following graph correctly gives the frictional force between A and horizontal surface an a function of time t. [Assume that at t=0, tension in the string connecting the two blocks is zero].A B
B C
C D
D
A force shown in the F−x graph is applied to a 2kg block horizontal as shown in figure. The change in kinetic energy is
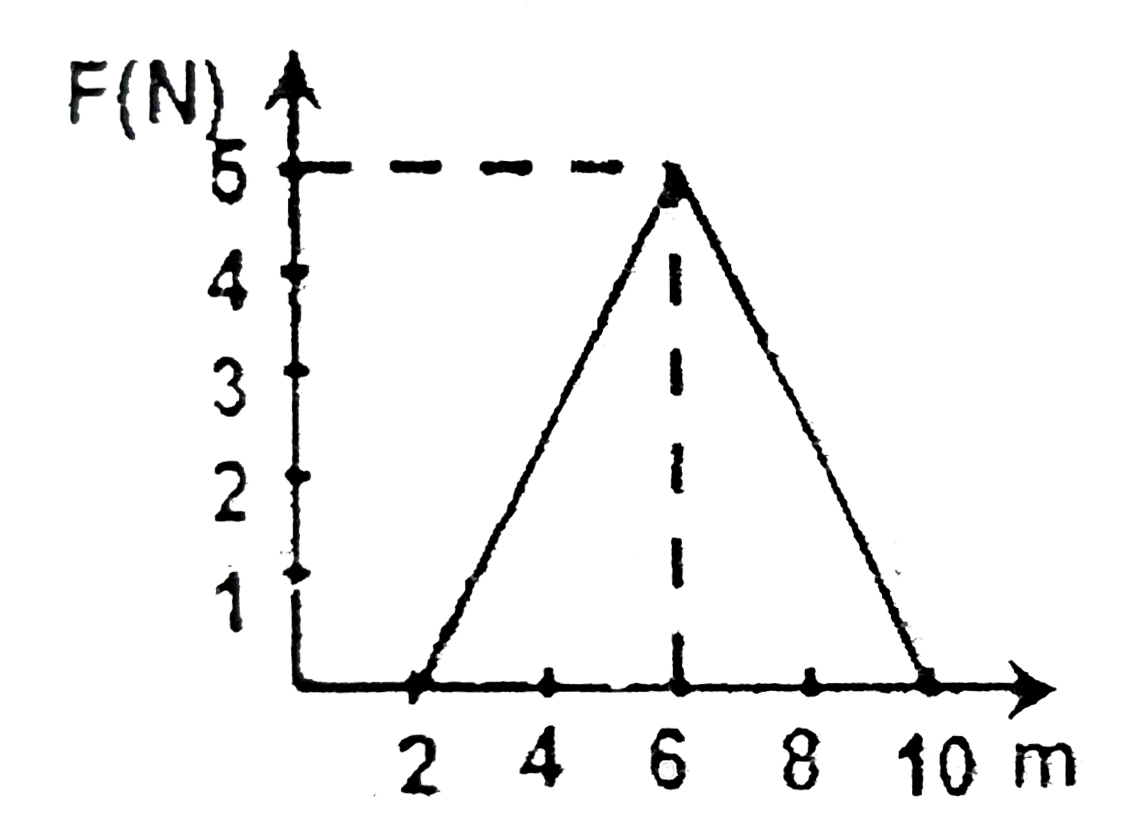 A15JB20JC25JD30J
A time varying force F=2t is applied on a spool as shown in figure. The angular momentum of the spool at time t about bottommost point is
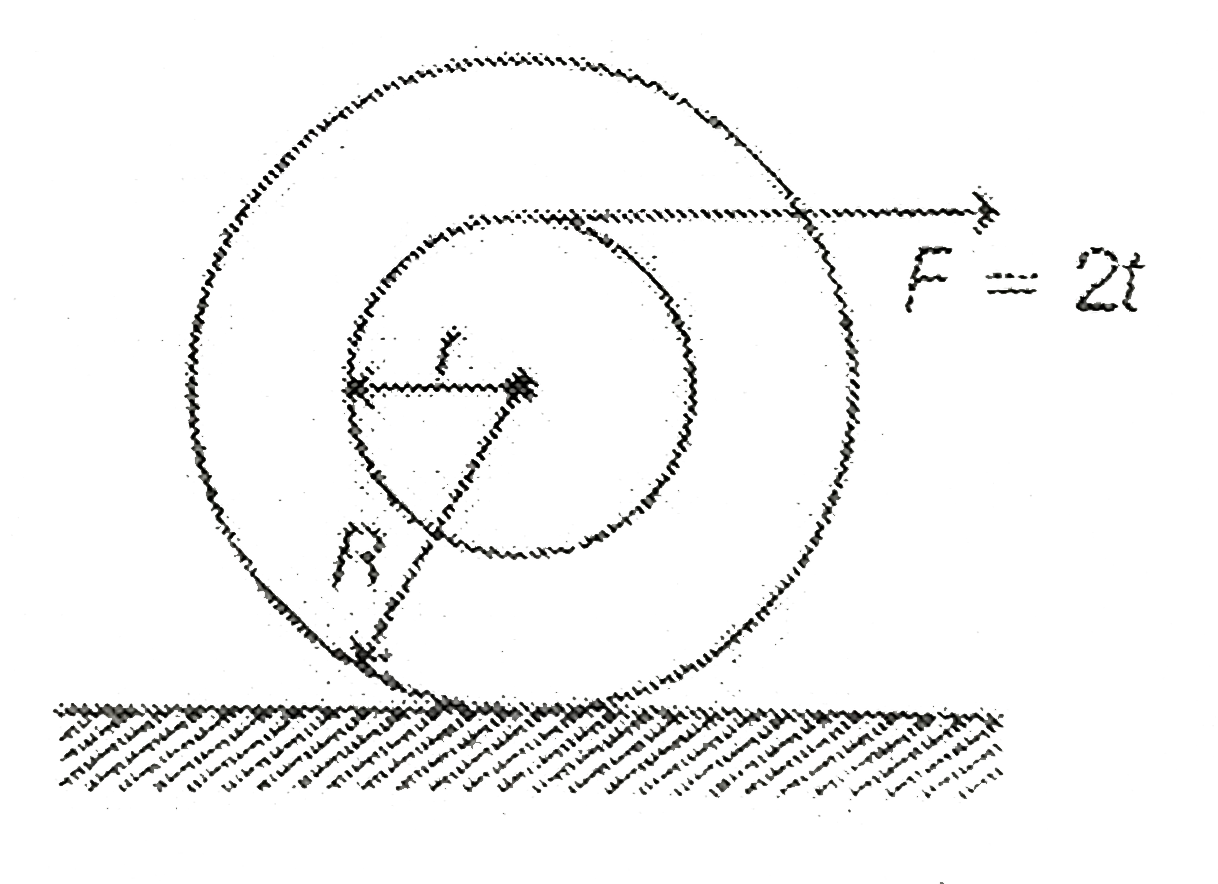 Ar2t2RB(R+r)2rt2C(R+r)t2DData insufficent
A time varying force F=2t is applied on a spool as shown in figure. The angular momentum of the spool at time t about bottommost point is:
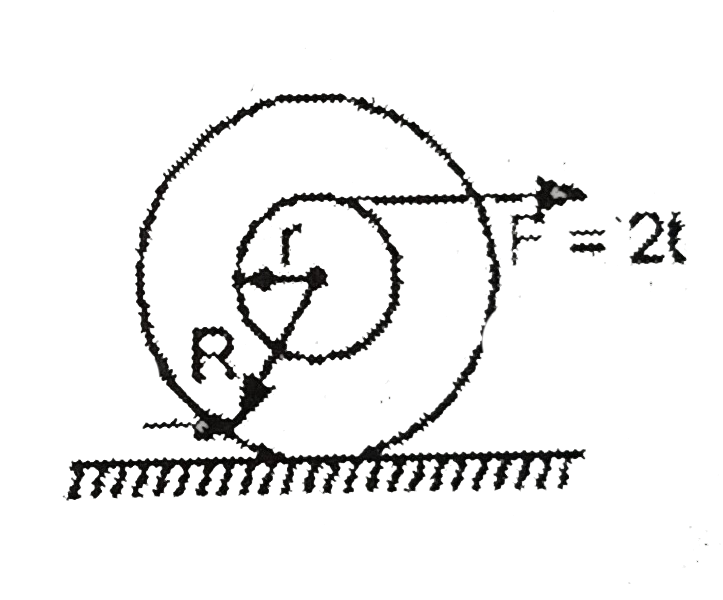
View Solution
A force F=2t is spplied at t=0 sec to the block of mass m placed on a rough horizontal surface. The coefficient of static and kinetic friction between the block and surface are μS and μk rspectively. Which of the following graphs best represents the acceleration vs time of the block(μS>μk)?
View SolutionA cubical box of side length L rests on a rough horizontal surface having coefficient of friction μ. A variable horizontal force F=αt is applied on the top of the block as shown in figure, where α is a constant and t is time. The coefficient of friction is sufficient so that the block does not slide before toppling. The graph between torque due to normal reaction about end B and time before toppling start is

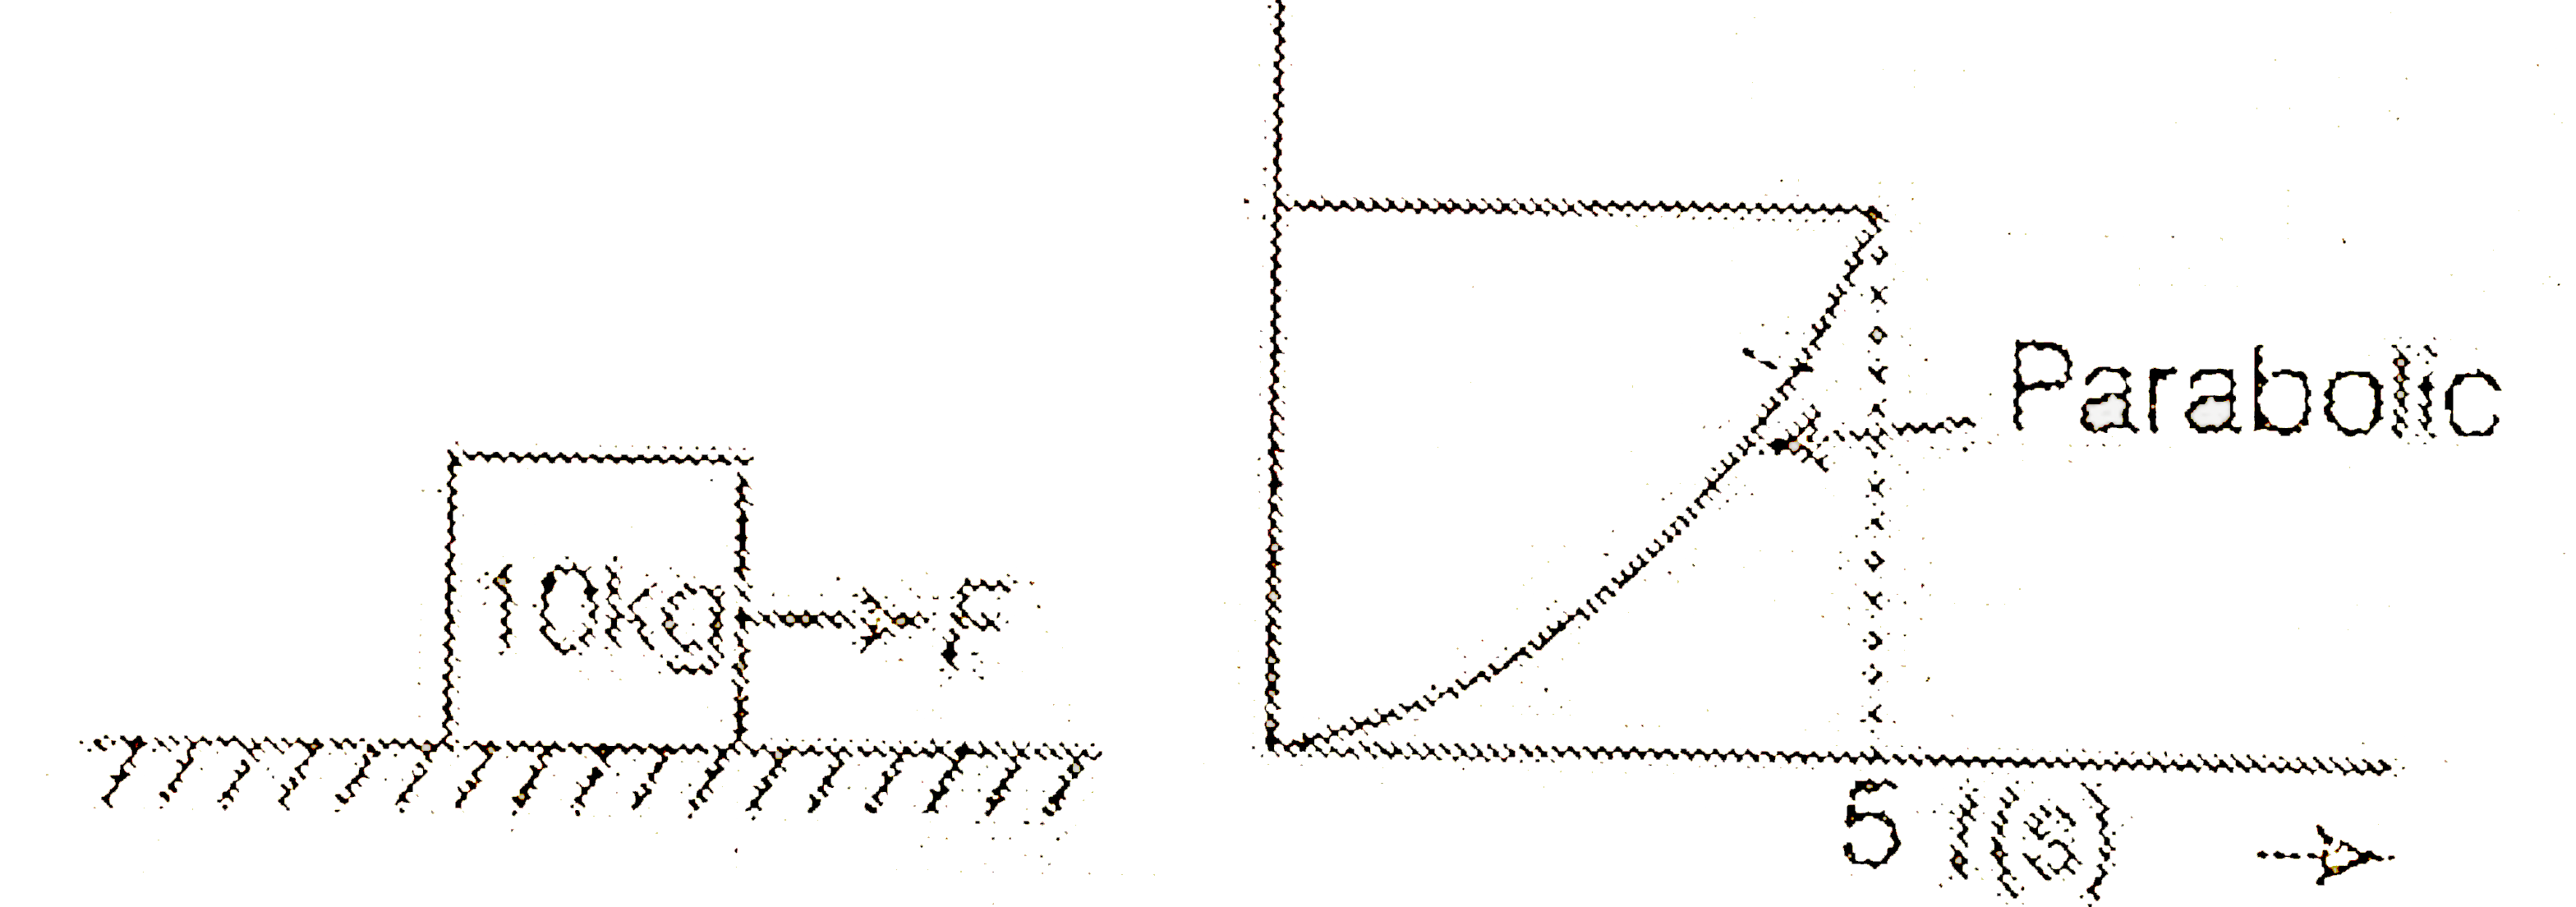
View SolutionA force F is applied to the initially, stationary cart. The variation of force with time is shown in the figure. The speed of cart at t = 5 s is
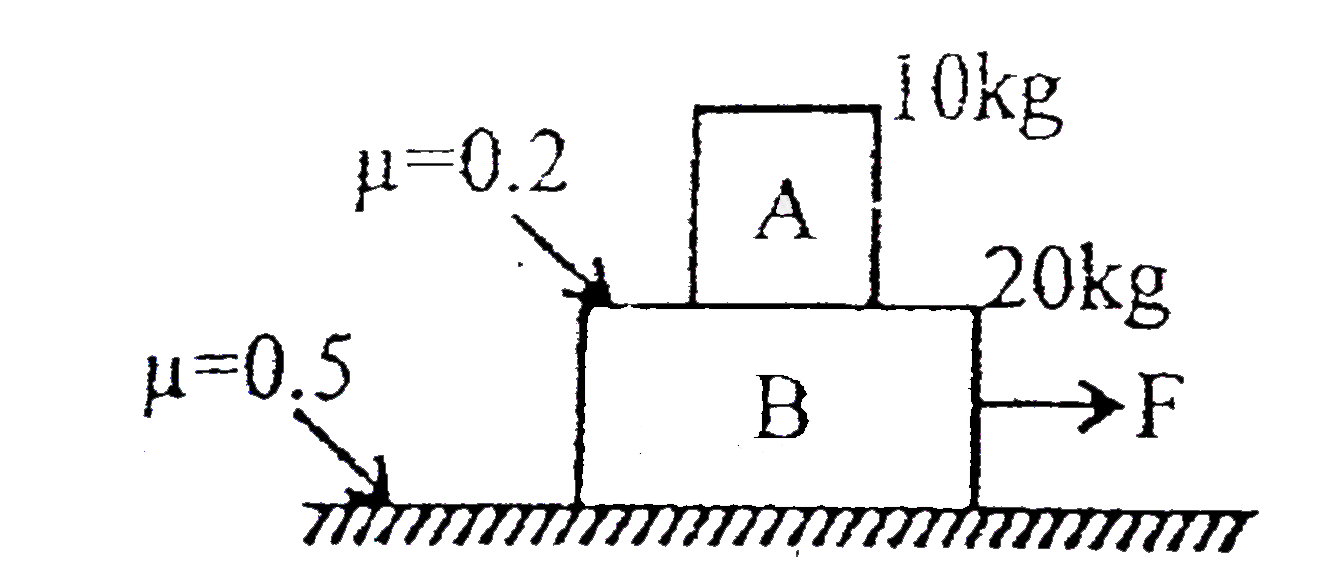
View SolutionTwo blocks A and B are as shown in figure. The minimum horizontal force F applied to the block B for which slipping behins between B and ground is :
View Solution
