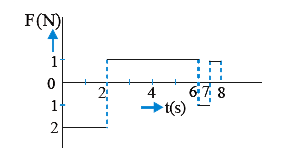
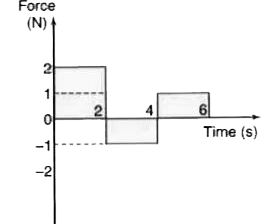
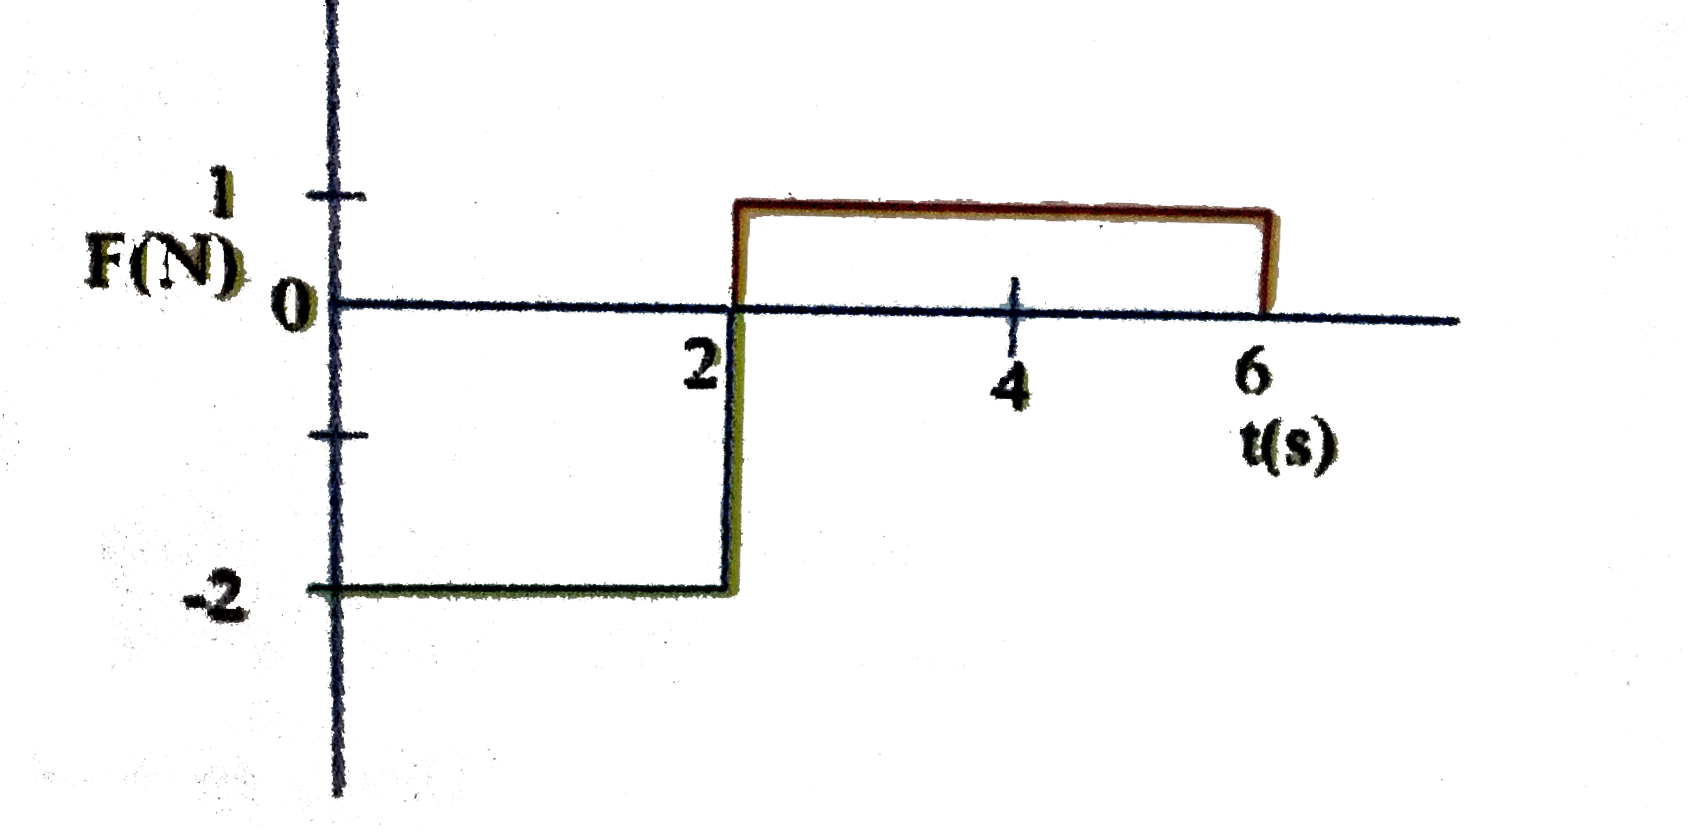
A force-time graph for a linear motion is shown in figure. The linear momentum gained between 0 and 6 second is
A
2Ns
B
4Ns
C
6Ns
D
Zero
Video Solution
Text Solution
The correct Answer is:B
Momentum gained = Force time = Algebraic sum of the areas enclosed by force-time graphs with time -axis.
|
Topper's Solved these Questions
- MISCELLANEOUS QUESTIONSBook:MCGROW HILL PUBLICATIONChapter:MISCELLANEOUS QUESTIONSExercise:PART-B
Explore 99 Videos
- MEASUREMENTBook:MCGROW HILL PUBLICATIONChapter:MEASUREMENTExercise:ELEMENTARY QUESTIONS (HIGHER ORDER THINKING QUESTIONS)
Explore 13 Videos
- MOTIONBook:MCGROW HILL PUBLICATIONChapter:MOTIONExercise:HIGHER ORDER THINKING QUESTIONS
Explore 48 Videos
Similar Questions
Knowledge Check
A force-time graph for the motion of a body is shown in figure. Change in linear momentum between 0 and 8 s is:
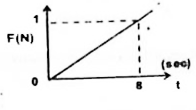 AZeroB4 N-sC8 NsDNone of these
A force time graph for the motion of a body is as shown in figure. Change in linear momentum between 0 and 6s is
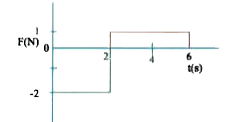 AzeroB8 NsC4 NsD2 Ns
A force-time graph for the motion of a body is shown in fig. change in linear momentum between 0 and 8 s is:-
 AZeroB4N-sC8NsDNone
A force time graph for the motion of a body is as shown in Change in linear momentum between 0 and 6s is
 .
.
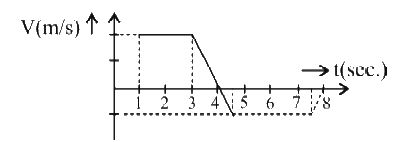
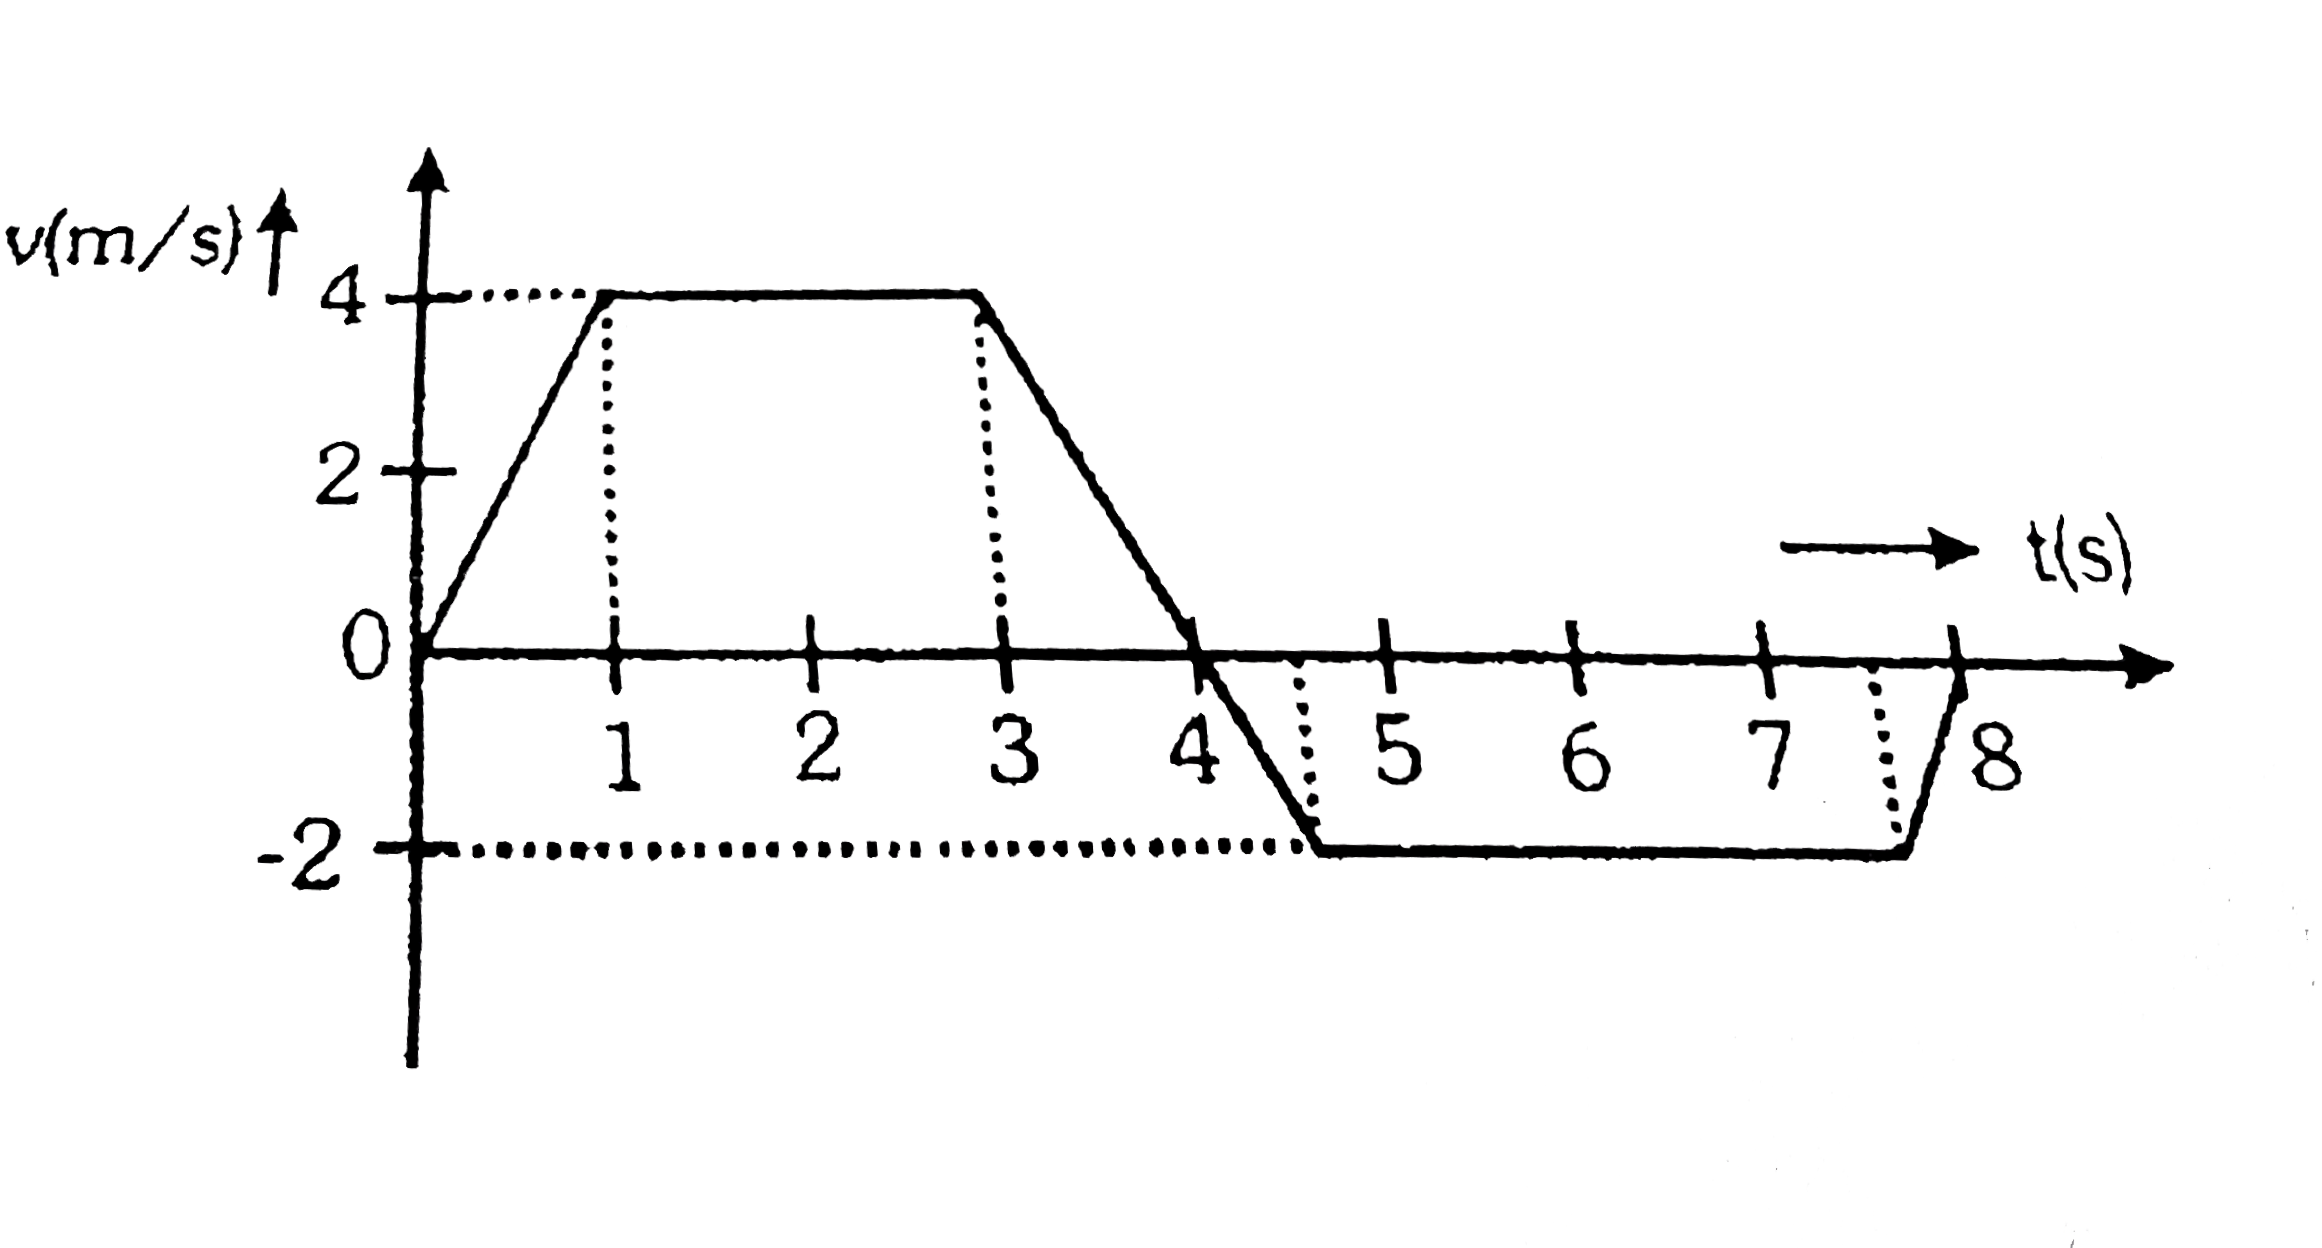
View SolutionThe v-t graph of a linear motion is shown in adjoining figure. The distance from origin after 8 seconds is -
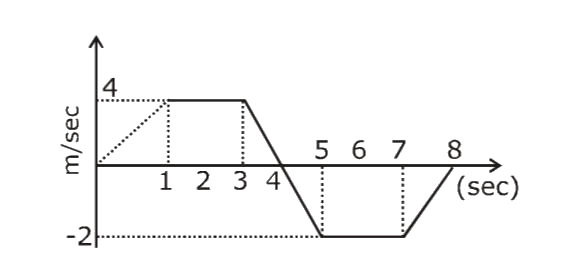
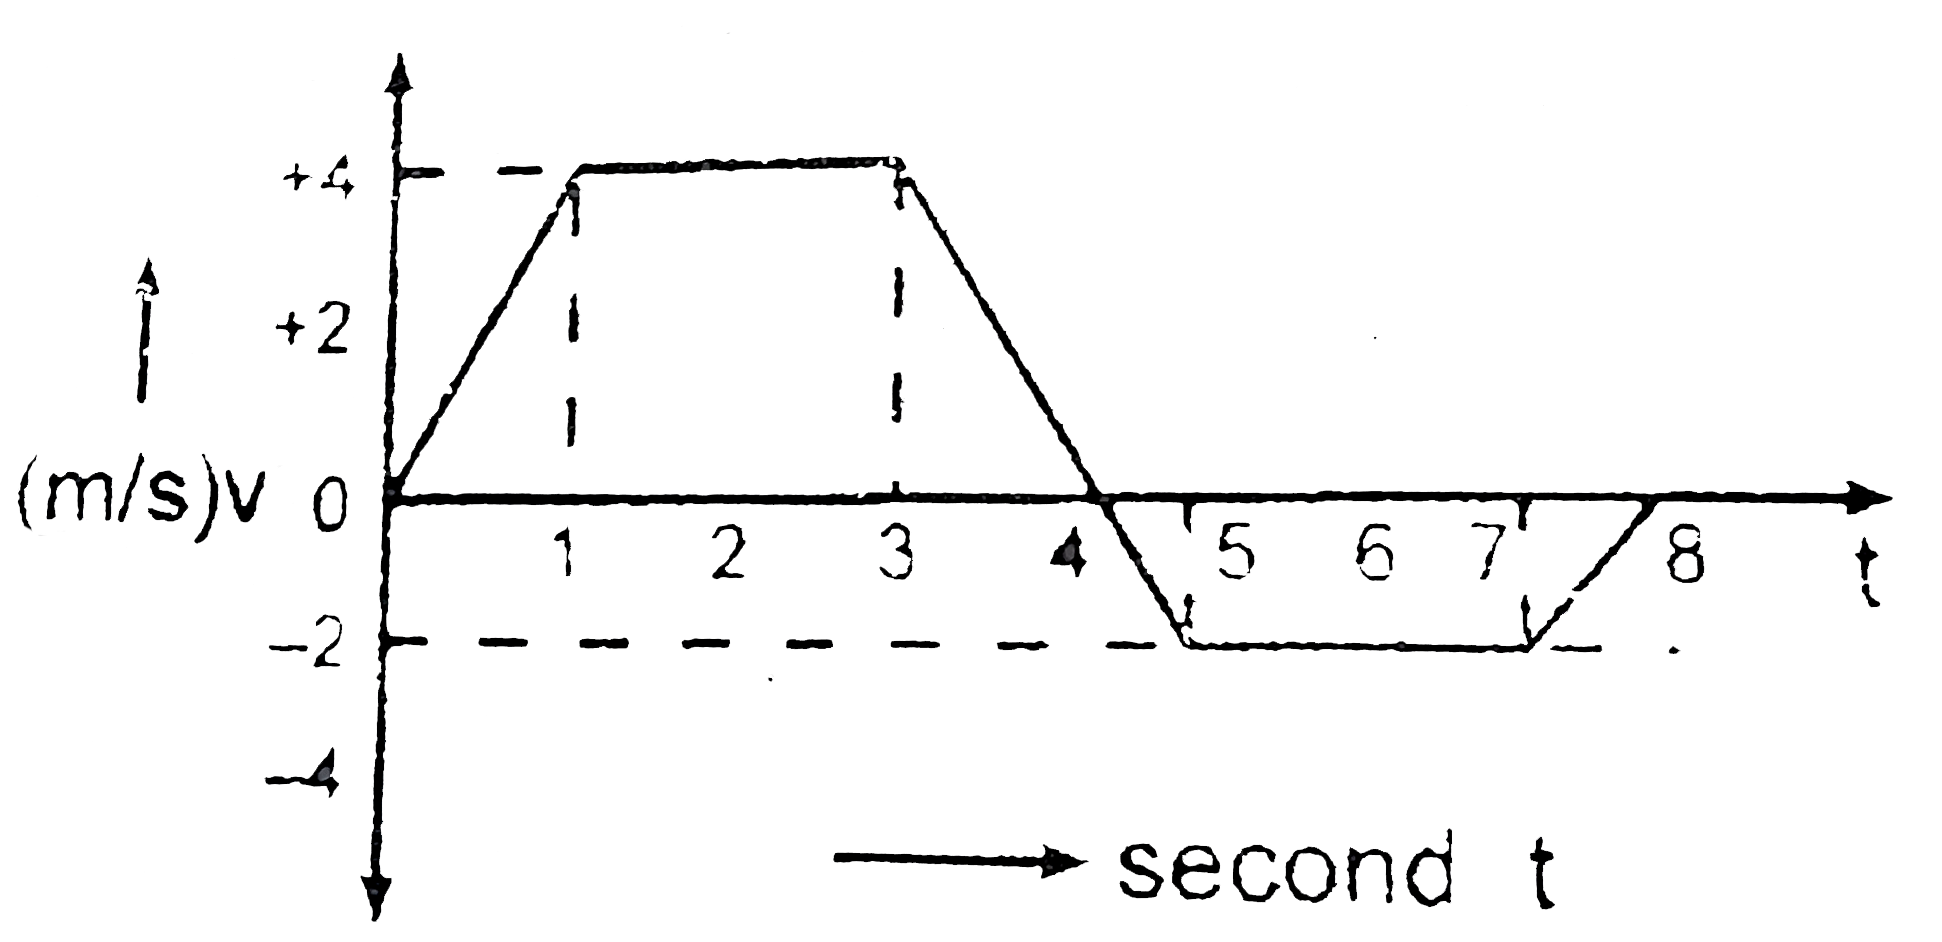
View SolutionThe velocity time graph of a linear motion is shown in the figure. The distance from the starting point after 8 seconds will be
 .
.
View SolutionThe velocity-time graph of a linear motion is shown in figure. The displacement & distance from the origin after 8 sec is :-
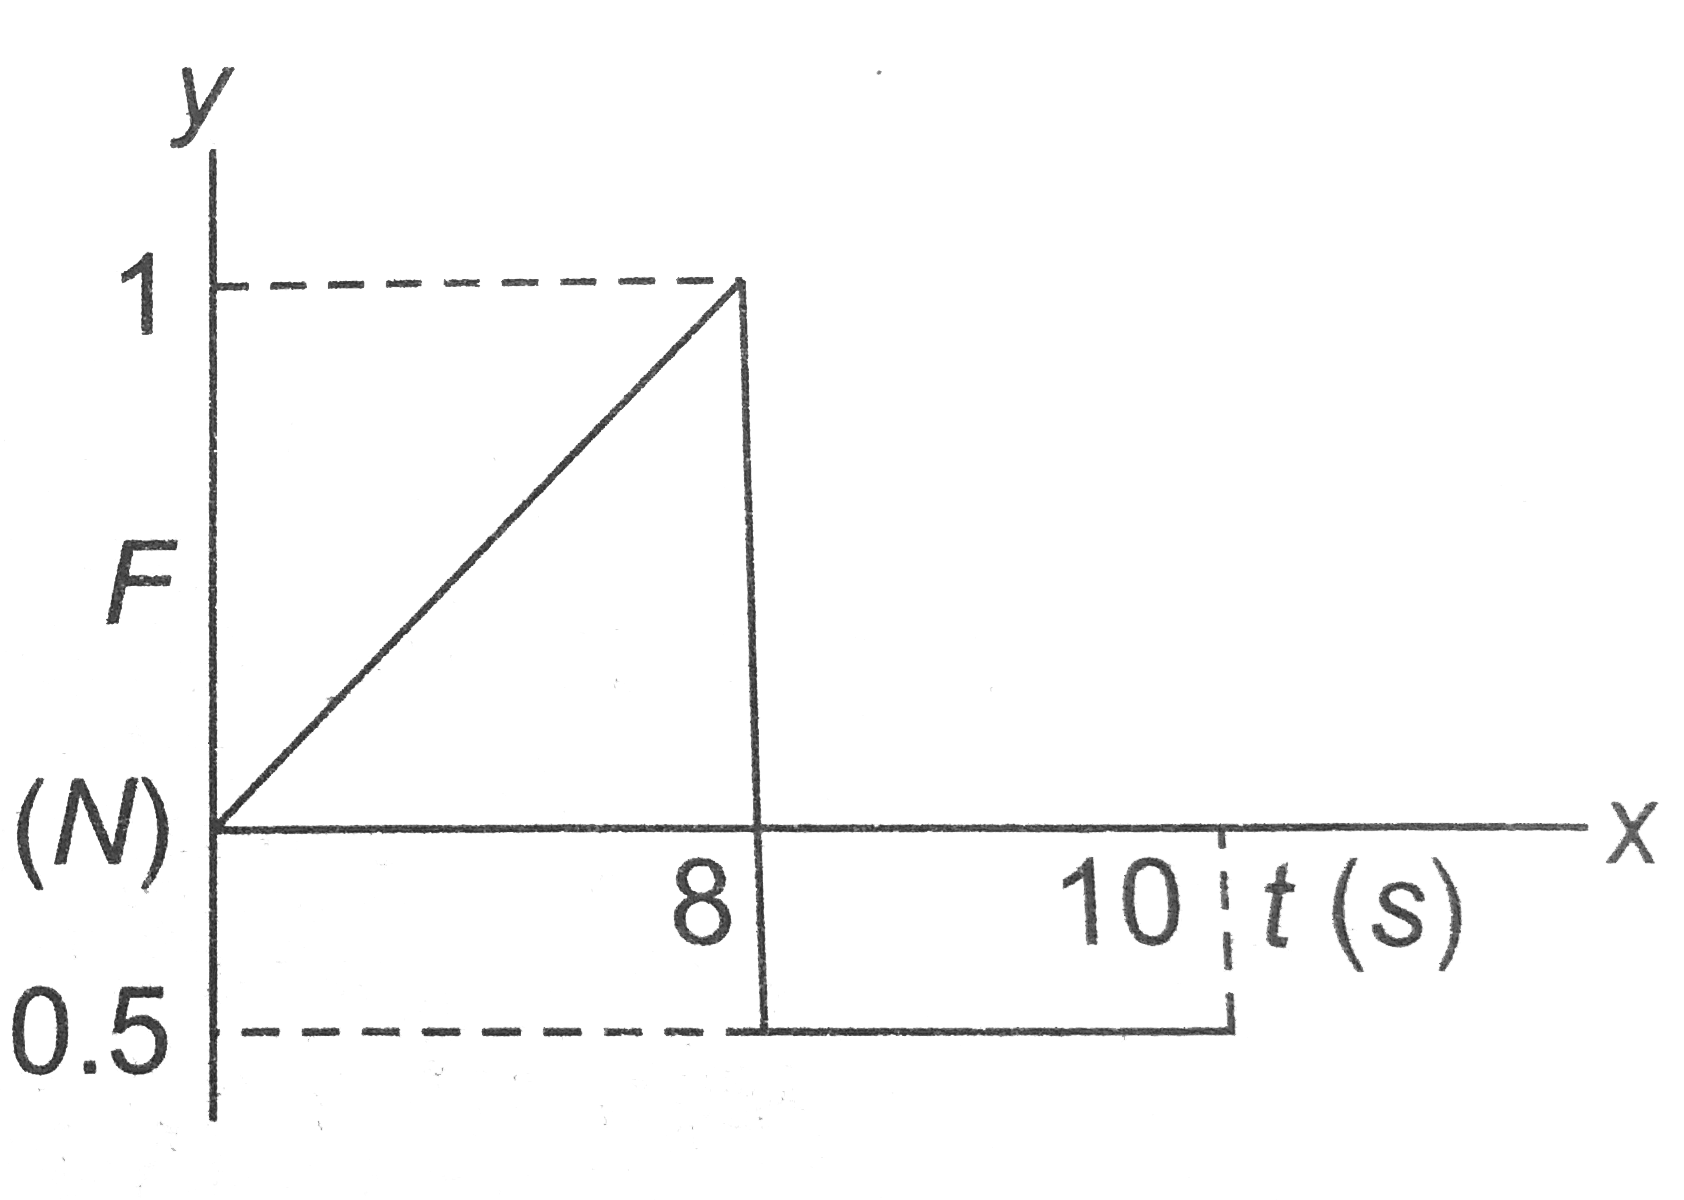
View SolutionA force-time graph for the motion of a body is shown in the figure. The change in the momentum of the body between zero and 10sec is
View Solution
