A graph of acceleration versus time of a particle starting from rest at t=0 is as shown in figure. The speed of the particle at t=14s is
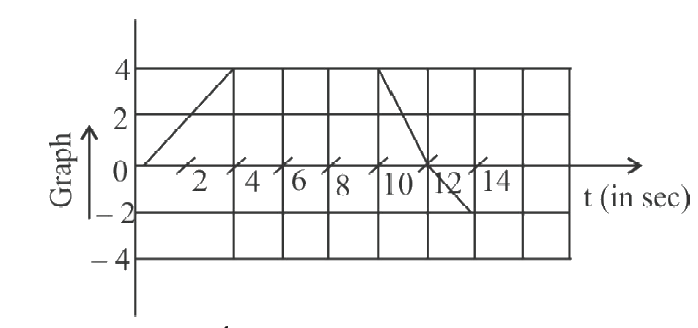
2ms−1
34ms−1
20ms−1
42ms−1
The correct Answer is:B
Step by step video, text & image solution for A graph of acceleration versus time of a particle starting from rest at t=0 is as shown in figure. The speed of the particle at t = 14s is by Physics experts to help you in doubts & scoring excellent marks in Class 12 exams.
Updated on:21/07/2023Similar Questions
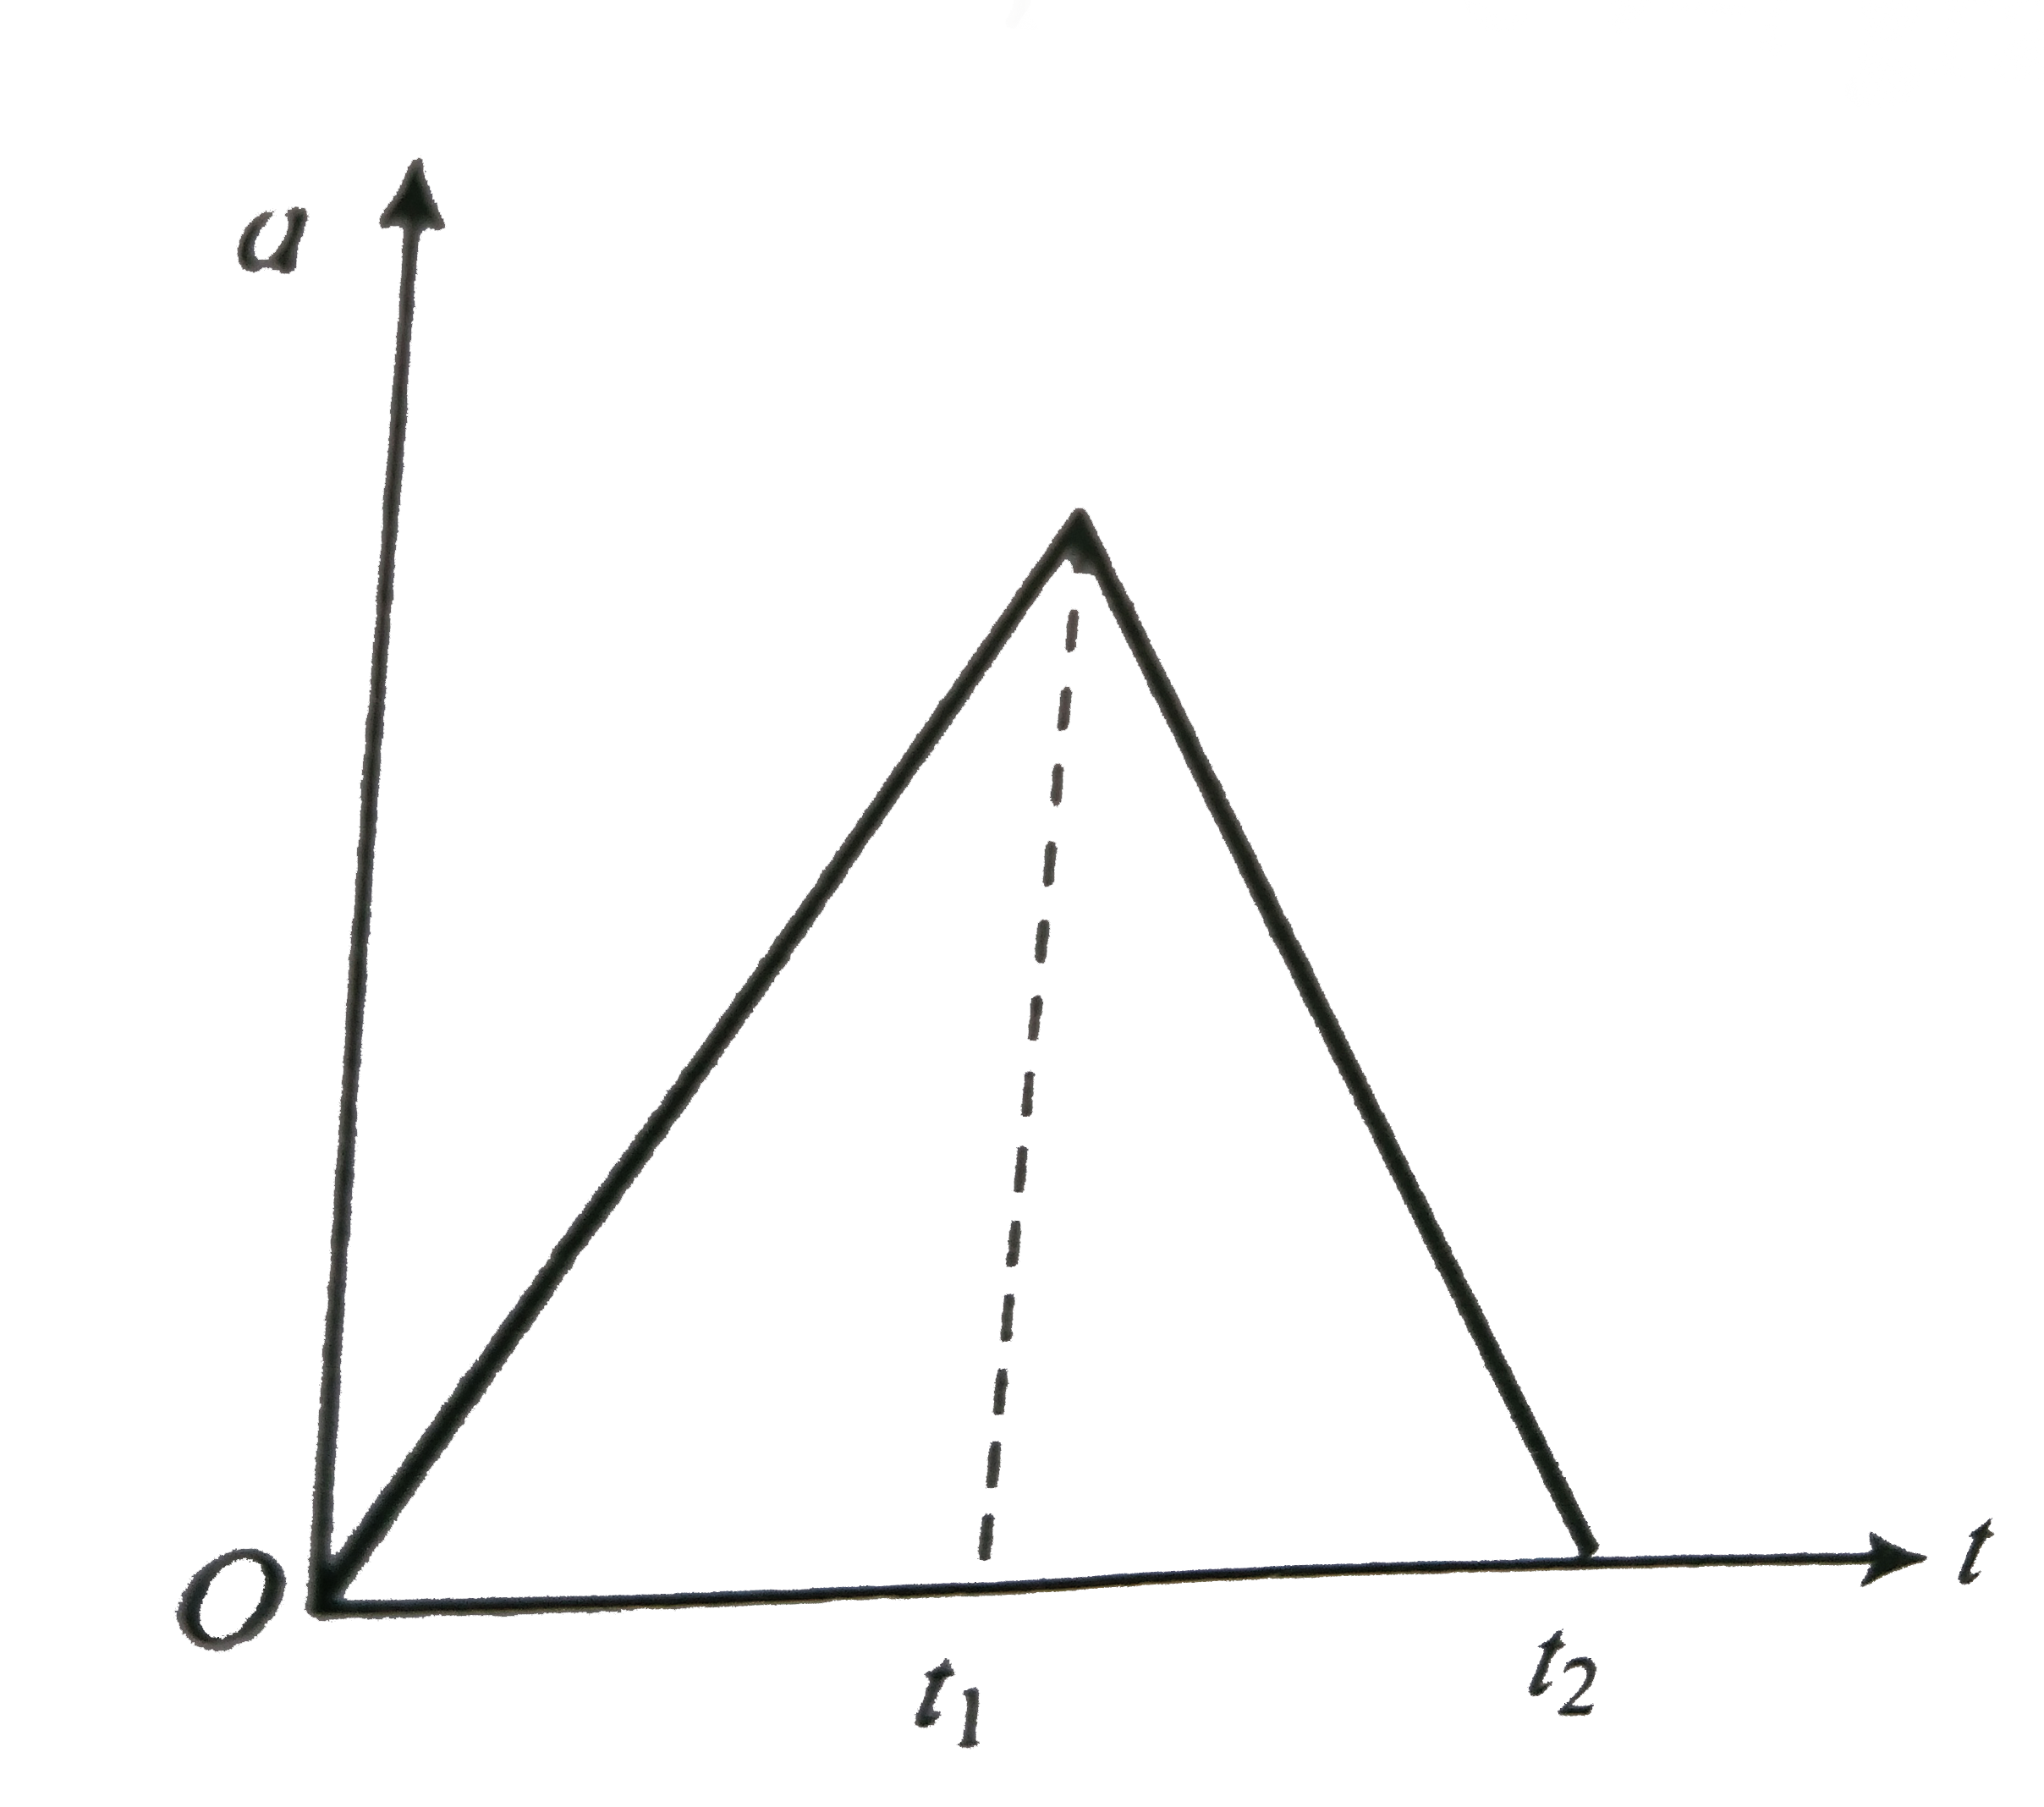
The acceleration versus time graph of a particle is shown in the figure. The respective v−t graph of the particle is .
 .
.
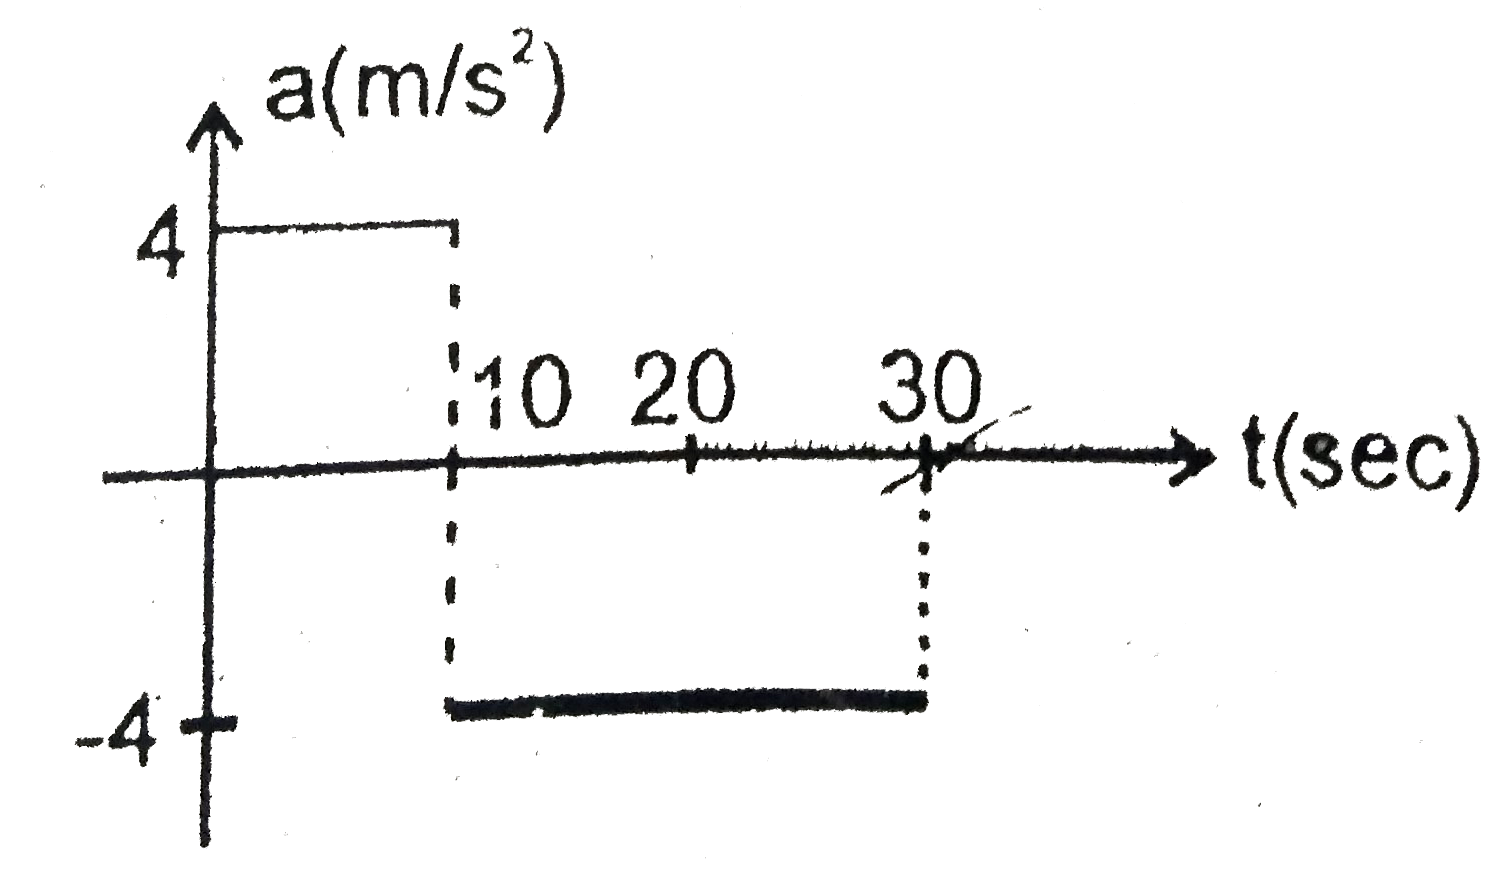
View SolutionSuppose that the acceleration versus time graph of a particle that starts from rest at t = 0 is as shown in the figure :
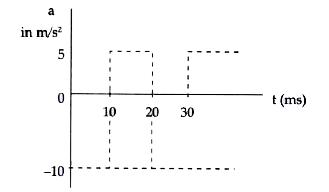
What is the total distance travelled by the particle during 30 s ?
View Solution
Knowledge Check
A graph of acceleration versus time of a particle starting from rest at t =0 is shown. The speed of the particle at t=14 second is
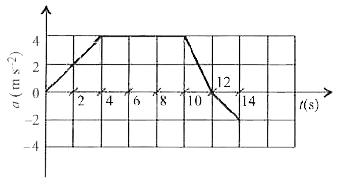 A2ms−1B34ms−1C20ms−1D42ms−1
Suppose that the acceleration versus time graph of a particle that starts from rest at t = 0 is as shown in the figure :
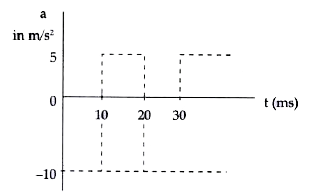
At what instant does the particle come to rest for the first time ?A5 sB10 sC15 sDThe particle never comes to restThe acceleration of a particle starting from rest and travelling along a straight line is shown in figure. The maximum speed of the particle is
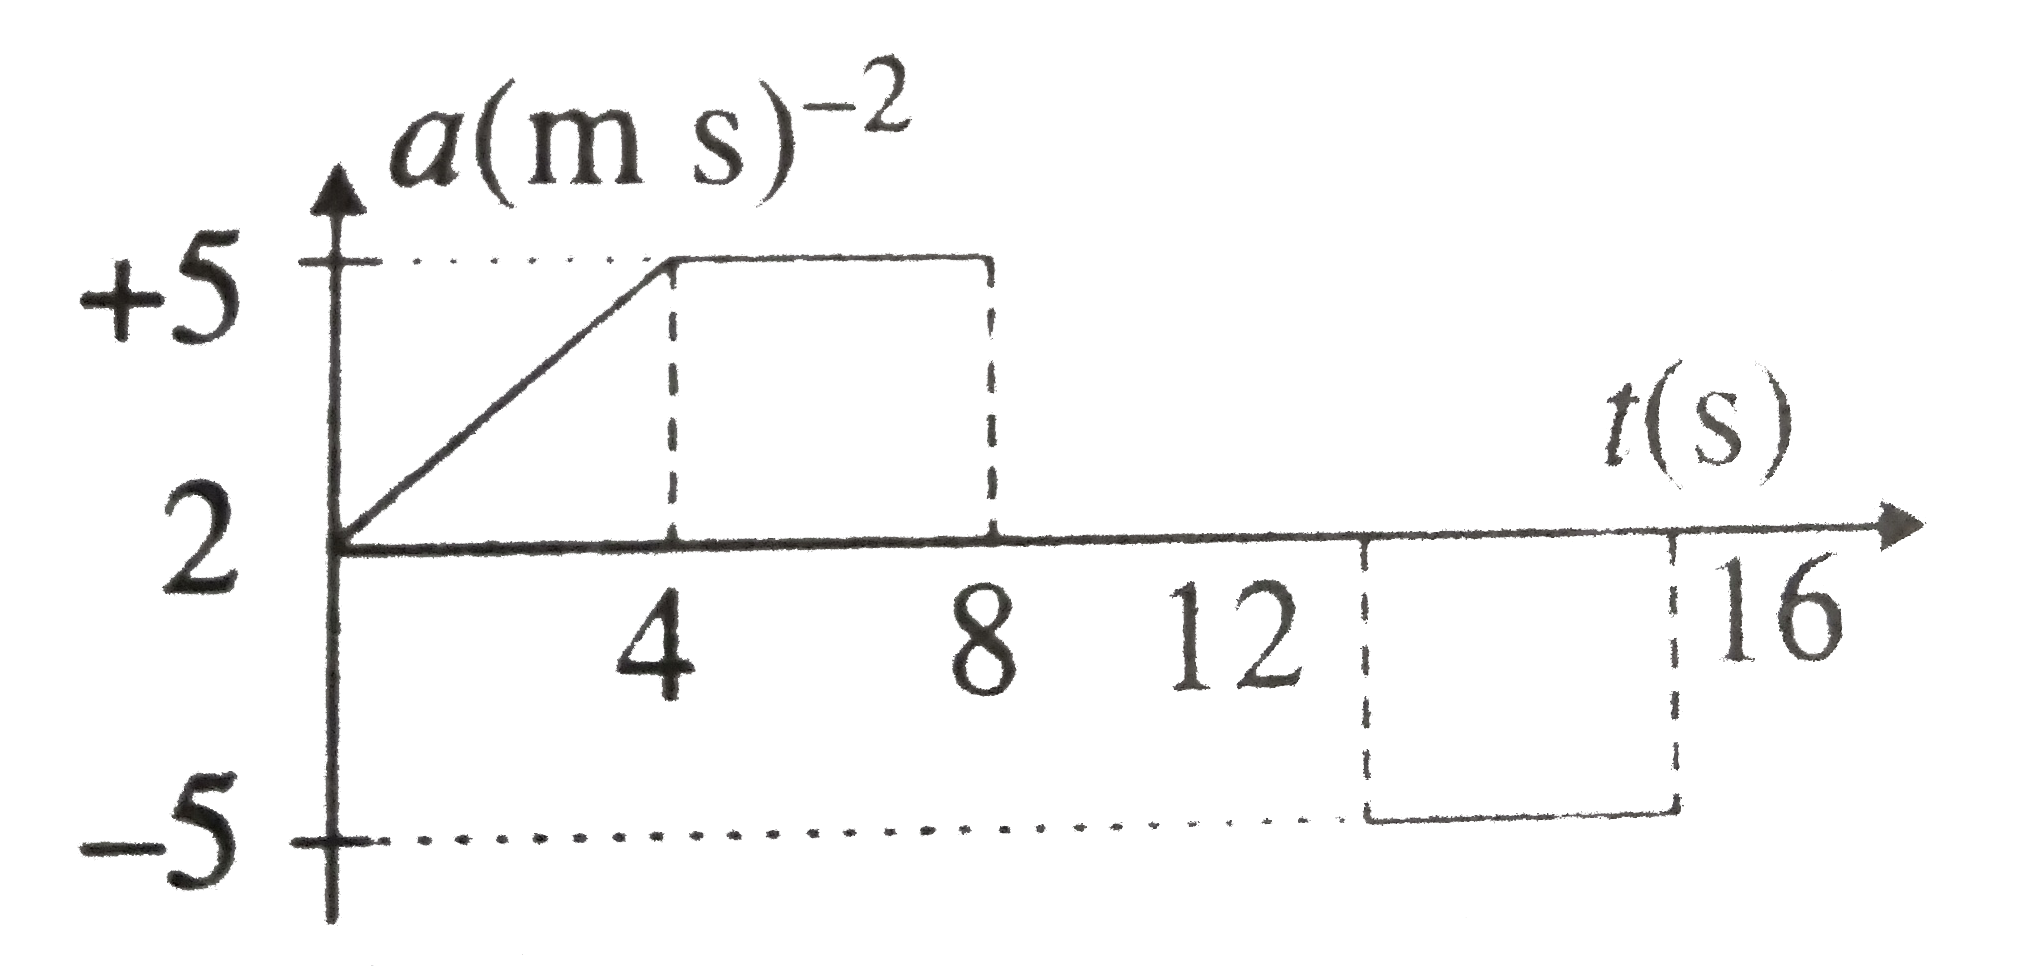 A20ms−1B30ms−1C40ms−1D60ms−1
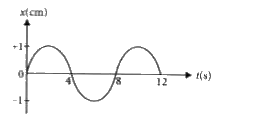
The x-t graph of a particle undergoing SHM is as shown in figure. The acceleration of the particle at t=2/3 is
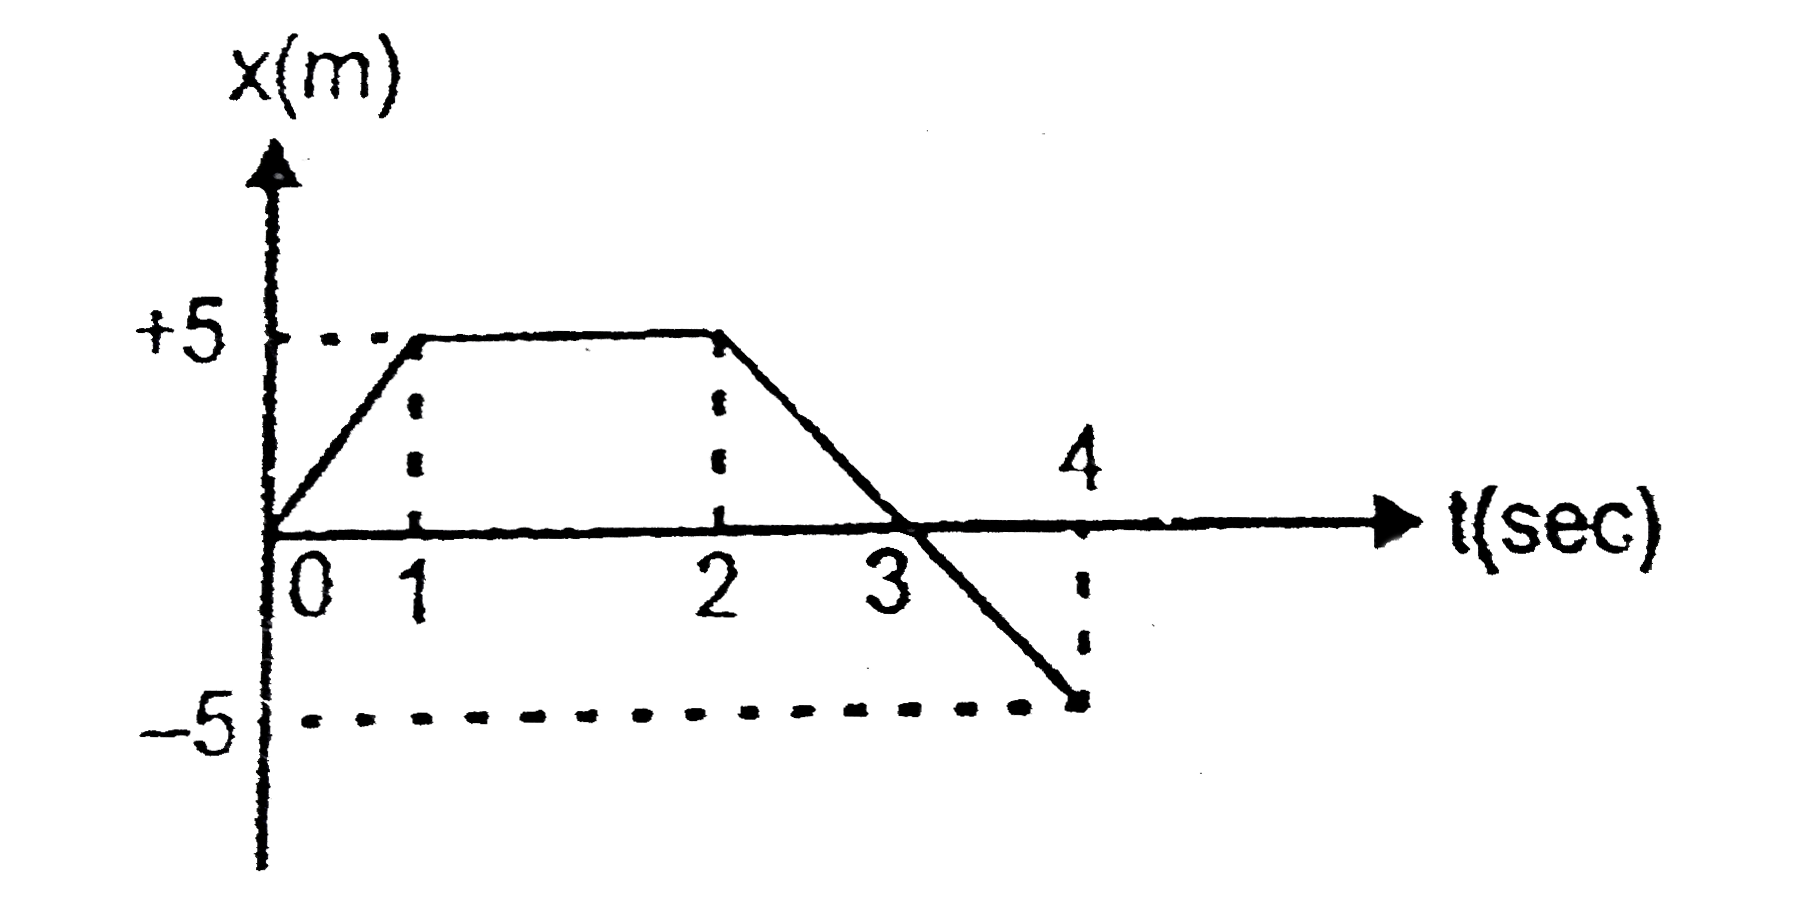
View SolutionPosition-time graph for a particle moving along x− direction is as shown in the figure. Average speed of the particle from t=0 to t=4 is :
View SolutionThe acceleration versus time graph for a particle moving along a straight line is shown in the figure. If the particle starts from rest at t = 0, then its speed at t = 30 sec will be :
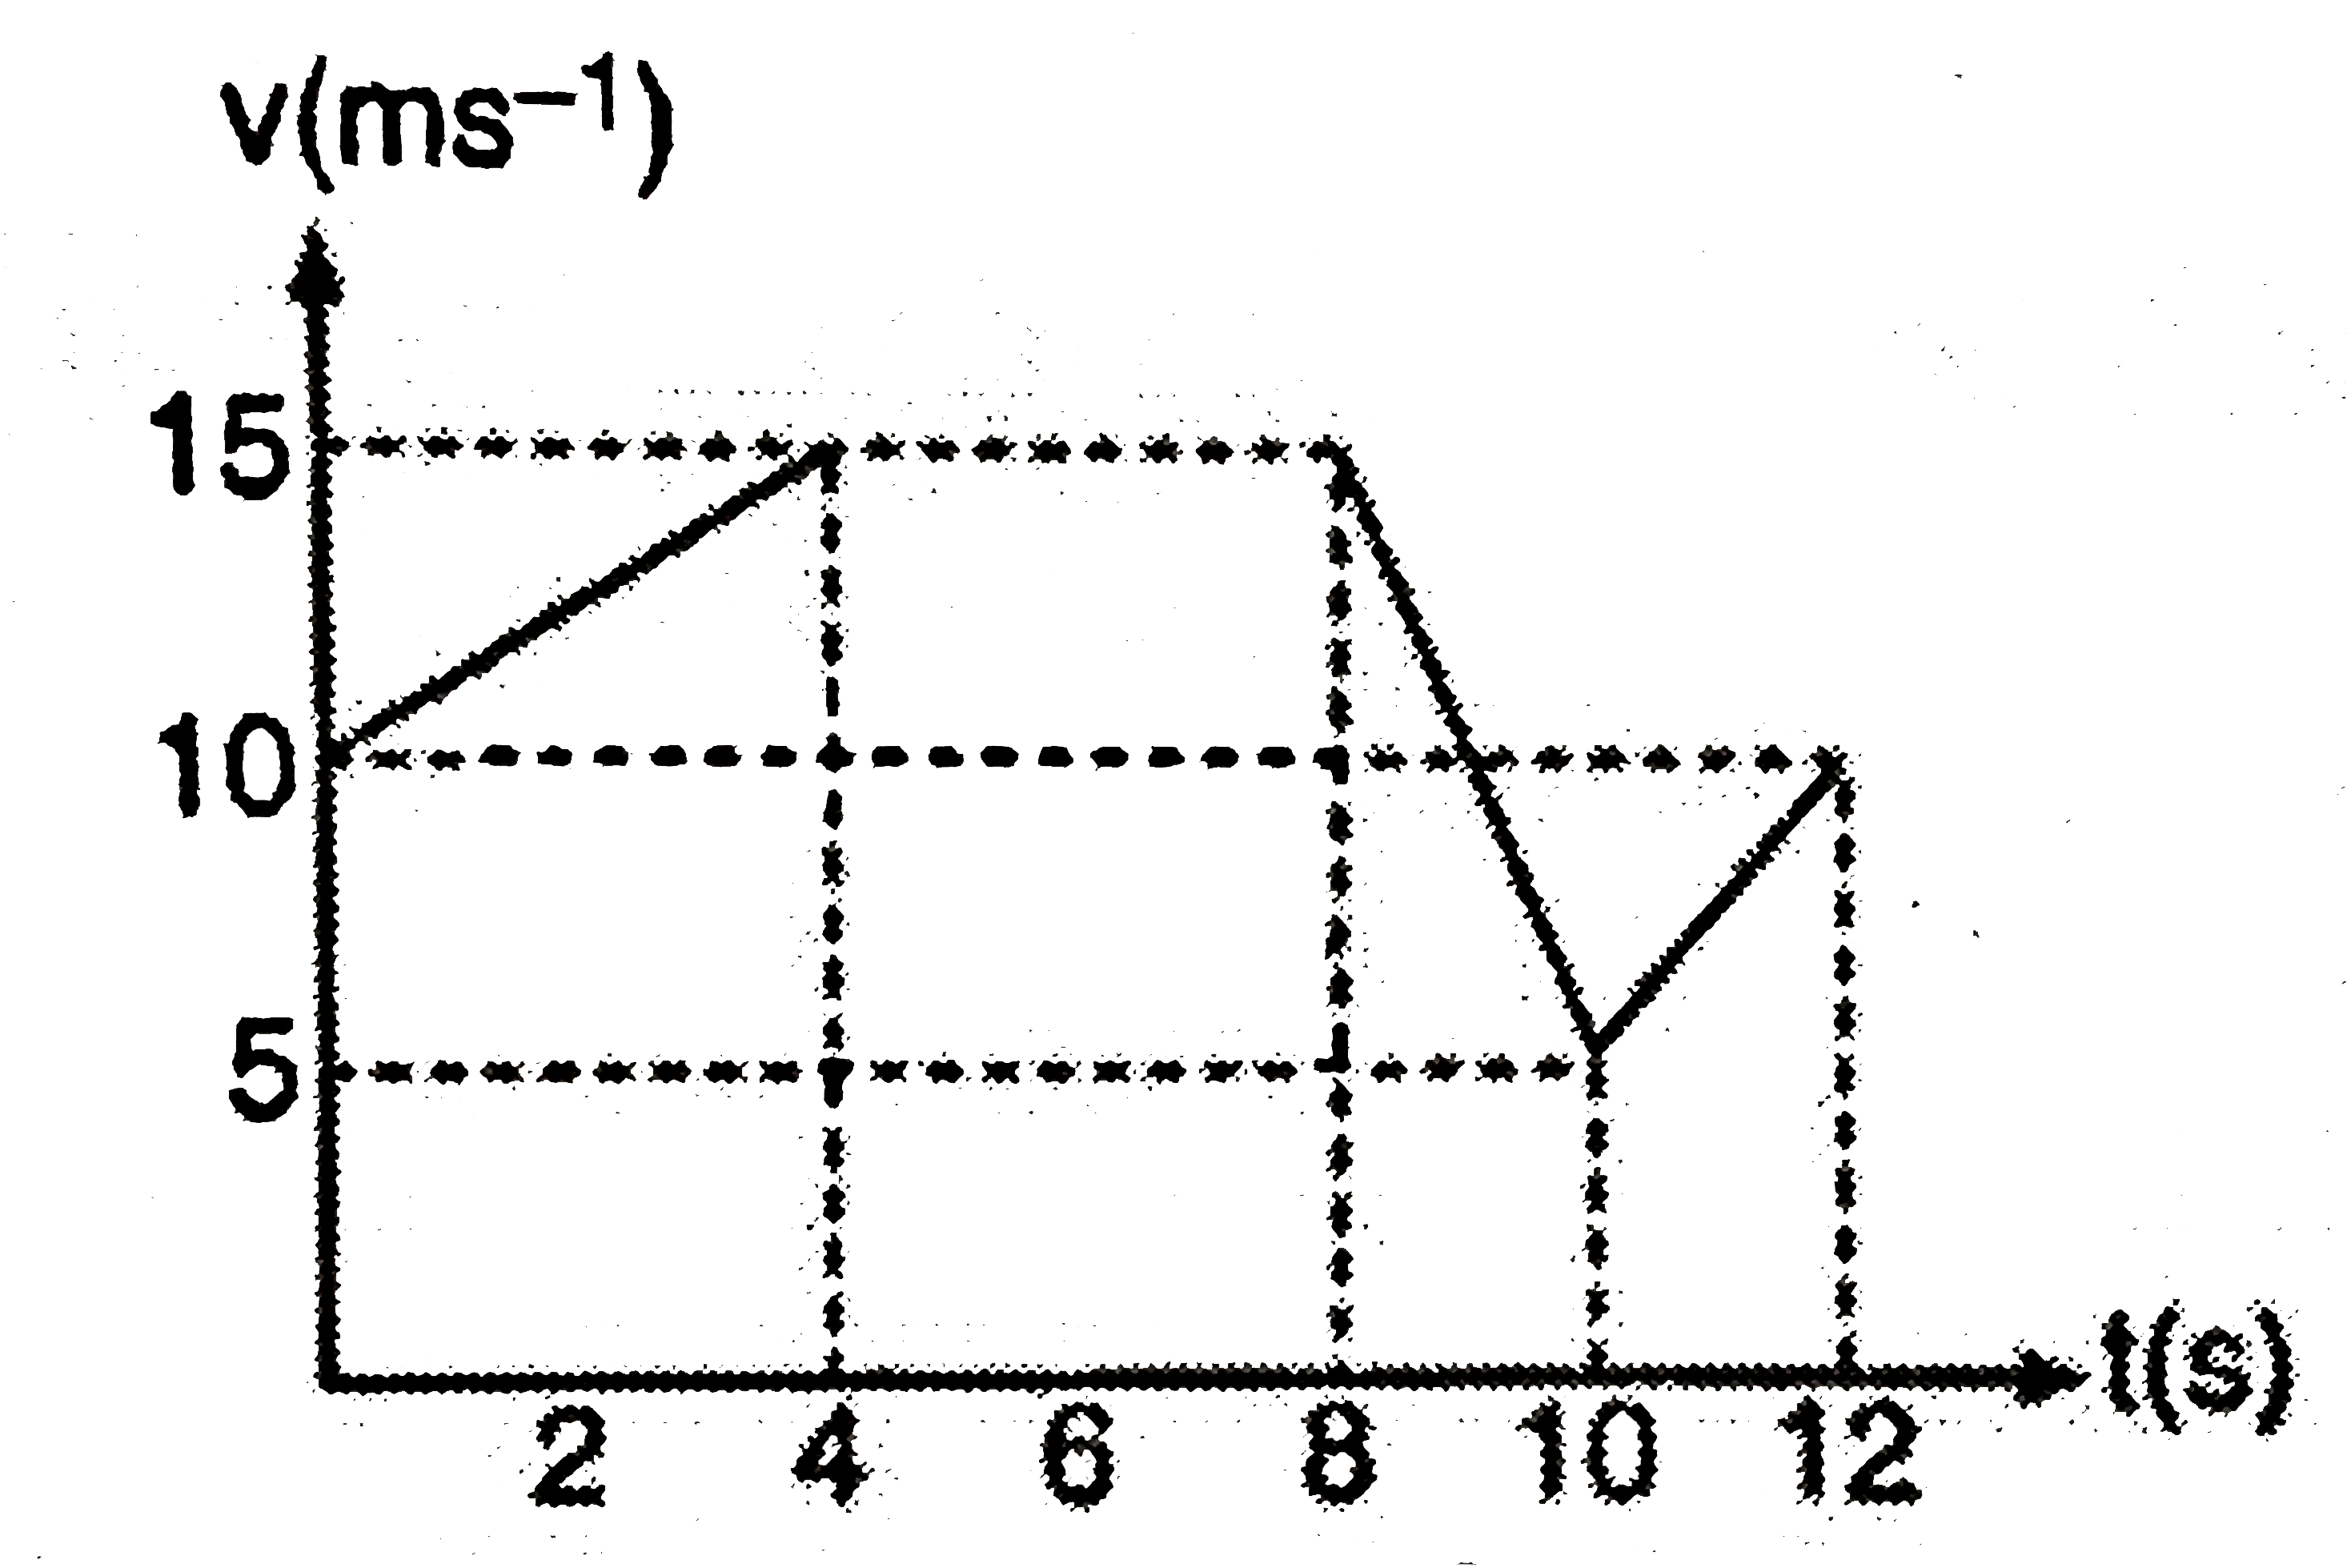
View SolutionThe velovity-time graph of a particle moving in a straitht line is shown in . The acceleration of the particle at t=9s is.
 .
.
View SolutionThe velocity -time (v−t) graph of a particle moving in a straight line is shown in figure. The acceleration of the particle at t=9 is:
View Solution
