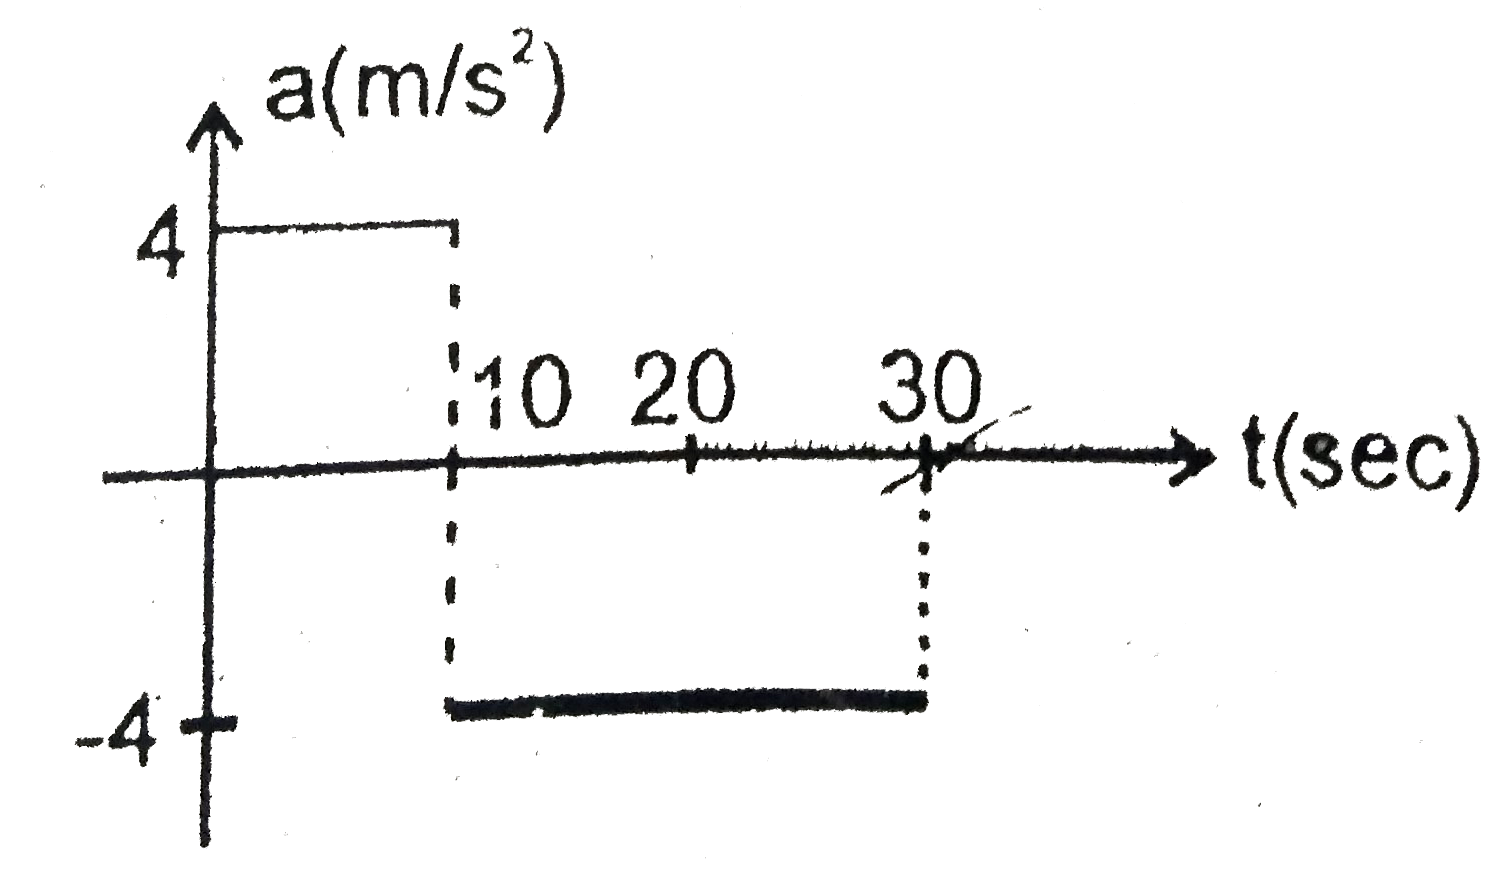
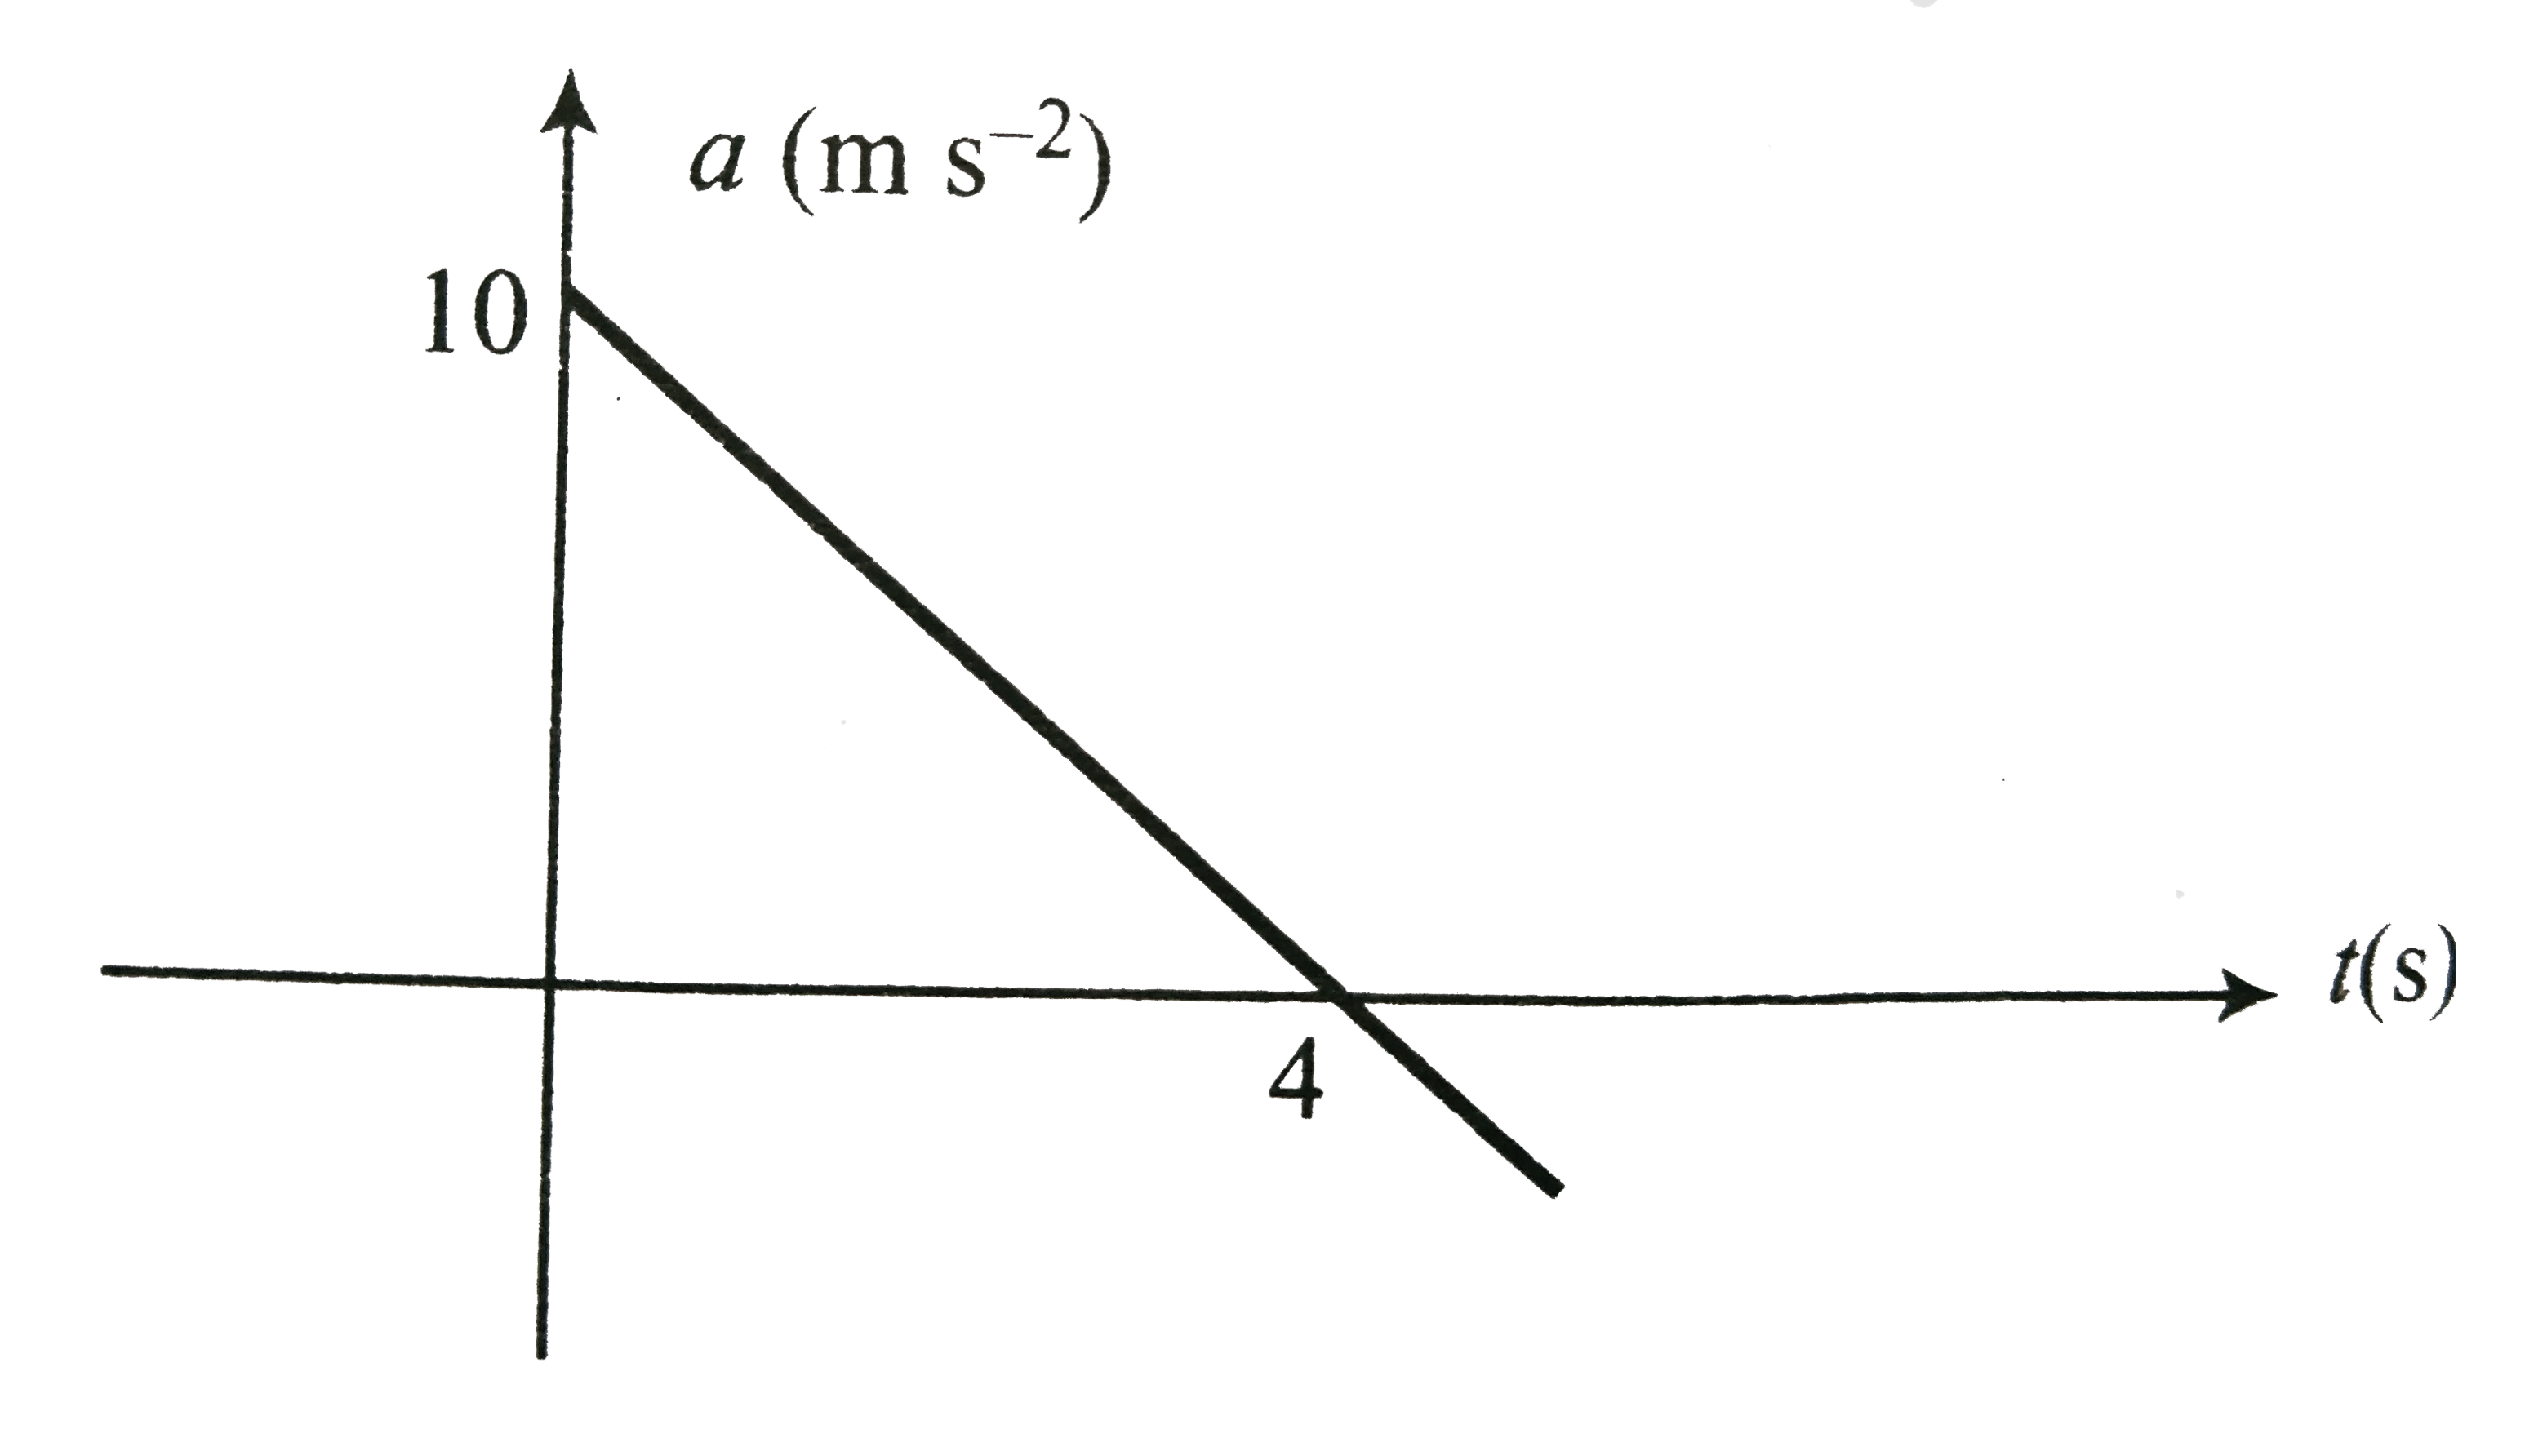
The acceleration versus time graph for a particle moving along a straight line is shown in the figure. If the particle starts from rest at t = 0, then its speed at t = 30 sec will be :
20m/sec
40m/sec
0m/sec
−40m/sec
The correct Answer is:B
The acceleration ……..
For a - t curve
speed = |velocity|
speed (at t = 30 sec) =|10×4−4×20|
=|40−80|=|−40|=40m/sec.
Similar Questions
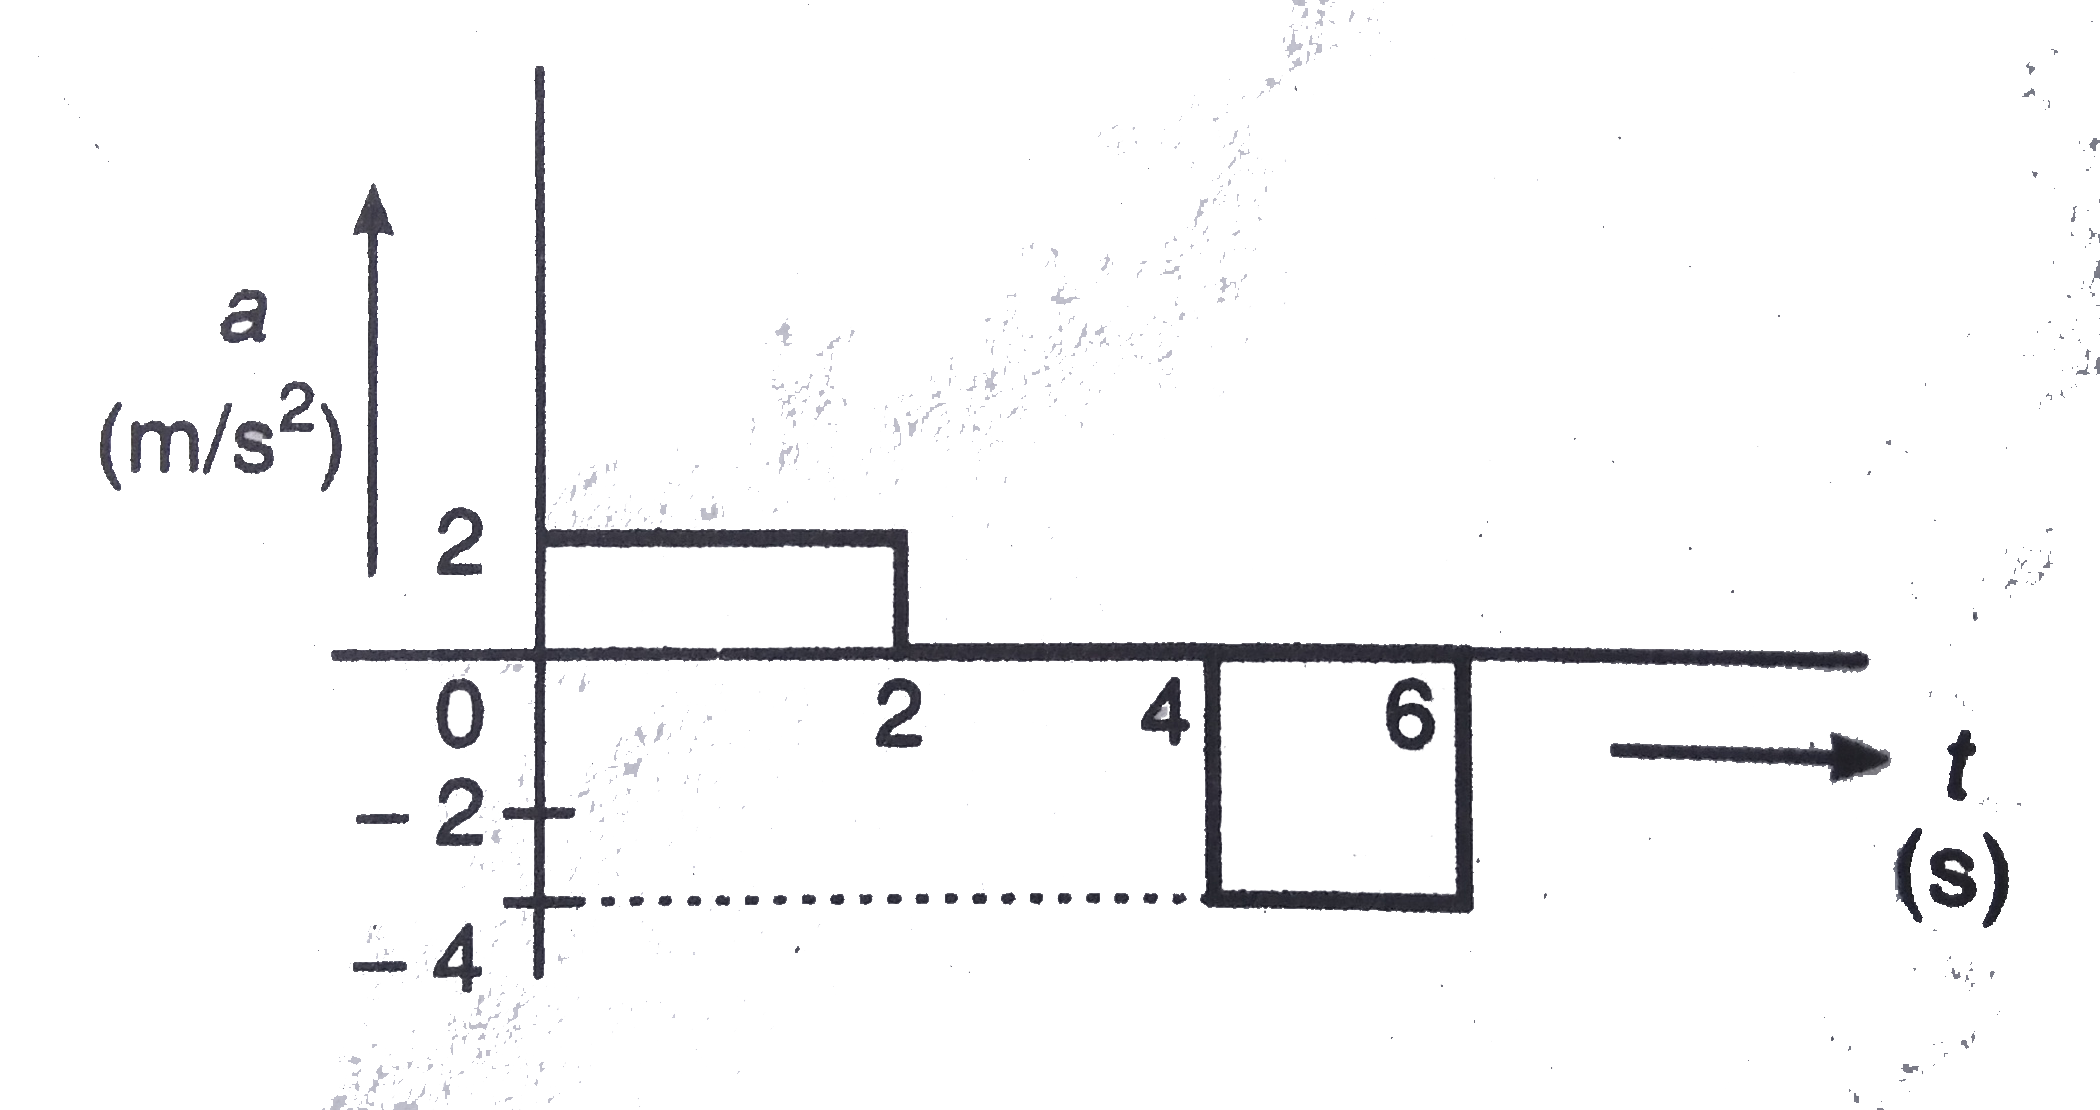
The acceleration versus time graph of a particle moving along a straight line is shown in the figure. Draw the respective velocity-time graph Given v=0 at t=0.
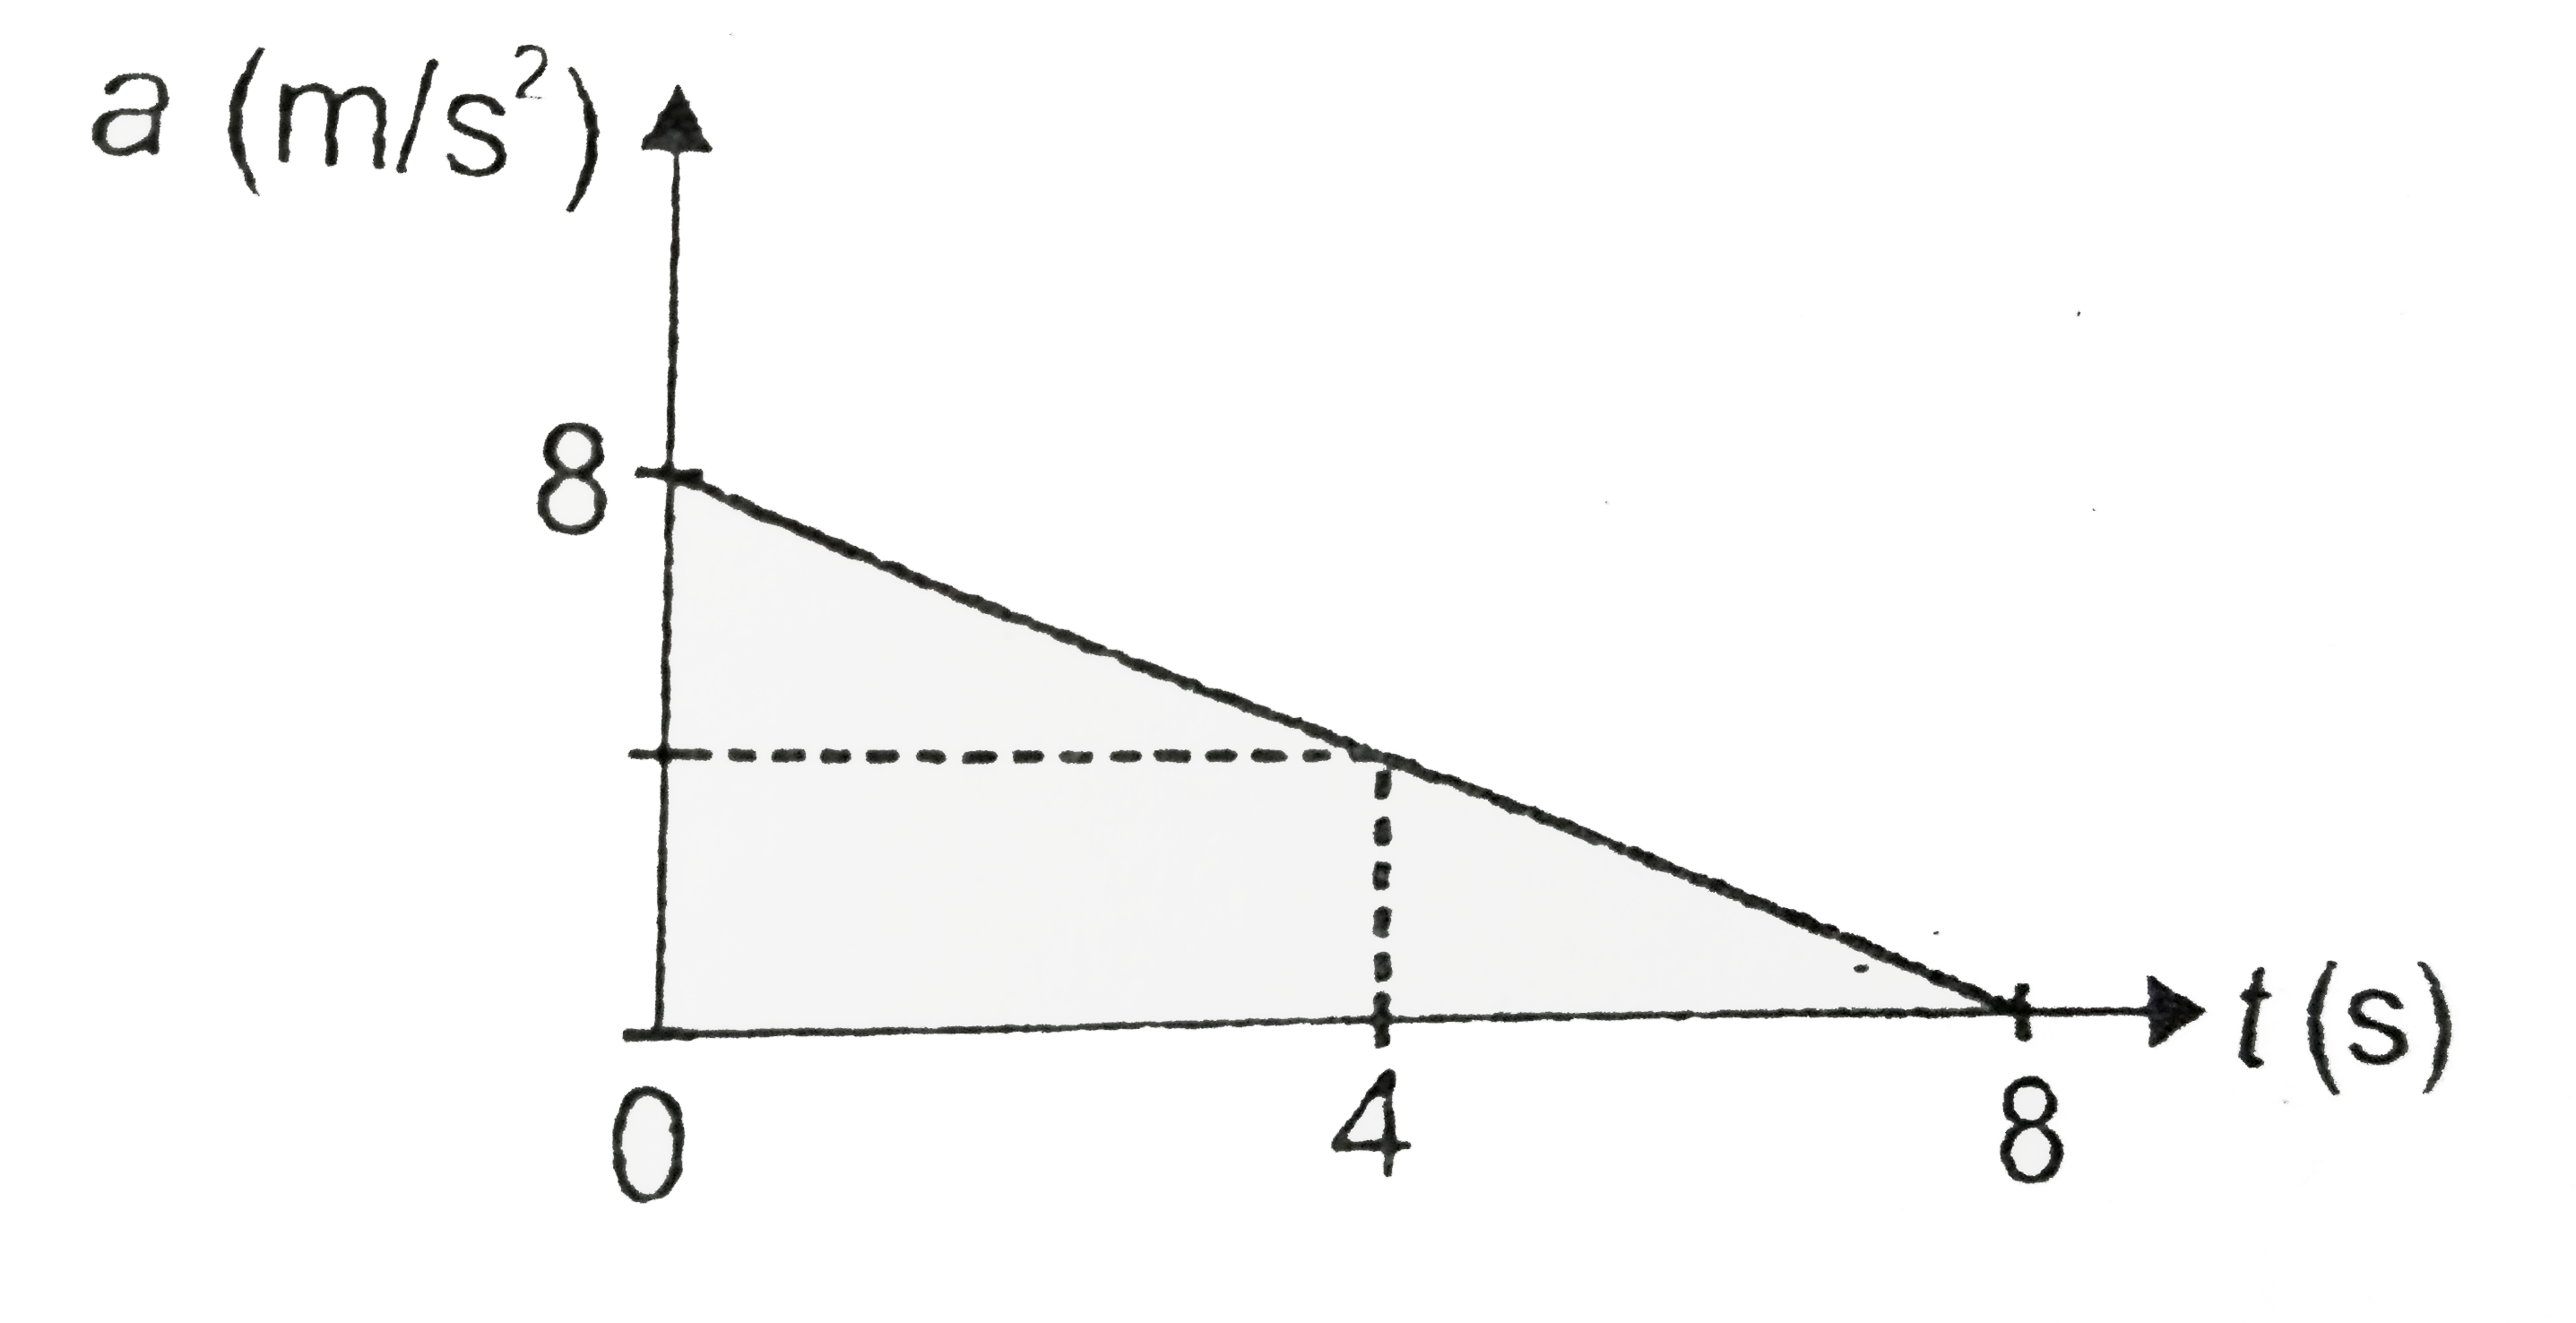
View SolutionThe acceleration-time graph of a particle moving along x-axis is shown in the figure. If the particle starts with velocity 3 m/s at t = 0, find the velocity of particle at t = 4 s.
View Solution
Knowledge Check
The acceleration versus time graph of a particle moving in a straight line is show in figure. The velocity-time graph of the particle would be
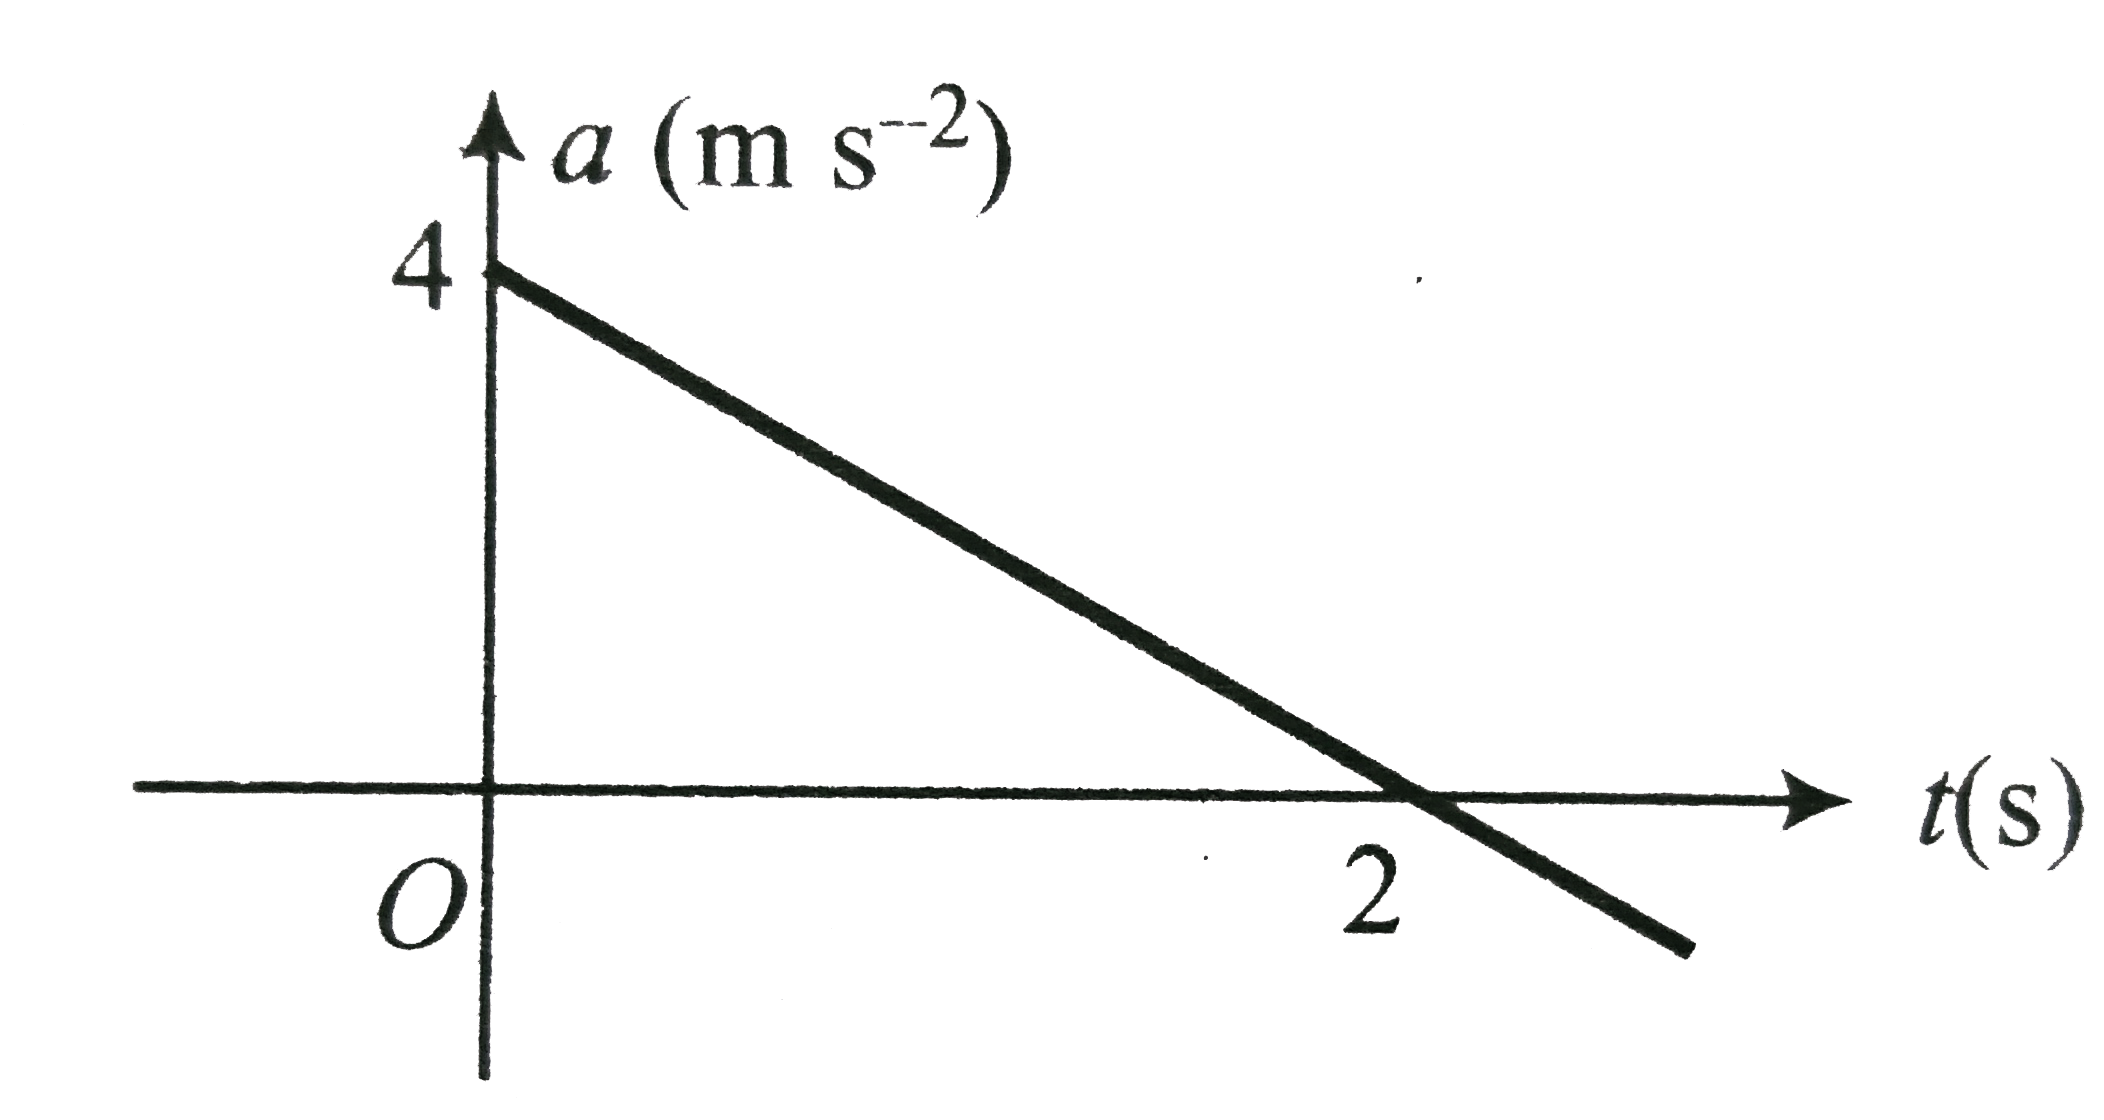 .AA straight lineBA parabolaCA circleDAn ellipse
Acceleration versus time curve for a particle moving in a straight line is shown in the figure. If particle starts from rest at t=0, then which of the following curve is correct for the same particle.
 A
A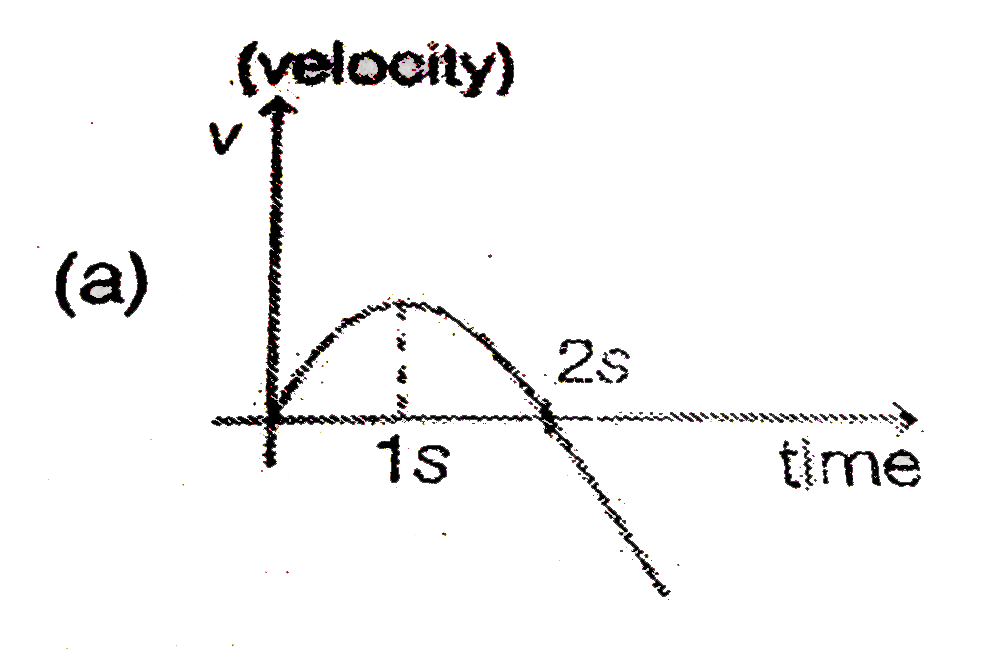 B
B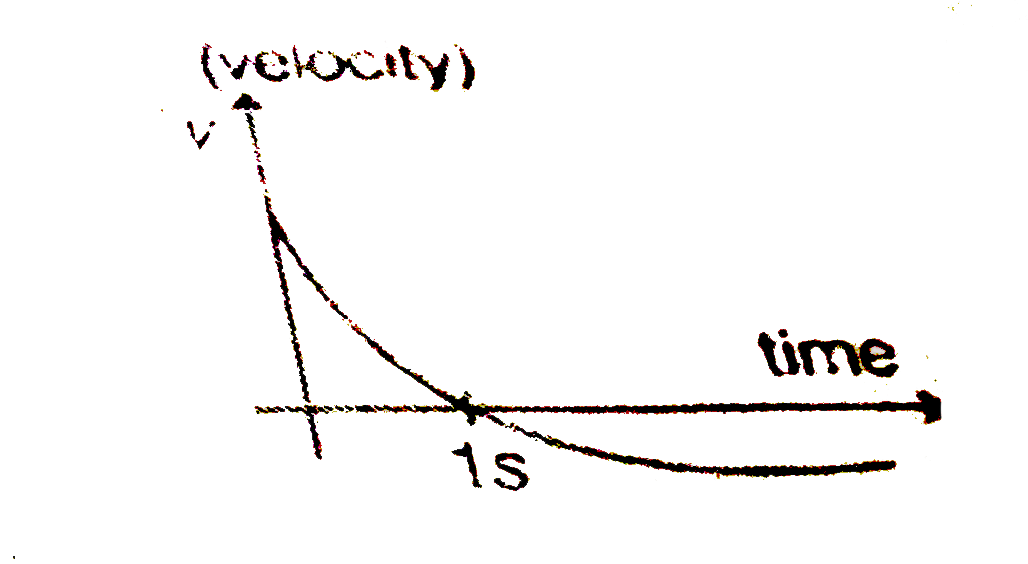 C
C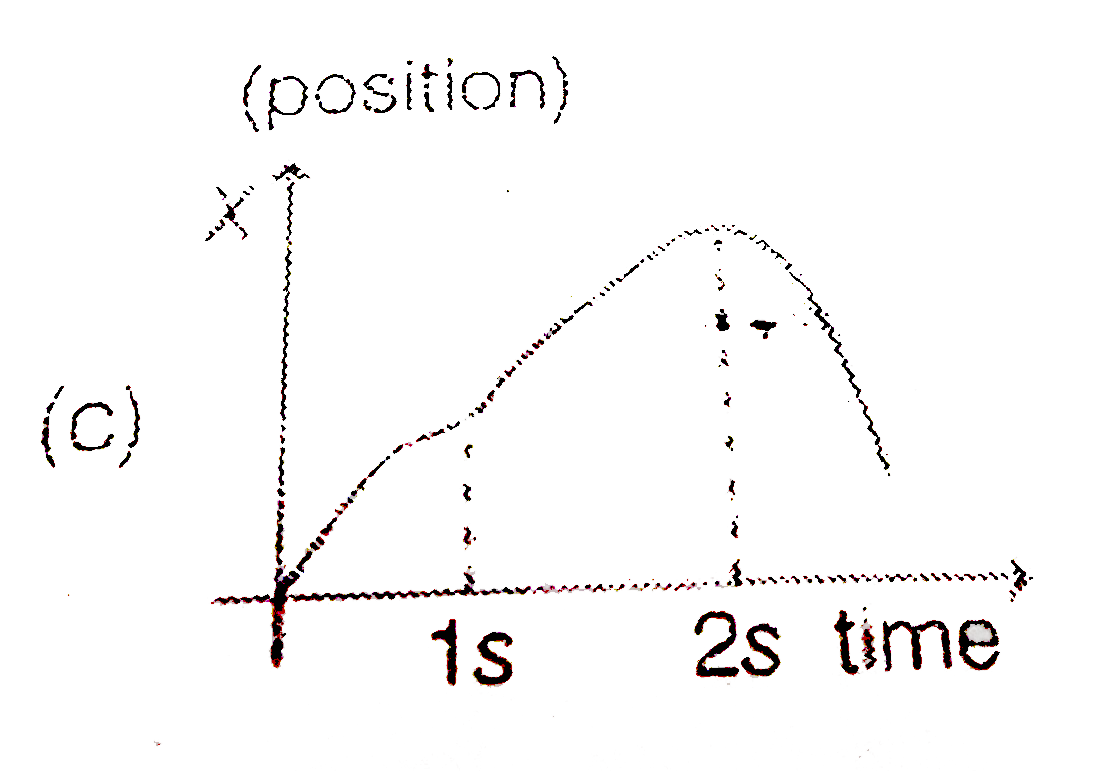 D
D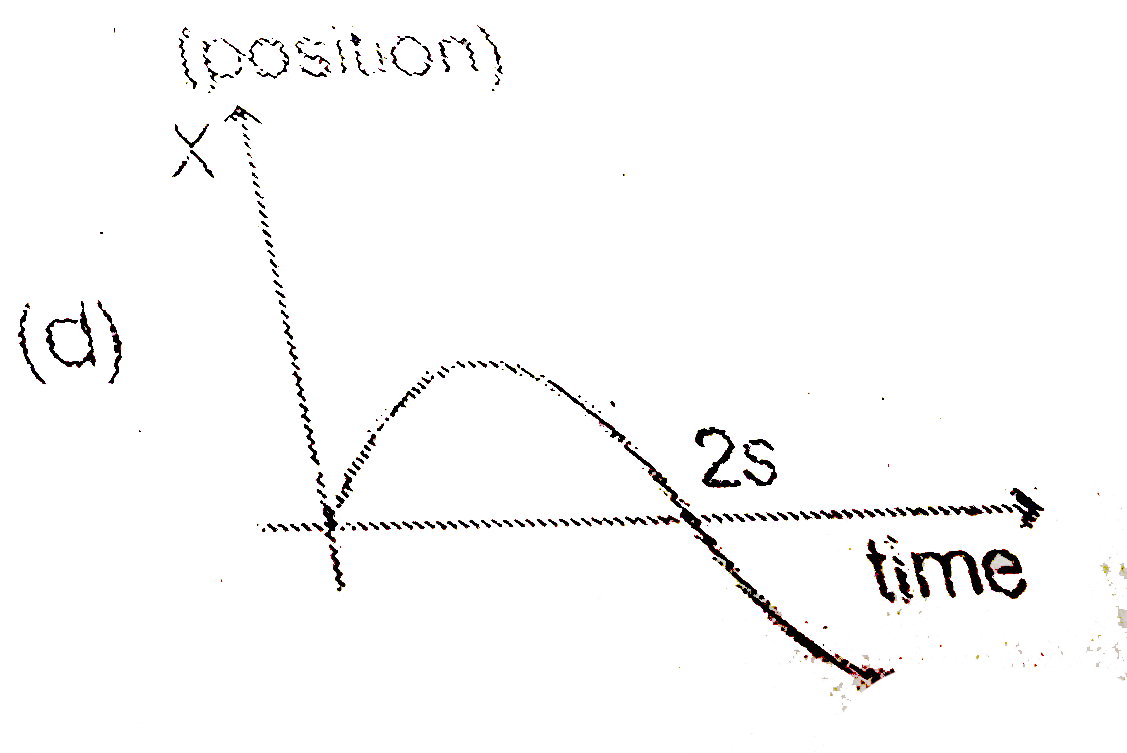
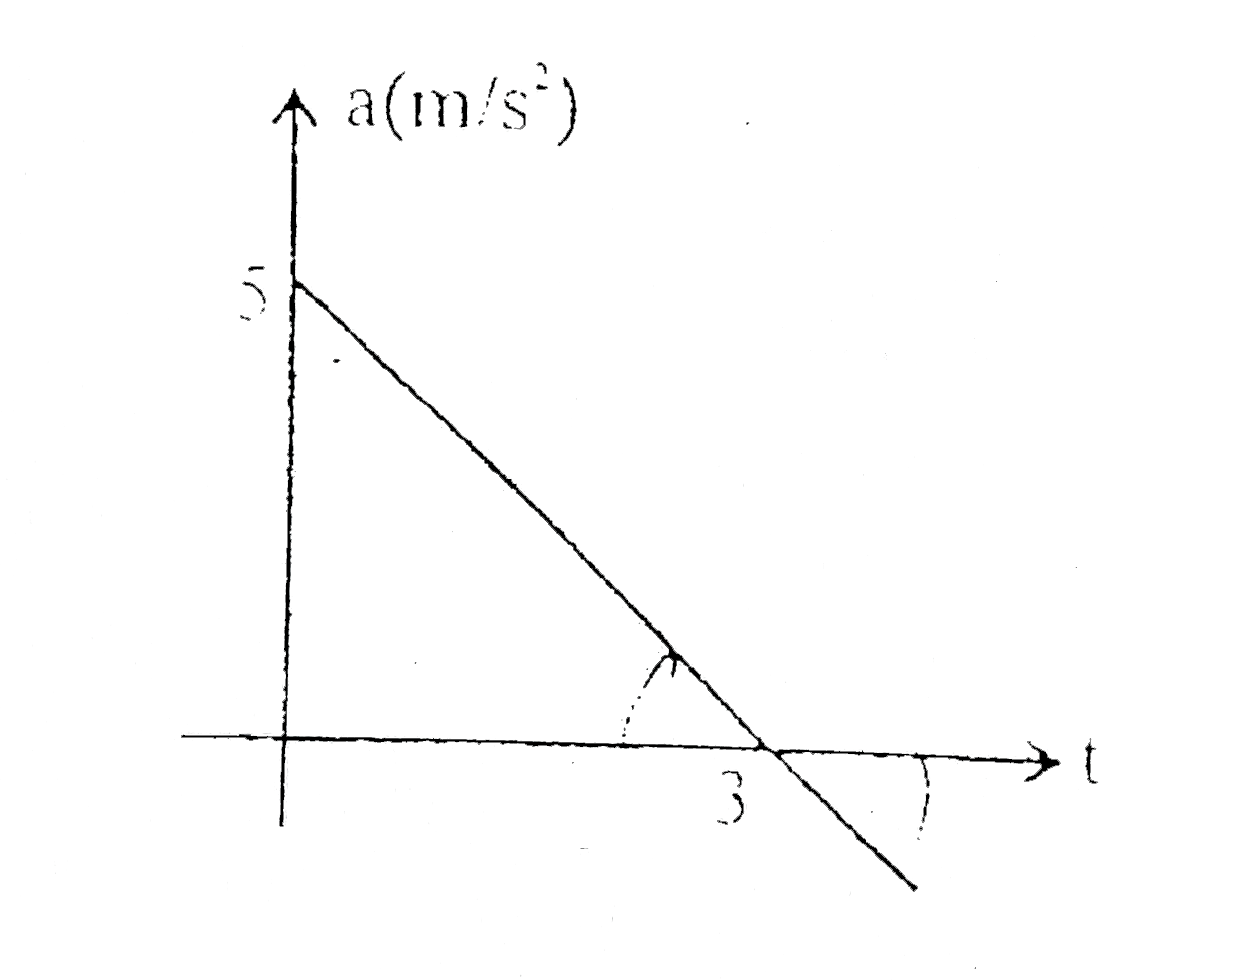
The acceleration-time graph of a particle moving along a straight line is as shown in. At what time the particle acquires its initial velocity?
 .A12sB5sC8sD16s
The acceleration time graph of a particle moving along a straight line is as shown in Fig.At what time the particle acquires its initial velocity?
View SolutionThe acceleration-time graph of a particle moving along a straight line is as shown in figure. At what time the particle acquires its initial velocity ?

View SolutionThe acceleration-time graph of a particle moving along a straight line is as shown in figure. At what time the particle acquires its initial velcoity ?
View SolutionThe x-t graph of a particle moving along a straight line is shown in figure
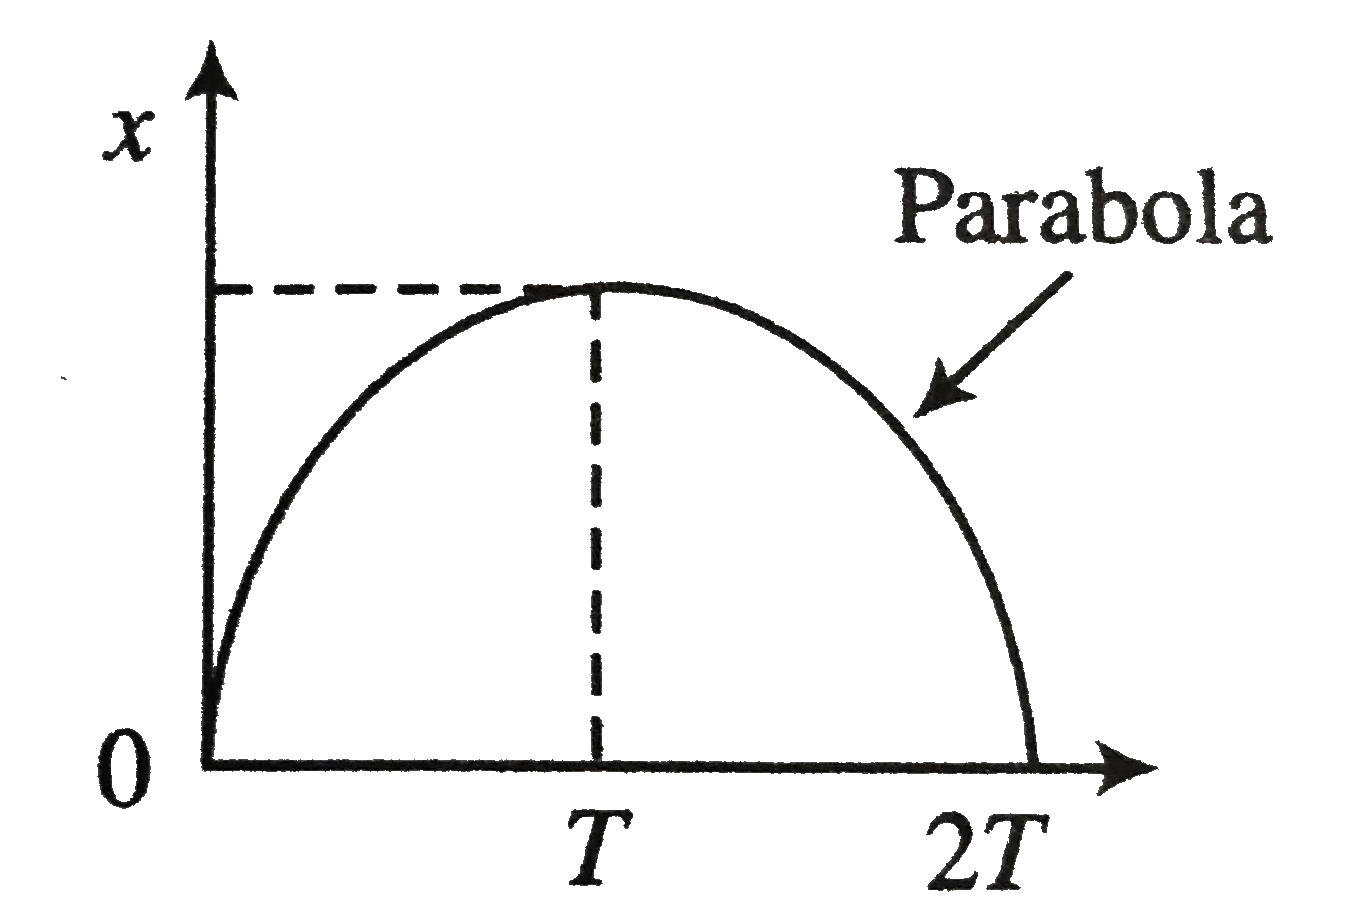
The a-t graph of the particle is correctly shown by
View SolutionThe x-t graph of a particle moving along a straight line is shown in figure

The v-t graph of the particle is correctly shown by
View Solution
