A mercury lamp is a convenient source for studying frequency dependence of photoelectric emission, since it gives a number of spectral lines ranging from the UV to the end of the red visible spectrum. In our experiment with rubidium photocell, the following lines from a mercury source were used: λ1=3650A∘,λ2=4047A∘,λ3=4358A∘,λ4=5461A∘,λ5=6907A∘ The stopping voltages, respectively were measured to be:
V01=1.28V,V02=0.95V,V03=0.74V,V04=0.16V,V05=0V.
(a) Determine the value of Planck's constant h.
(b) Estimate the threshold frequency and work function for the material.

a. Let the respective frequencies fo the five spectral lines of mercury be V1,V2,V3,V4 and V5. Then
V1=cλ1=3×1083650×10−1=8.22×10¹⁴Hz
V2=cλ2=3×1084047×10−10=7.41×10¹⁴Hz
V3=cλ3=3×1084358×10−10=6.88×10⁻¹⁰Hz
V4=cλ4=3×1085461×10−10=5.49×10¹⁴Hz
and V5=cλ5=3×1085461×10−10=4.34×10¹⁴Hz
From Einstein's photoelectric equation, we have
hv=hv0+12mv2max
If V0 is the stopping potential, then
eV0=12mv2max
hv=hv0+eV0
or V0=hce−hv0e
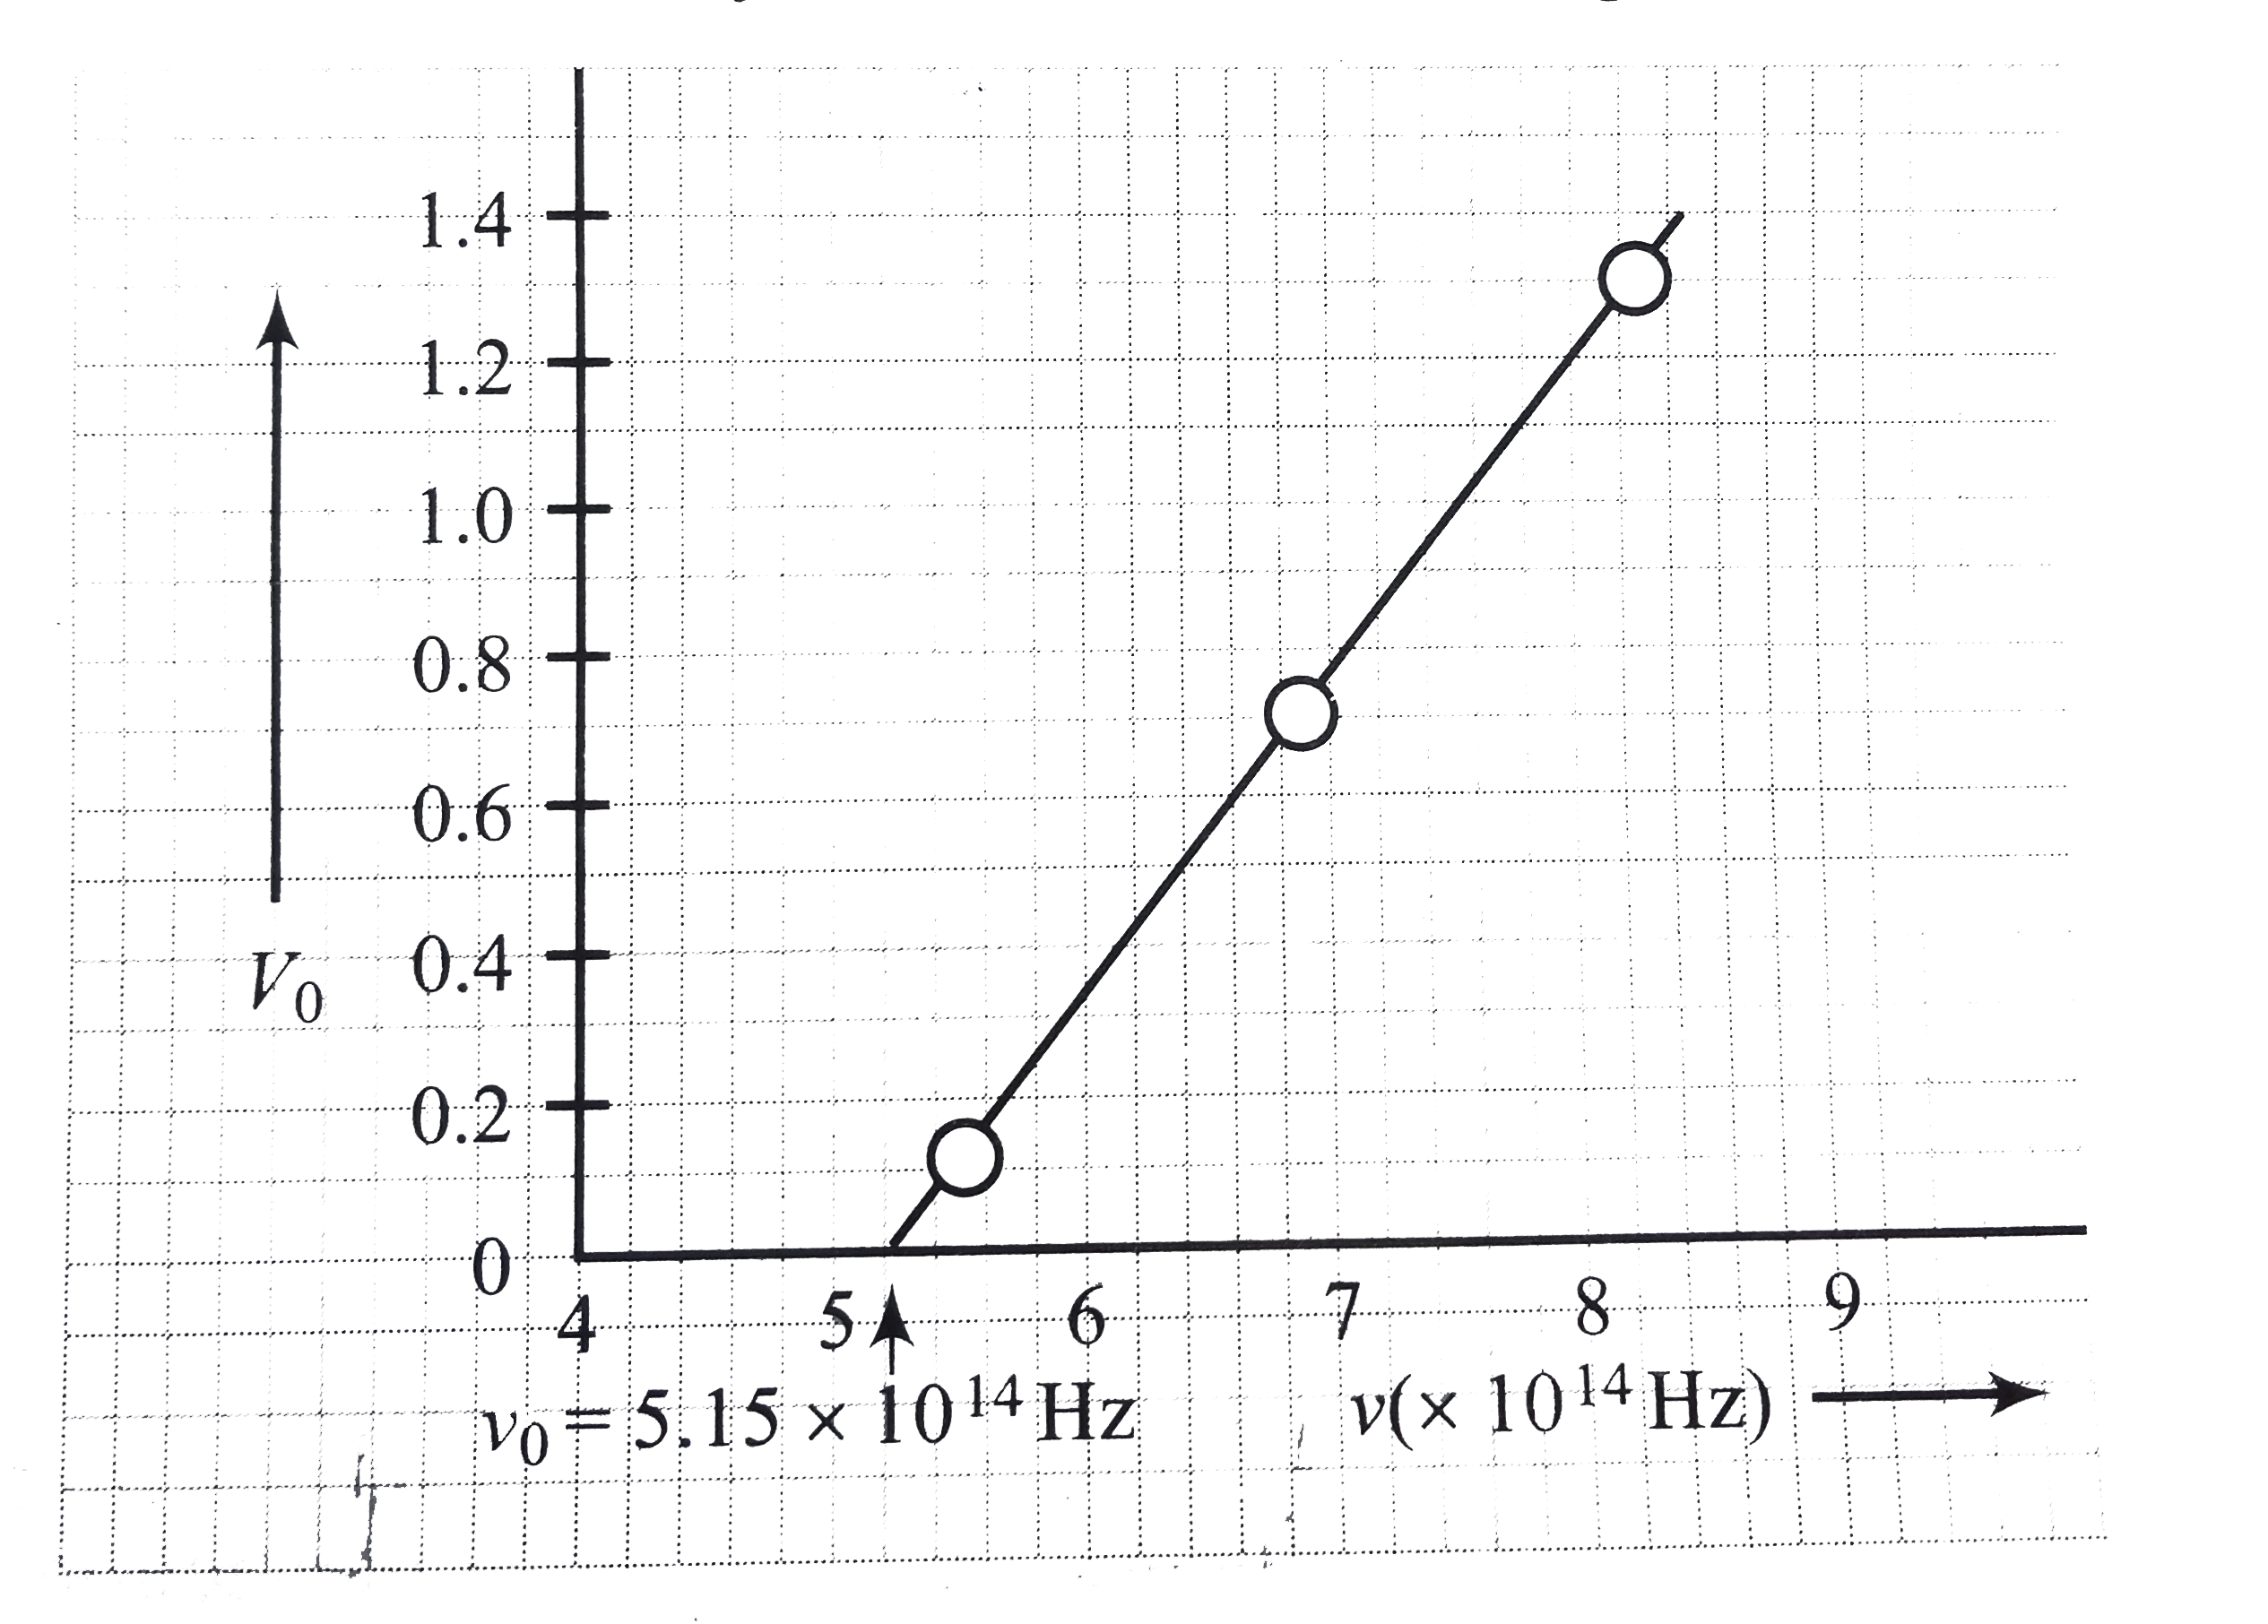
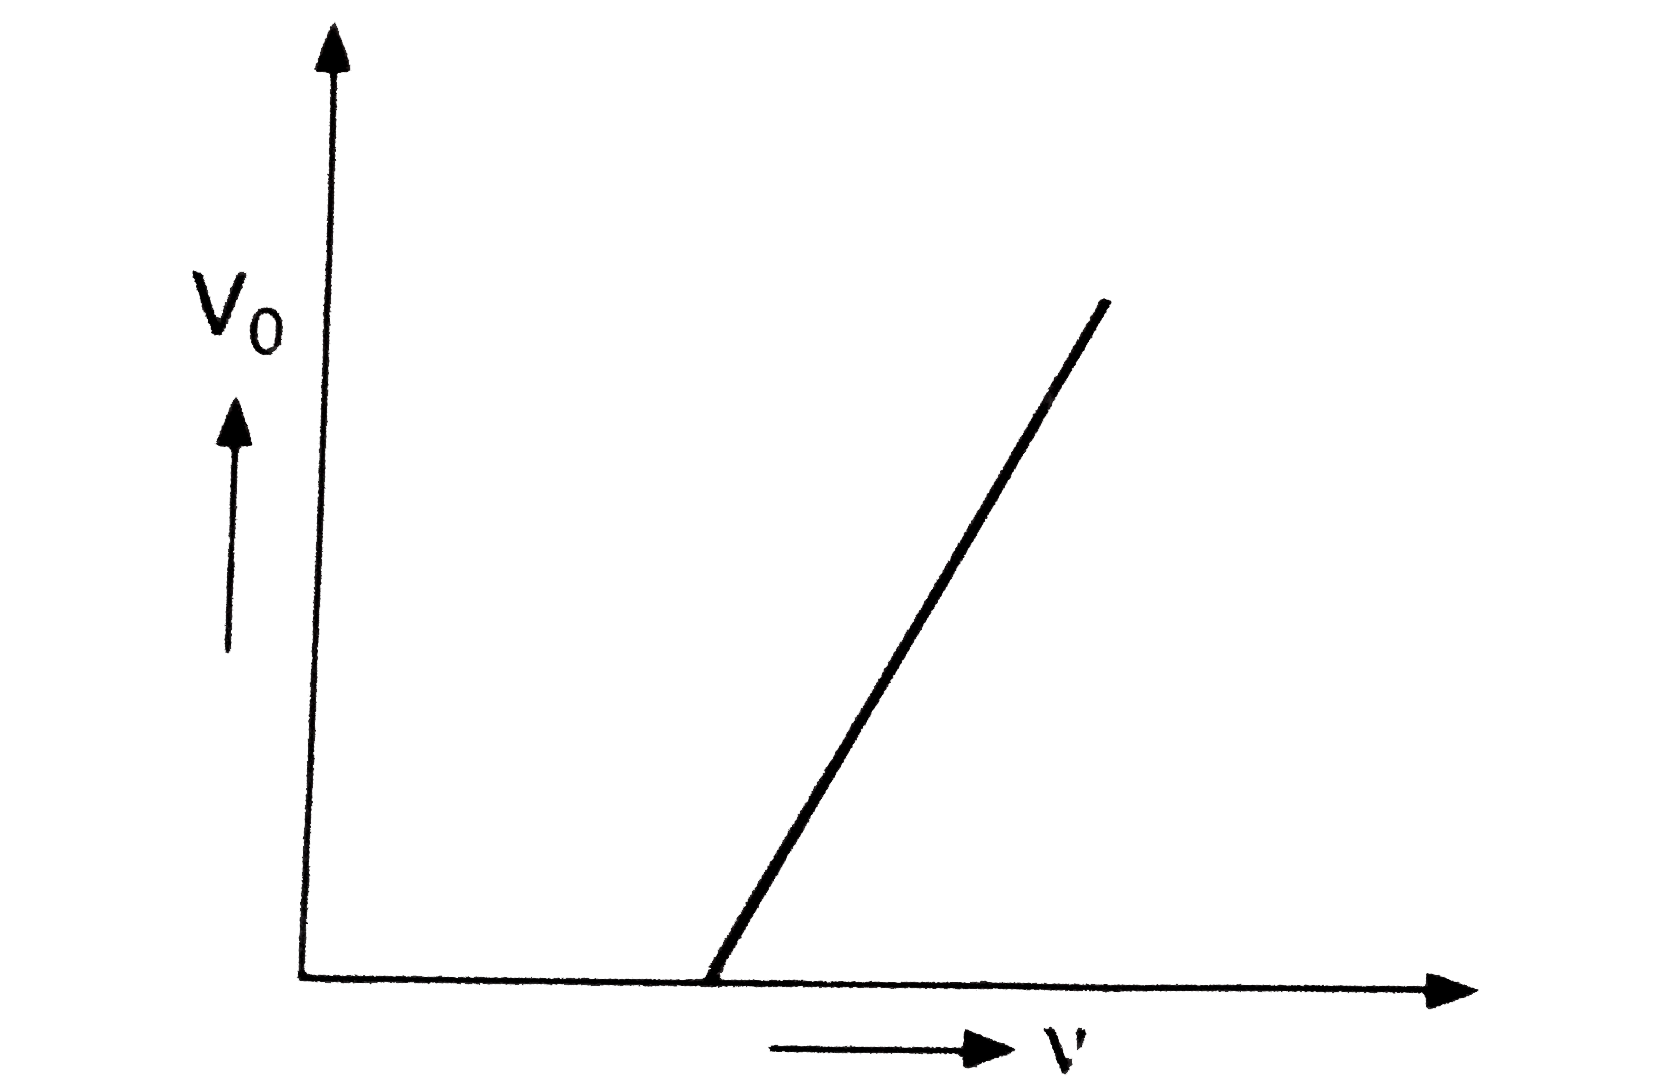
It represents the equation of a straight line, whose slope is he and makes an intercept hv0e on negative. V0−aξs. The plot of graph between v (along X-axis) and V0(along Y-axis) for the given data for the five spectral lines of mercury will be as shoen in fig

From the graph, slope of the graph is
1.28−0.168.22×1014−5.49×10¹⁴l=4.1×10⁻¹⁵JsC−1
he=4.1×10⁻¹⁵
or h=e×4.1×10−15
=1.6×10−19×4.1×10−15
=6.57×10⁻³⁴Js
b. Also the intercept made by the graph on v-axis is equal to v0. Therefore, from the graph, we have
v0=5.15×10¹⁴Hz
Hence, the work function of rubidum,
w=hv0
=6.456×1034×5.15×1014
=3.38×10⁻¹⁹J=3.38×10−191.6×10−19=2.11eV
Topper's Solved these Questions
- PHOTOELECTRIC EFFECTBOOK - CENGAGE PHYSICSCHAPTER - PHOTOELECTRIC EFFECTEXERCISE - Examples
8 Videos
- PHOTOELECTRIC EFFECTBOOK - CENGAGE PHYSICSCHAPTER - PHOTOELECTRIC EFFECTEXERCISE - Exercise 3.1
15 Videos
- NUCLEIBOOK - CENGAGE PHYSICSCHAPTER - NUCLEIEXERCISE - QUESTION BANK
59 Videos
- RAY OPTICSBOOK - CENGAGE PHYSICSCHAPTER - RAY OPTICSEXERCISE - DPP 1.6
12 Videos
Similar Questions
A mercury lamp is a convenient source for studying frequency dependence of photoelectric emission, since it gives a number of spectral lines ranging from the UV to the red and end of the visible spectrum. In our experiment with rubidium photocell, the following lines from a mercury source were used:
λ1=3650Å,λ2=4047Å,λ3=4358Å,λ4=5461Å,λ5=6907Å
The stopping voltages, respectively, were measured to be:
V01=1.28V,V02=0.95V,V03=0.74V,V04=0.16V,V05=0V
Determine the value of Planck's constant h, the threshold frequency and work function for the material.
View SolutionWrite Einstein’s photoelectric equation. Define the threshold frequency v0 and stopping potential V0.
View Solution
Knowledge Check
A photon of frequency v causes photo electric emission from a surface with threshold frequency v0. The de-Broglies wavelength (λ) of the photo electron emitted is given by:
AΔn=h2mλBΔn=hλC[1v0−1v]=mc2hDλ=√h2mΔVIf λv,λmandλx represent wavlength of visible light, microwaves and X - rays respectively, then
Aλm<λx<λvBλv<λm<λxCλx<λv<λmDλm<λv<λxif λv',λx and λm represent the wavelengths of visible light X-rays and microwaves respectively then:
Aλm>λx>λvBλk>λm>λxCλm>λv>λxDλy>λx>λm
Derive the equations v=nλ , where n and λ are frequency and wavelength .
View SolutionIn photoelectric effect the slope of straight line graph between stopping potential (V0) and freqency of incident light (v) gives:

View SolutionThe stopping potential are V1 and V2. Calculate the (V1−V2), if the λ1 and λ2 are wavelength of incident lights, respectively.
View SolutionIf V1 and V2 are veloctities of light in two different media, then the ratio of wavelength of light in the same media λ1λ2=
View SolutionIf λv,λx and λm represents the wavelength of visible light X-ray and microwave respectively then :
View Solution
