A parachutist jumps off the plane and opens up the parachute at time t1 . He eventually reaches a steady speed and finally hits the floor at time t2 . Which of the following shows the speed-time graph of the parachutist's descent?


The correct Answer is:A
To solve the question regarding the speed-time graph of a parachutist's descent, we need to analyze the motion of the parachutist in different phases of the jump. Here’s a step-by-step breakdown:
Step 1: Initial Jump
When the parachutist jumps out of the plane, his initial speed is zero. This is the starting point of the graph.
Hint: The speed starts at zero when the parachutist jumps.
Step 2: Acceleration Phase
After jumping, the parachutist accelerates downwards due to gravity. This means that the speed increases steadily over time. The graph during this phase will be a straight line with a positive slope, indicating constant acceleration.
Hint: Look for a straight line with a positive slope after the jump.
Step 3: Opening the Parachute
At time t1, the parachutist opens the parachute. This action creates a significant increase in air resistance, which opposes the downward motion. As a result, the speed of the parachutist will begin to decrease. This phase will show a downward slope on the graph.
Hint: The graph will show a downward slope at t1 when the parachute opens.
Step 4: Steady Speed
After some time, the parachutist reaches a steady speed (terminal velocity) where the force of gravity is balanced by the air resistance. At this point, the speed remains constant, and the graph will show a horizontal line.
Hint: Look for a horizontal line indicating constant speed after the initial decrease.
Step 5: Hitting the Ground
Finally, at time t2, the parachutist hits the ground. The speed at this moment will be the terminal velocity, and the graph will end here.
Hint: The graph will stop at t2, showing the final speed just before hitting the ground.
Conclusion
Based on the analysis, the correct speed-time graph should start at zero, show a positive slope (acceleration), a downward slope (deceleration when the parachute opens), and then a horizontal line (steady speed) until it reaches the point of impact.
Final Answer
The correct option that represents this motion is Option A, which shows the described characteristics of the speed-time graph.
When the parachutist jumps out of the plane, his initial speed is zero. This is the starting point of the graph.
After jumping, the parachutist accelerates downwards due to gravity. This means that the speed increases steadily over time. The graph during this phase will be a straight line with a positive slope, indicating constant acceleration.
At time t1, the parachutist opens the parachute. This action creates a significant increase in air resistance, which opposes the downward motion. As a result, the speed of the parachutist will begin to decrease. This phase will show a downward slope on the graph.
After some time, the parachutist reaches a steady speed (terminal velocity) where the force of gravity is balanced by the air resistance. At this point, the speed remains constant, and the graph will show a horizontal line.
Finally, at time t2, the parachutist hits the ground. The speed at this moment will be the terminal velocity, and the graph will end here.
Based on the analysis, the correct speed-time graph should start at zero, show a positive slope (acceleration), a downward slope (deceleration when the parachute opens), and then a horizontal line (steady speed) until it reaches the point of impact.
The correct option that represents this motion is Option A, which shows the described characteristics of the speed-time graph.
Topper's Solved these Questions
- BOOK - SCIENCE OLYMPIAD FOUNDATION CHAPTER - MOTION EXERCISE - ACHIEVERS SECTION (HOTS)5videos
MOTION
- BOOK - SCIENCE OLYMPIAD FOUNDATION CHAPTER - GRAVITATION EXERCISE - ACHIEVERS SECTION (HOTS)5videos
GRAVITATION
- BOOK - SCIENCE OLYMPIAD FOUNDATION CHAPTER - NSO QUESTION PAPER 2016 SET A EXERCISE - ACHIEVERS SECTION2videos
NSO QUESTION PAPER 2016 SET A
Similar Questions
Knowledge Check
- Question 1 - Select One or More
Which of the following speed-time graphs is not possible:
A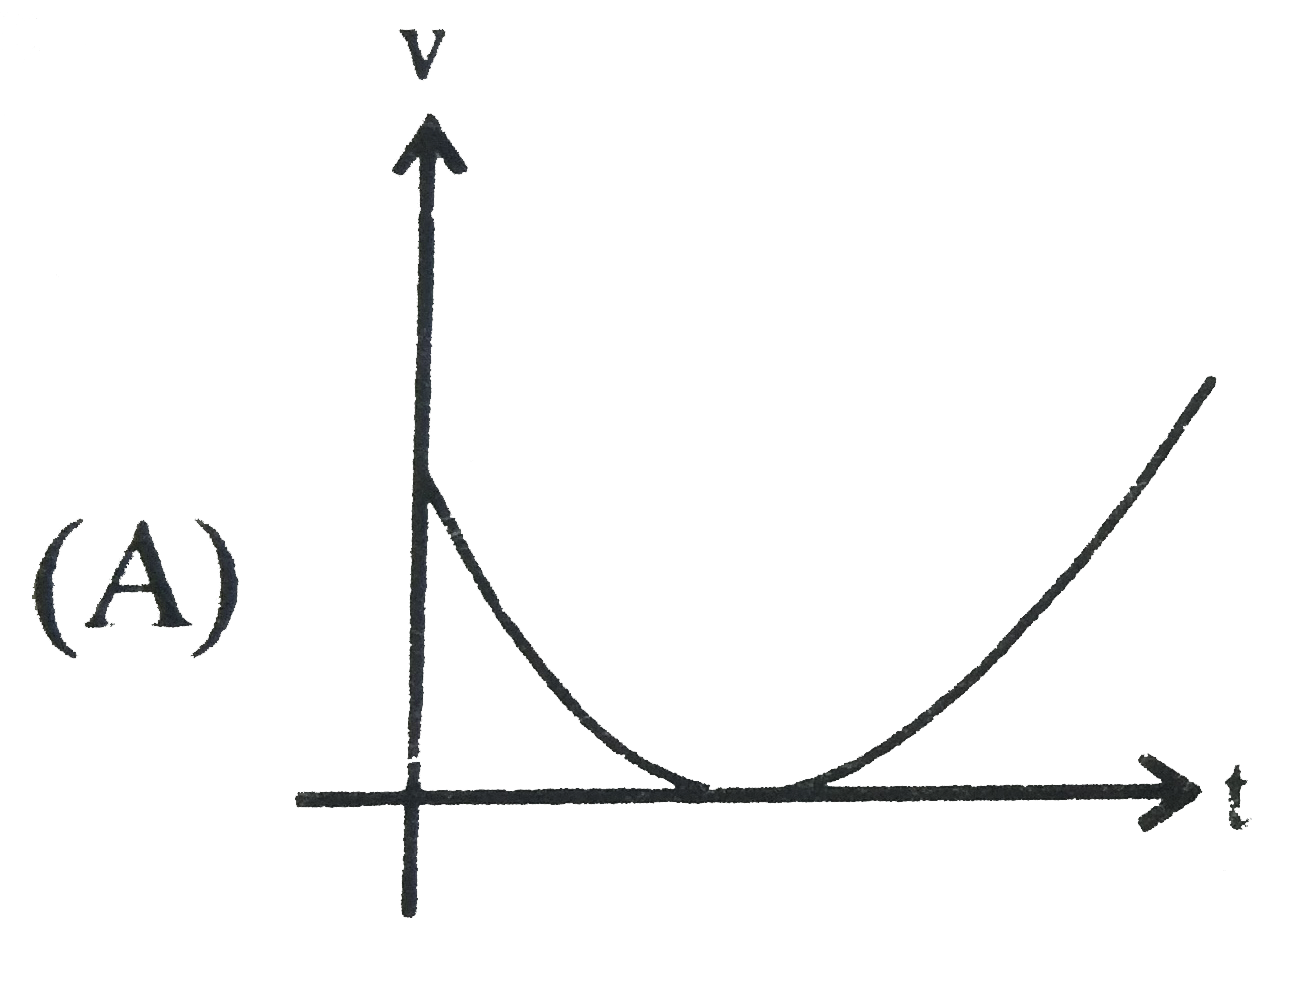 B
B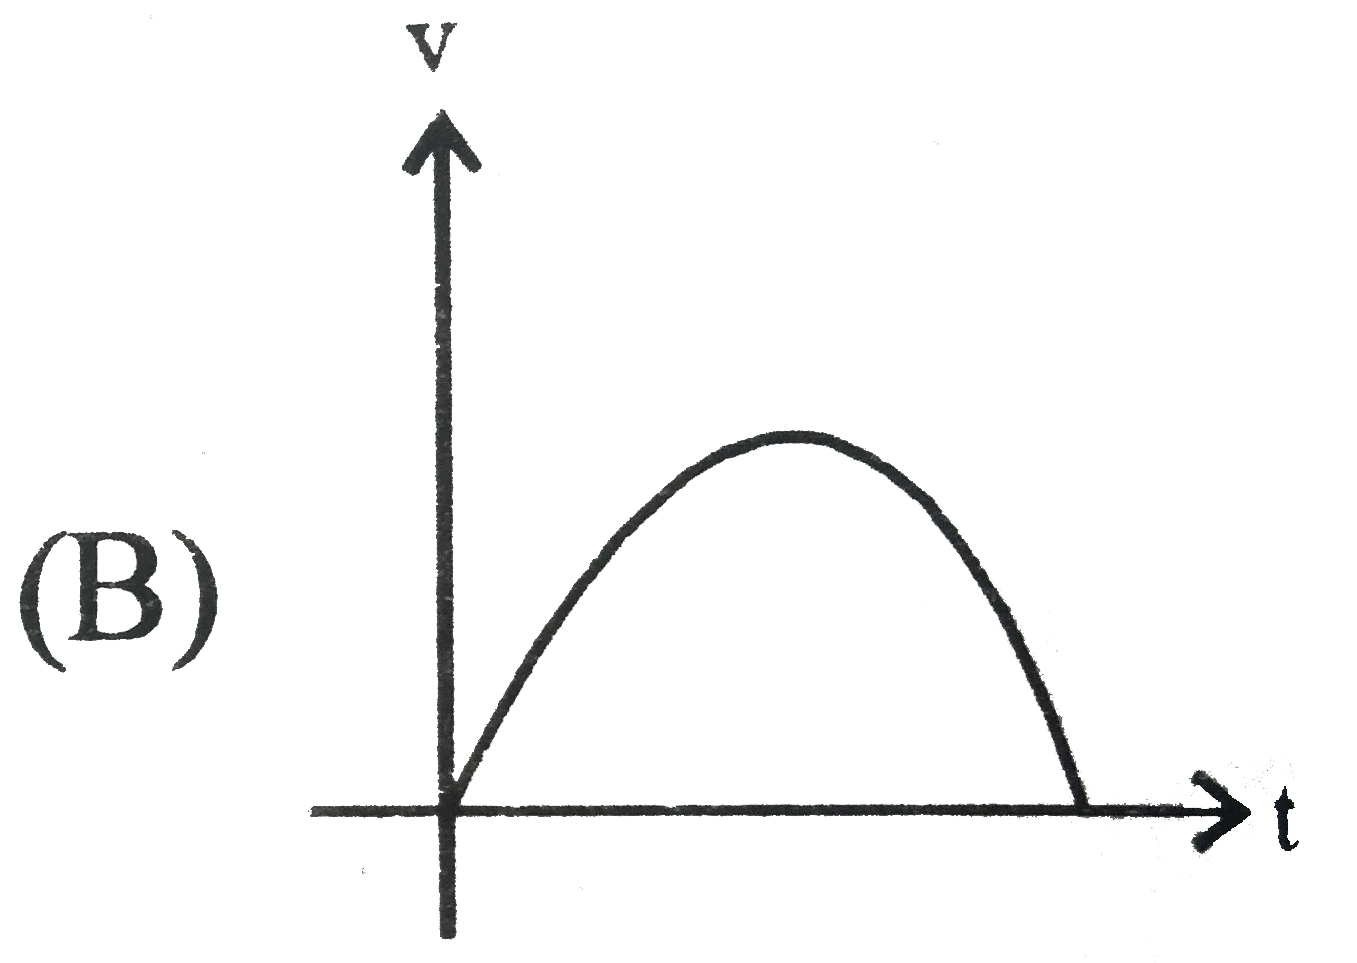 C
C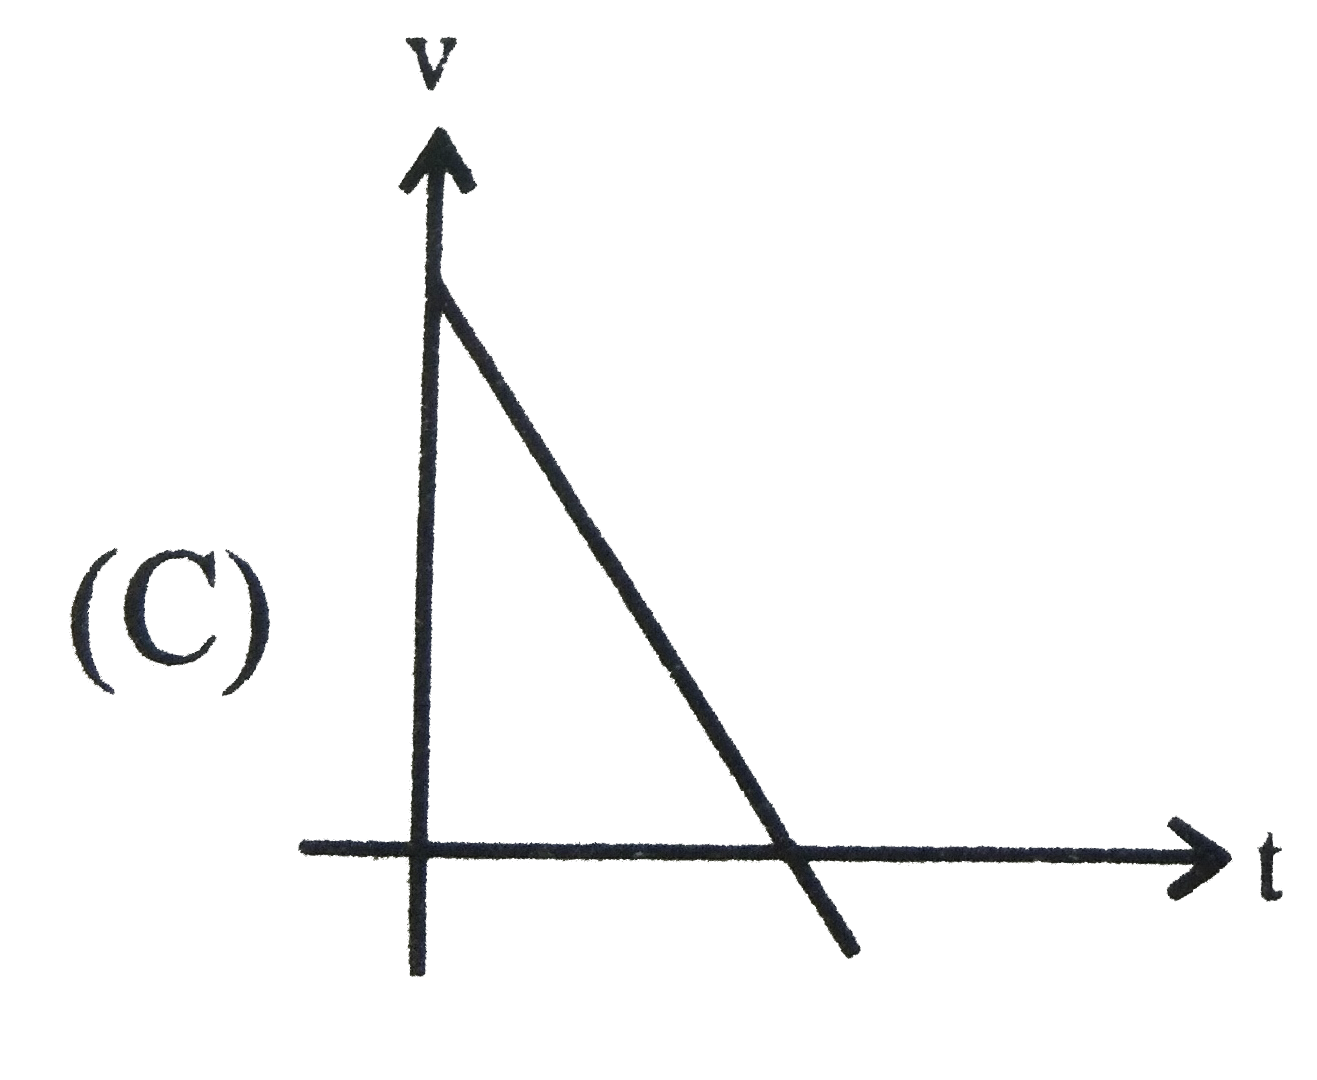 D
D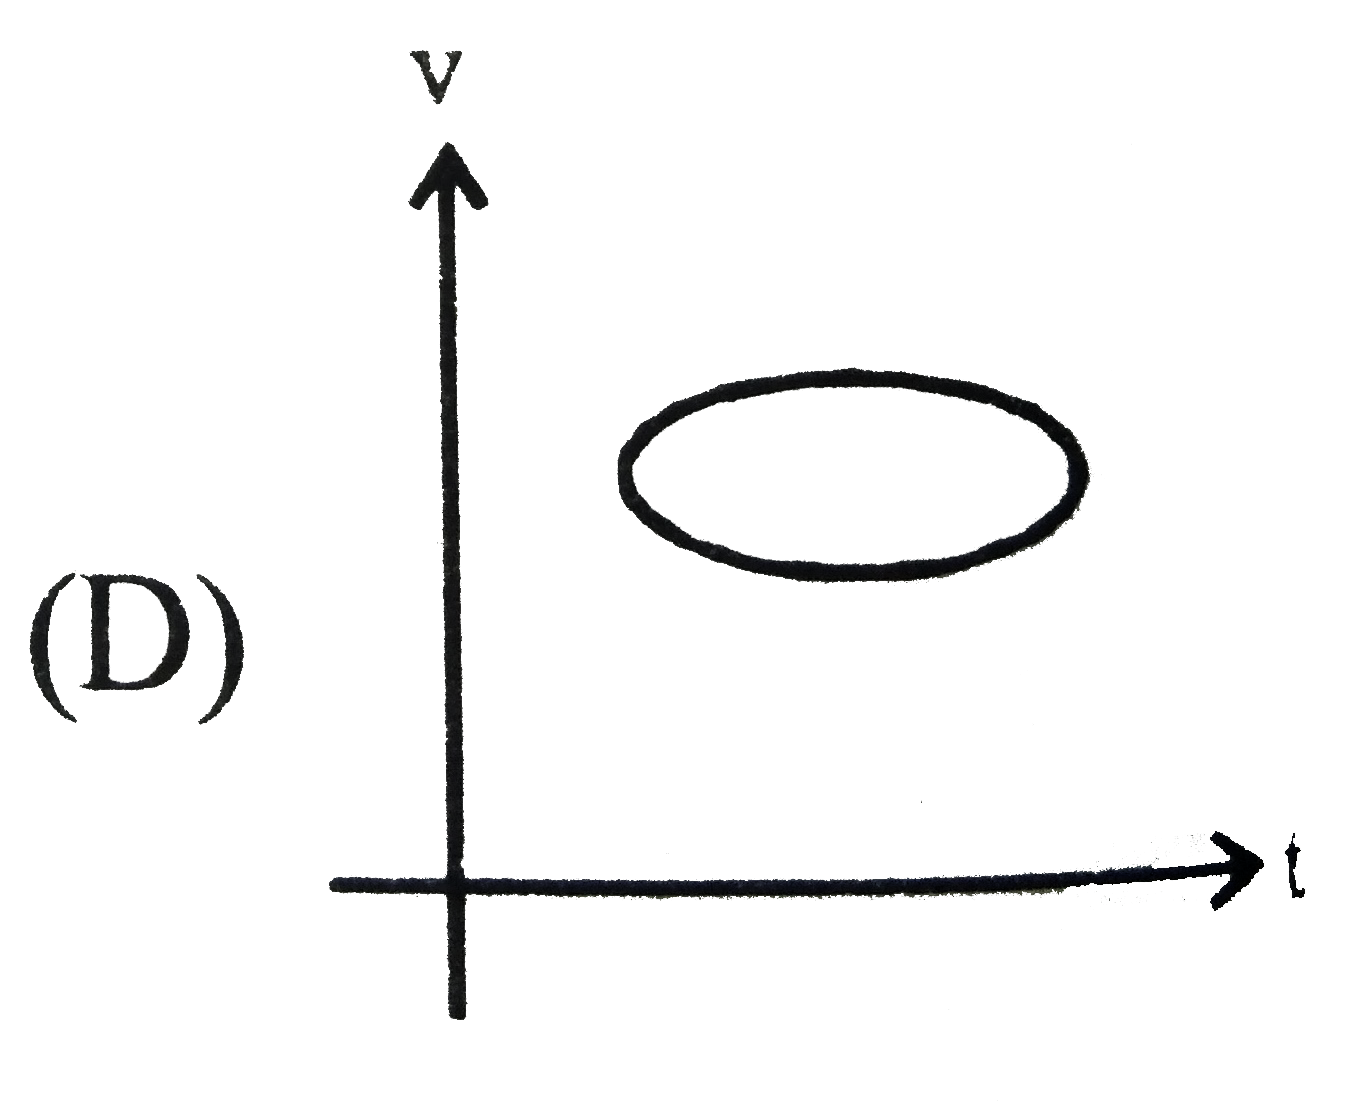
- Question 2 - Select One
Which of the following cannot be speed (v) - time (t) graph?
A B
B C
C D
D
- Question 3 - Select One
Which of the following cannot be speed-time graph of a body in motion?
A B
B C
C D
D
Which of the following shows velocity (v) - time (t) graph for falling apple?
View SolutionWhich of the following speed - time (v - t) graphs is physically not possible?
View SolutionFor a particle in motion which of the following speed-time graphs can be realized in practice :
 View Solution
Which of the following speed - time (υ−t) graph is physically not possible ?
View SolutionWhich of the following distance-time graphs shows a truck moving with speed which is not constant?
View Solution
