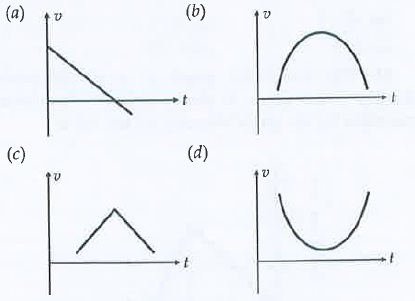
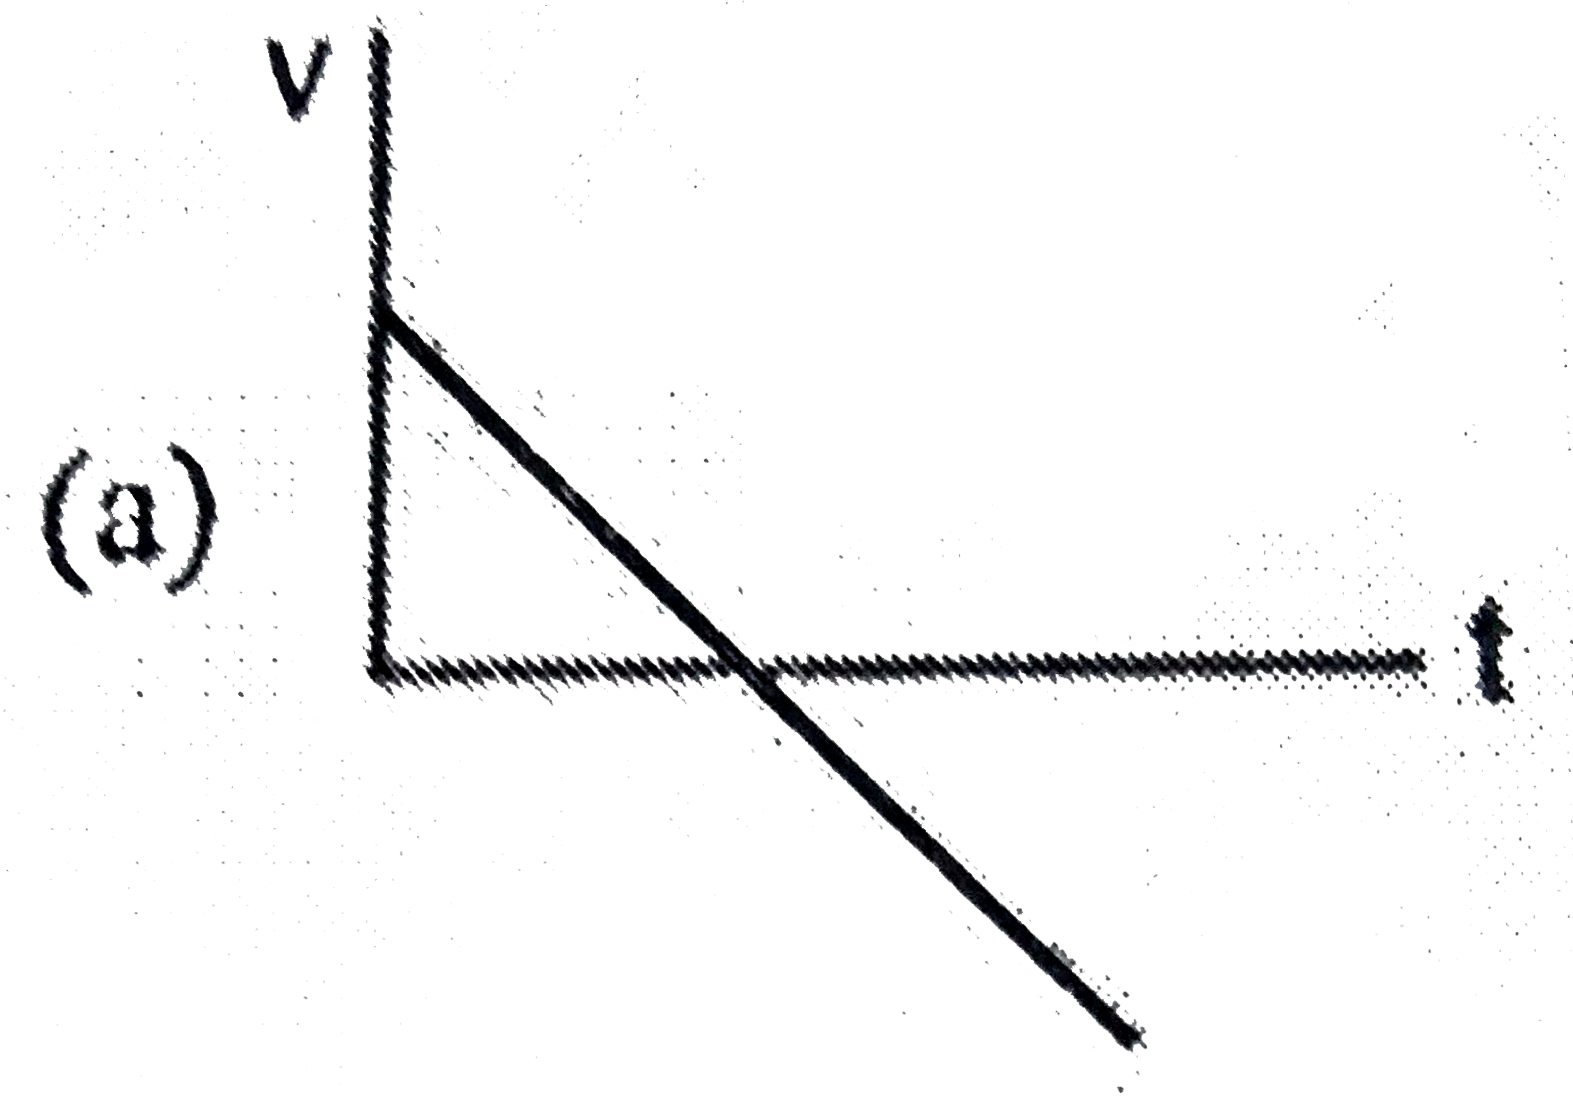
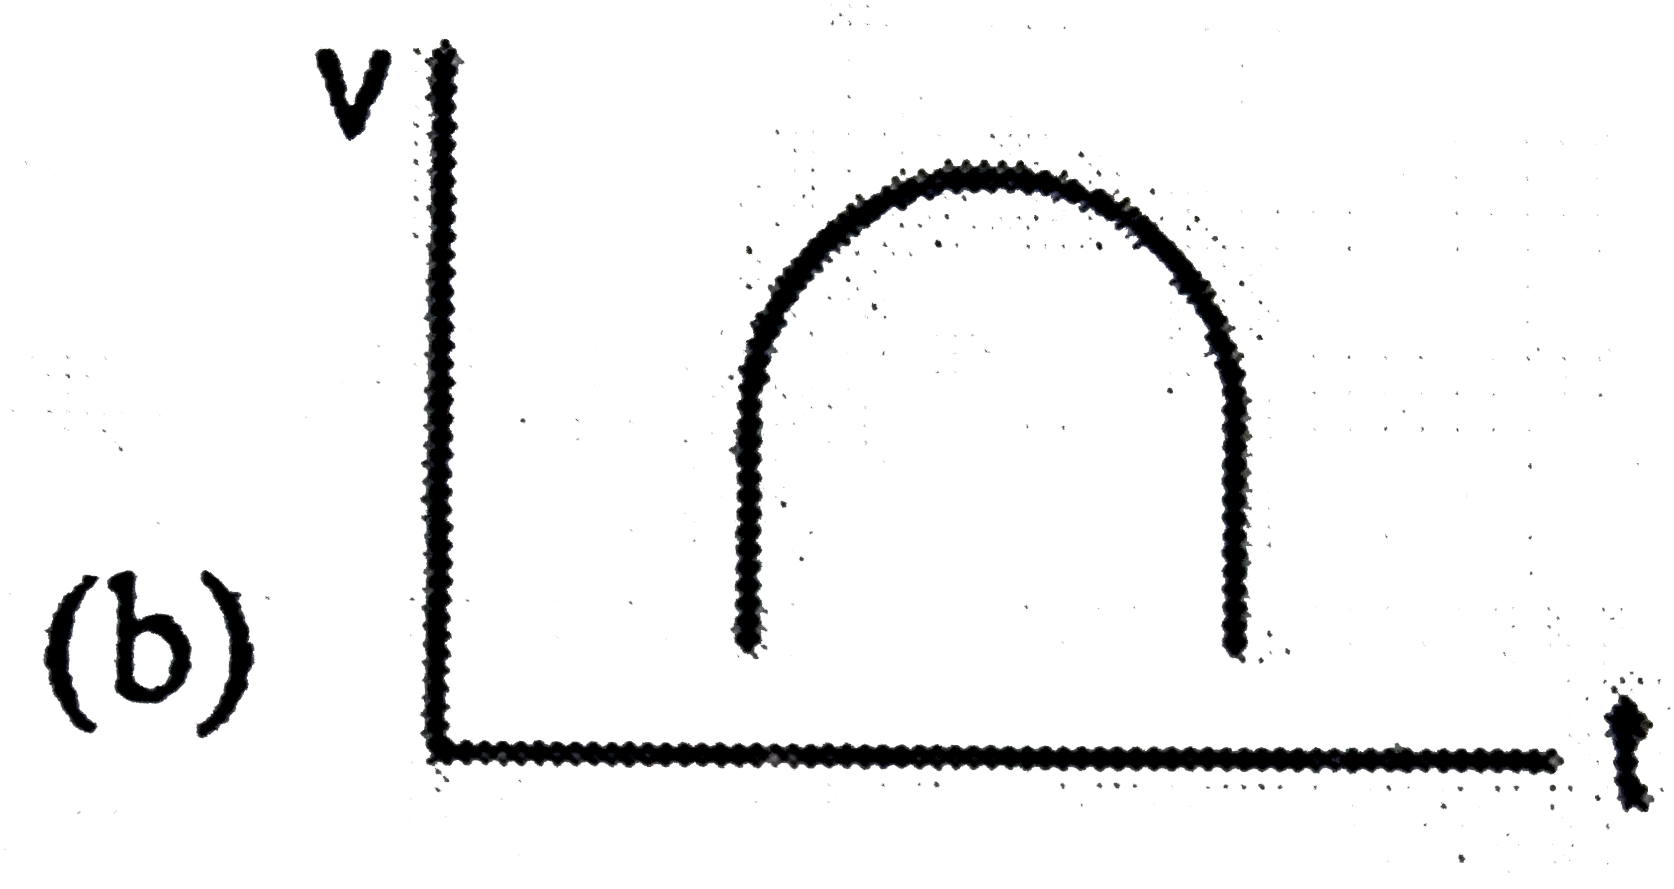
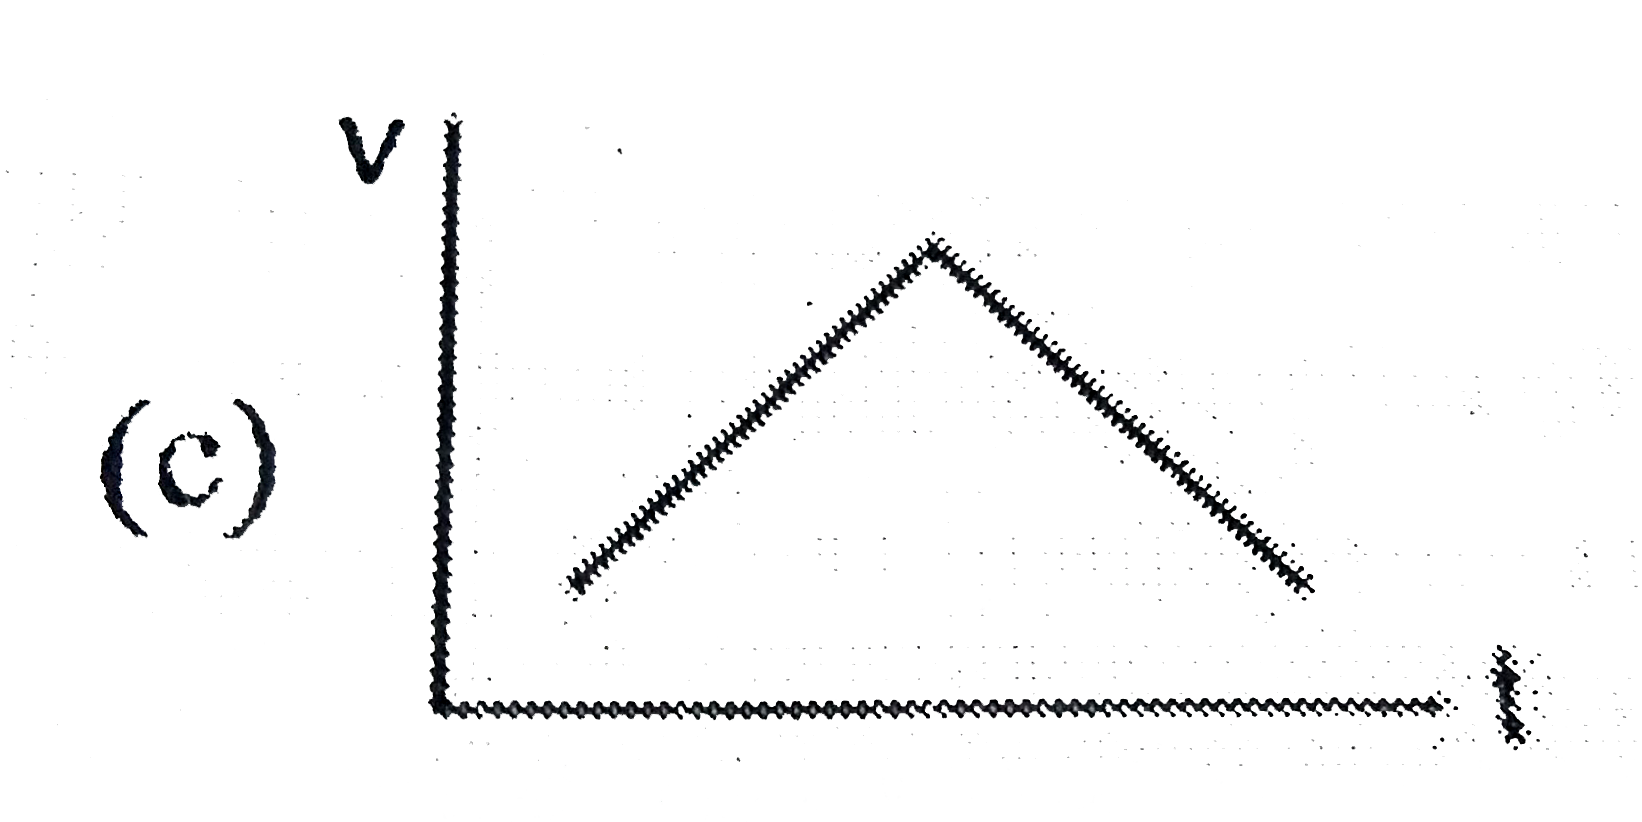
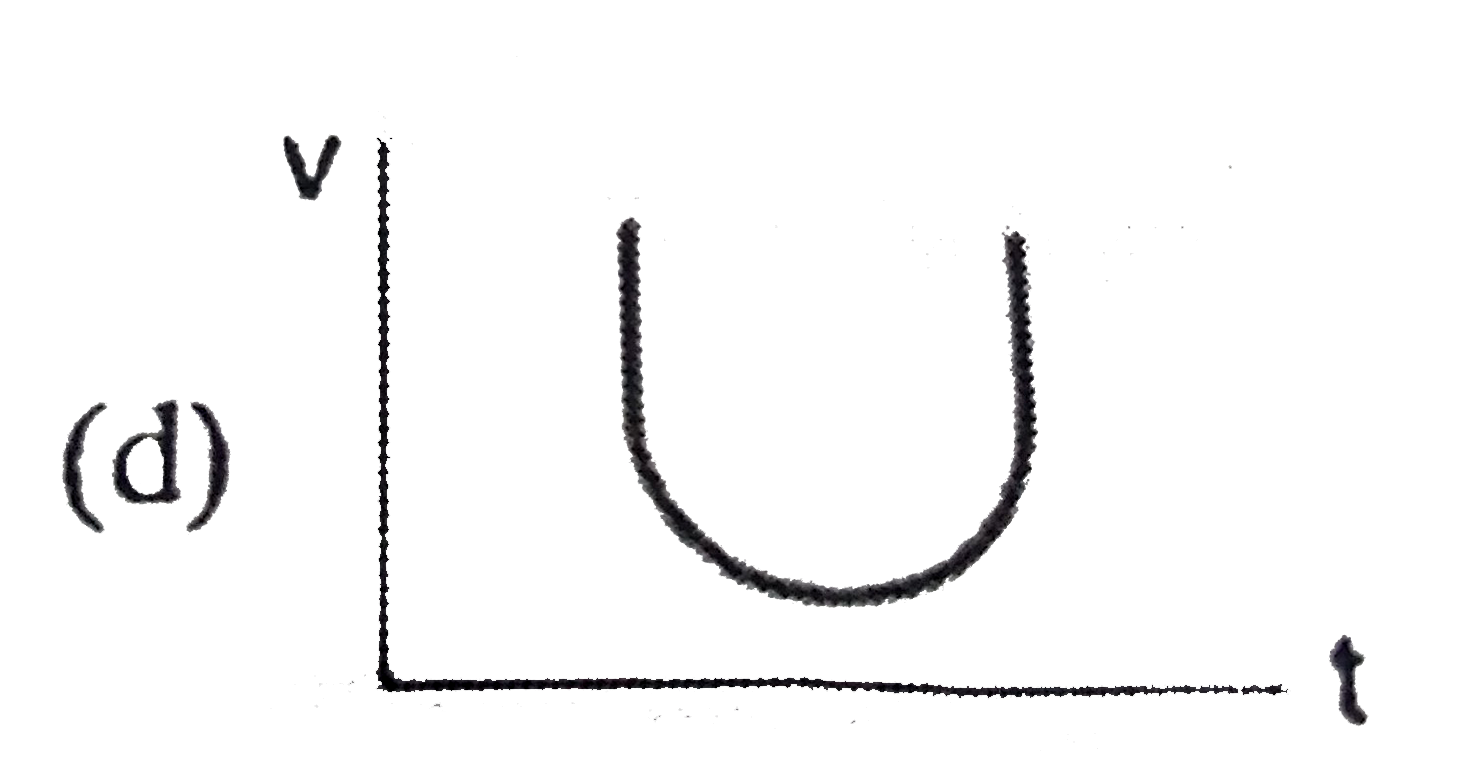
A particle is thrown above, then correct v−t graph will be
A
B
C
D
Video Solution
Text Solution
The correct Answer is:a
u=u+at
⇒v∝t (straight line graph)
As body goes upward (positive direction) speed of body decreases at uniform rate and becomes zero at the highest point. After that, the body falls downward (negative direction) and speed increases at uniform rate.
|
Topper's Solved these Questions
Similar Questions
Knowledge Check
A particle is thrown vertically upwards. The correct graph between its speed (v) and time (t) is given by (neglecting air resistance)
A B
B C
C D
D
A particle moves with constant acceleration a in the positive x-axis. At t=0 the particle is at origin is at rest , then correct graph between (velocity)2 and displacement is :
A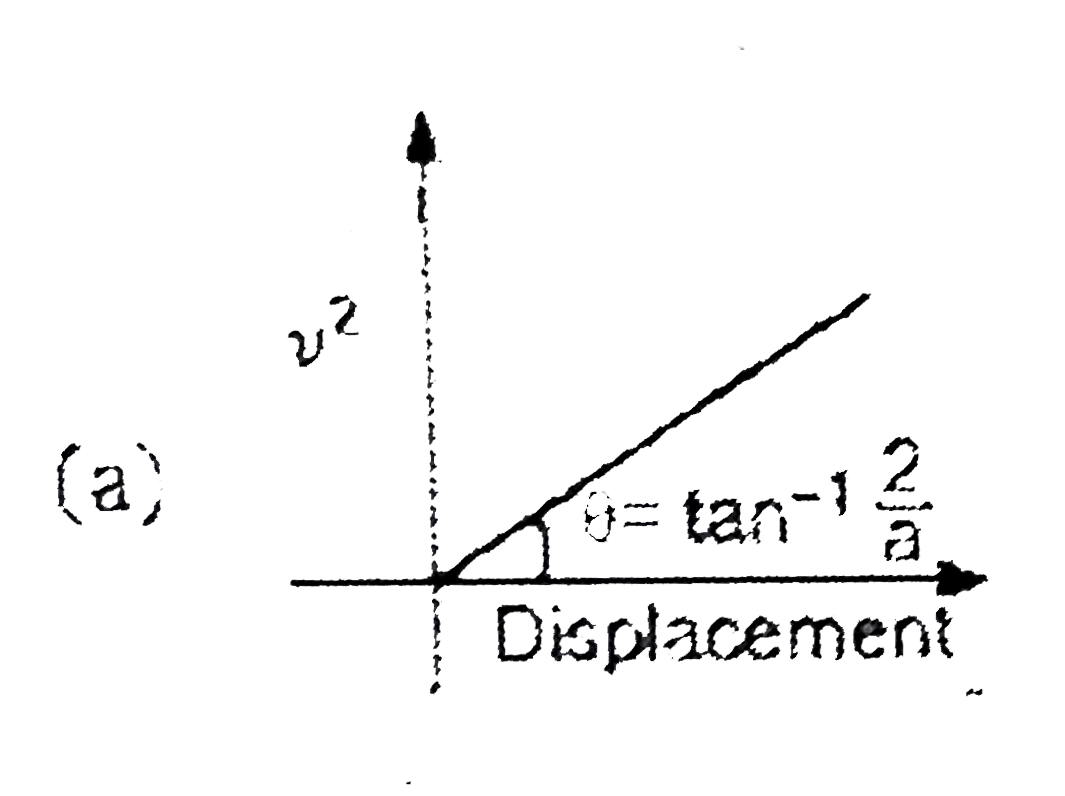 B
B C
C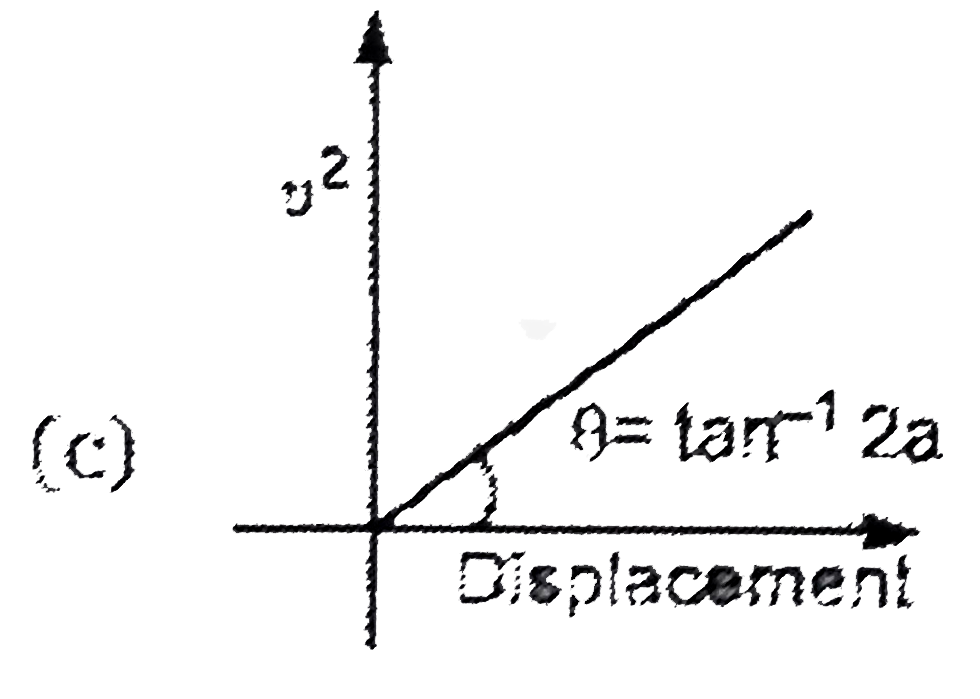 D
D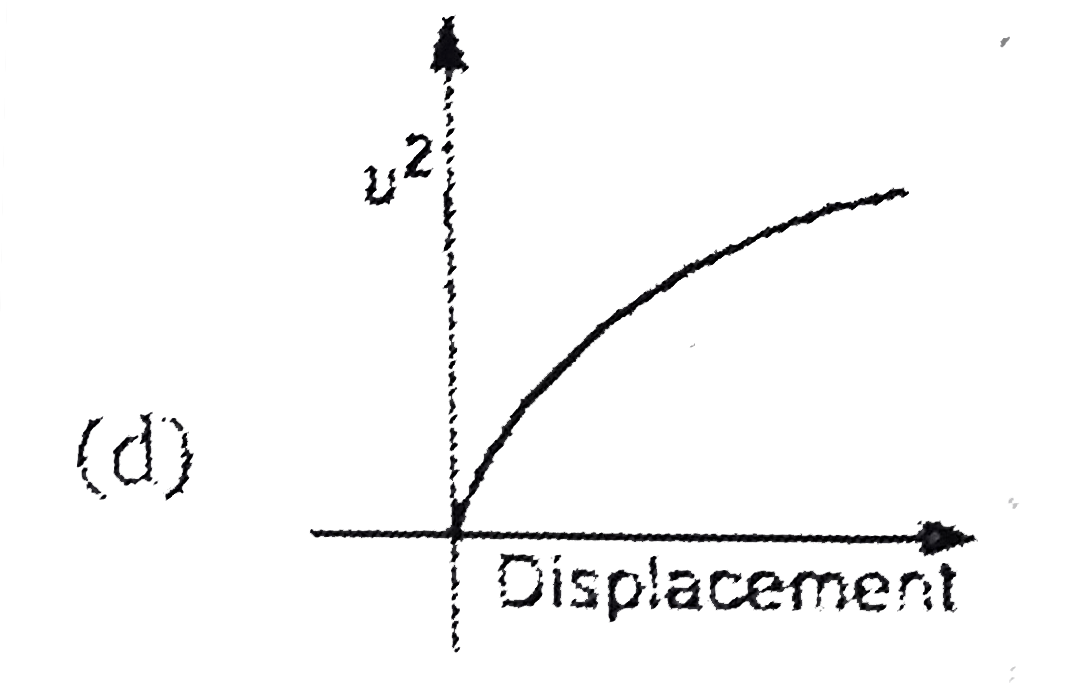
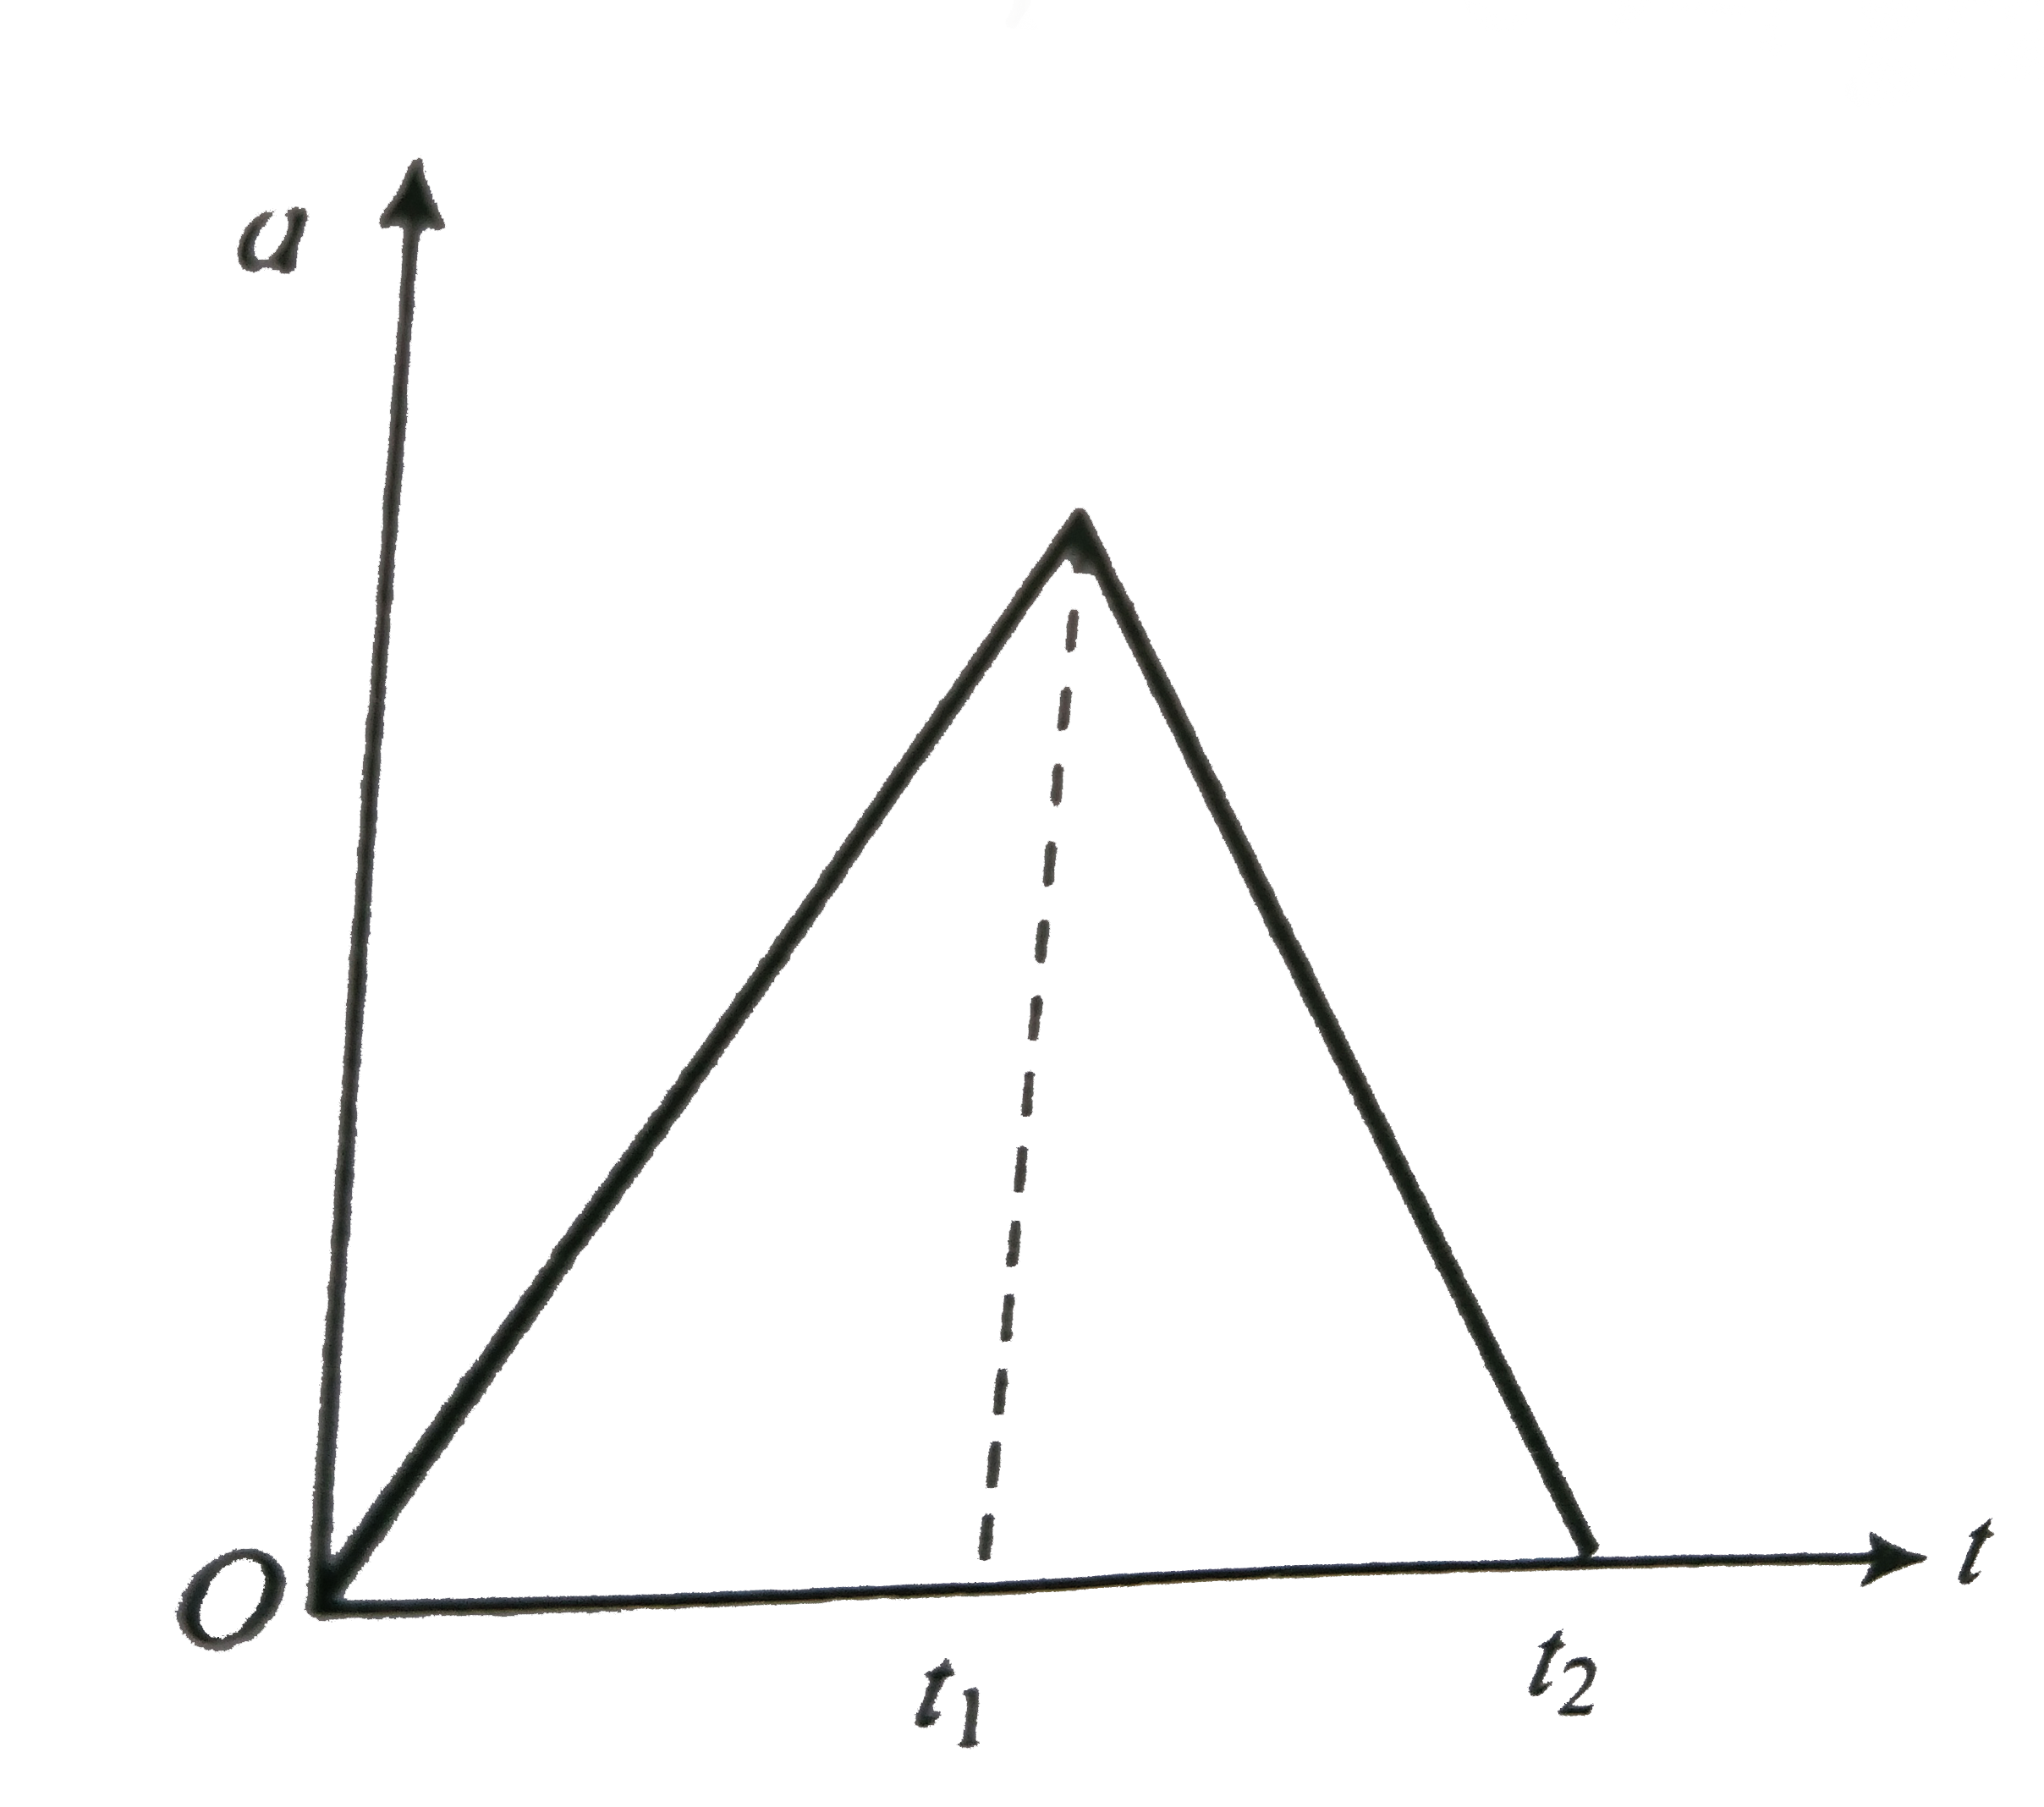
The acceleration versus time graph of a particle is shown in the figure. The respective v−t graph of the particle is .
 .A
.A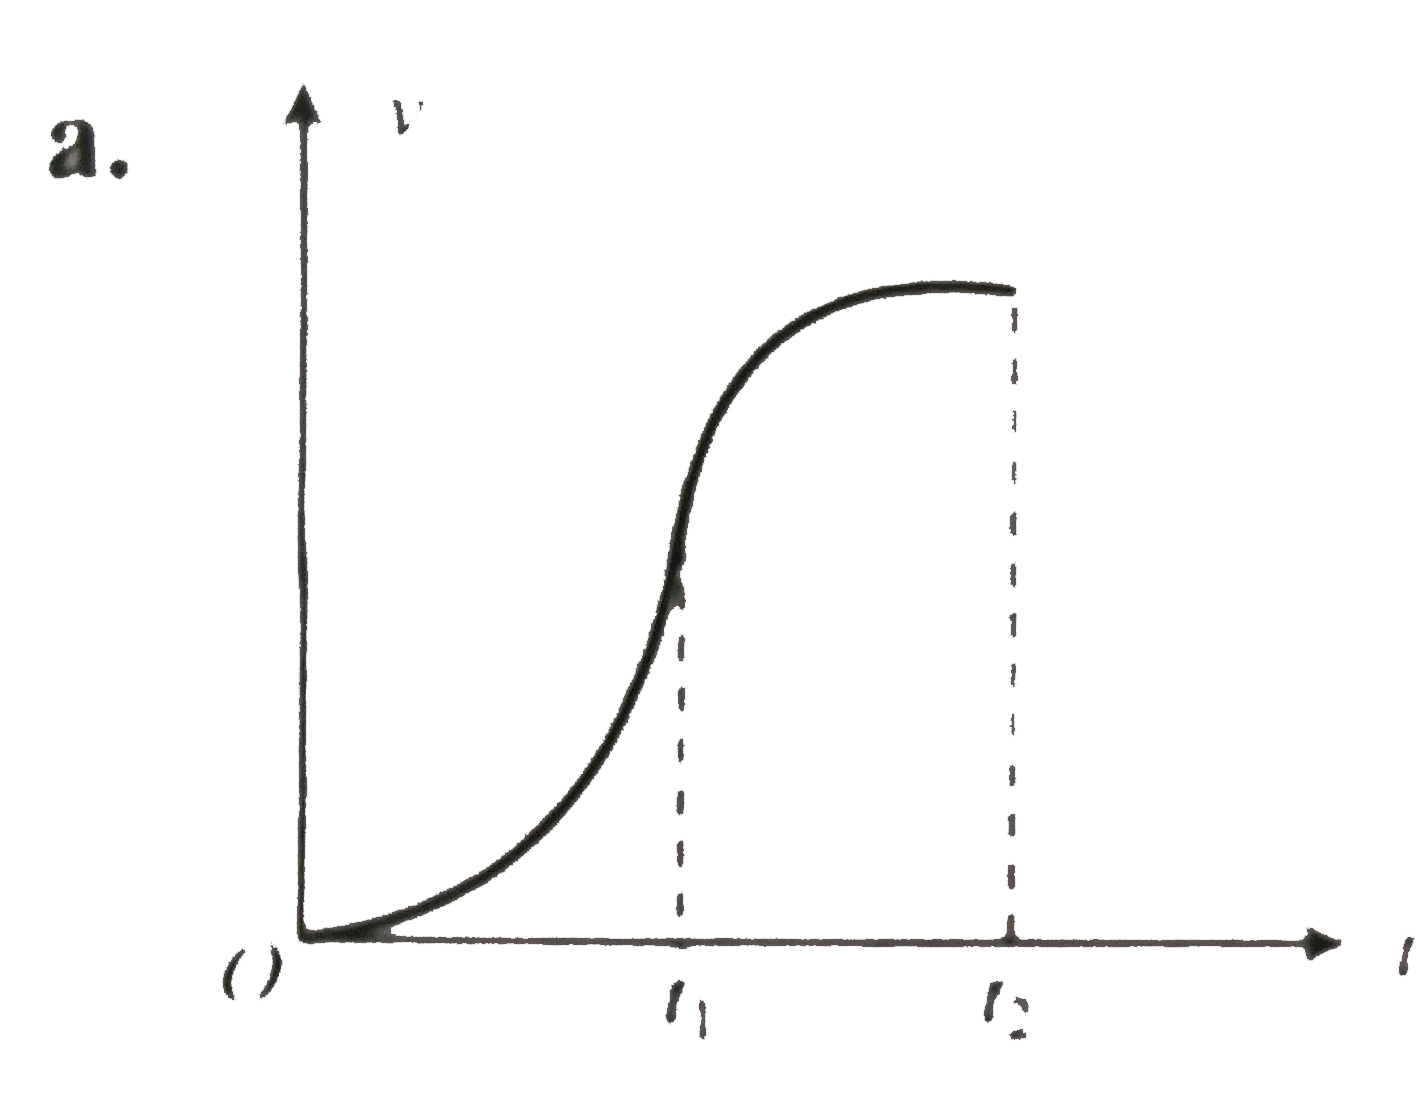 .B
.B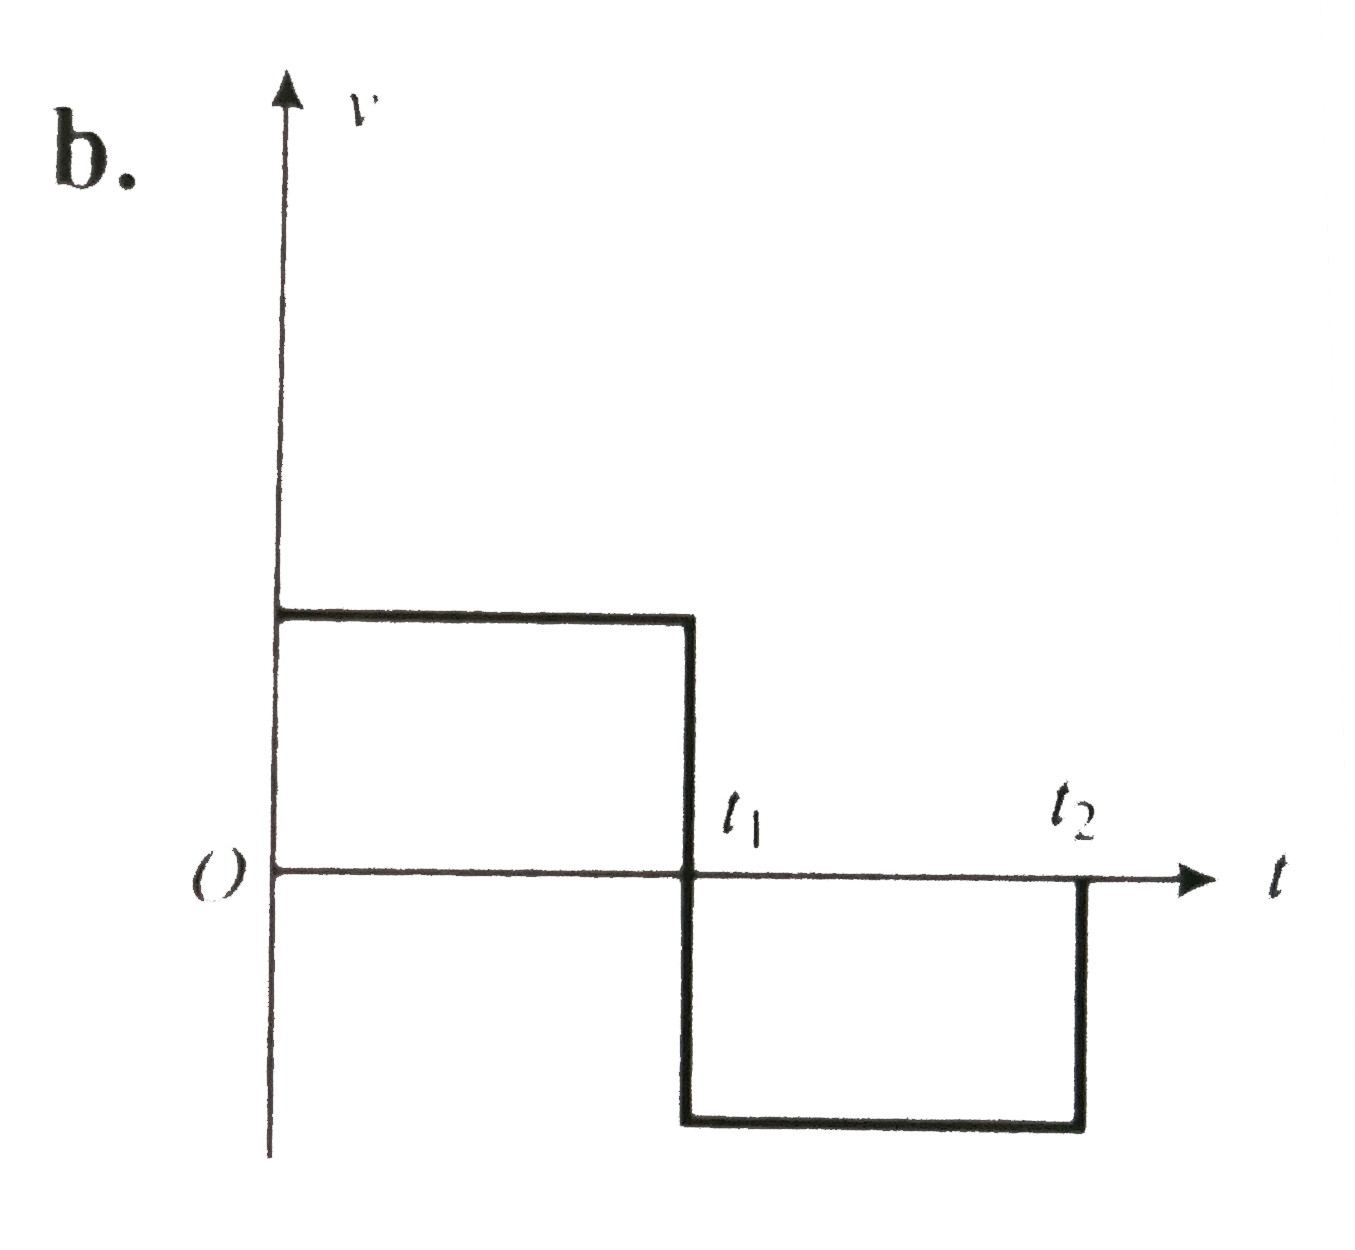 .C
.C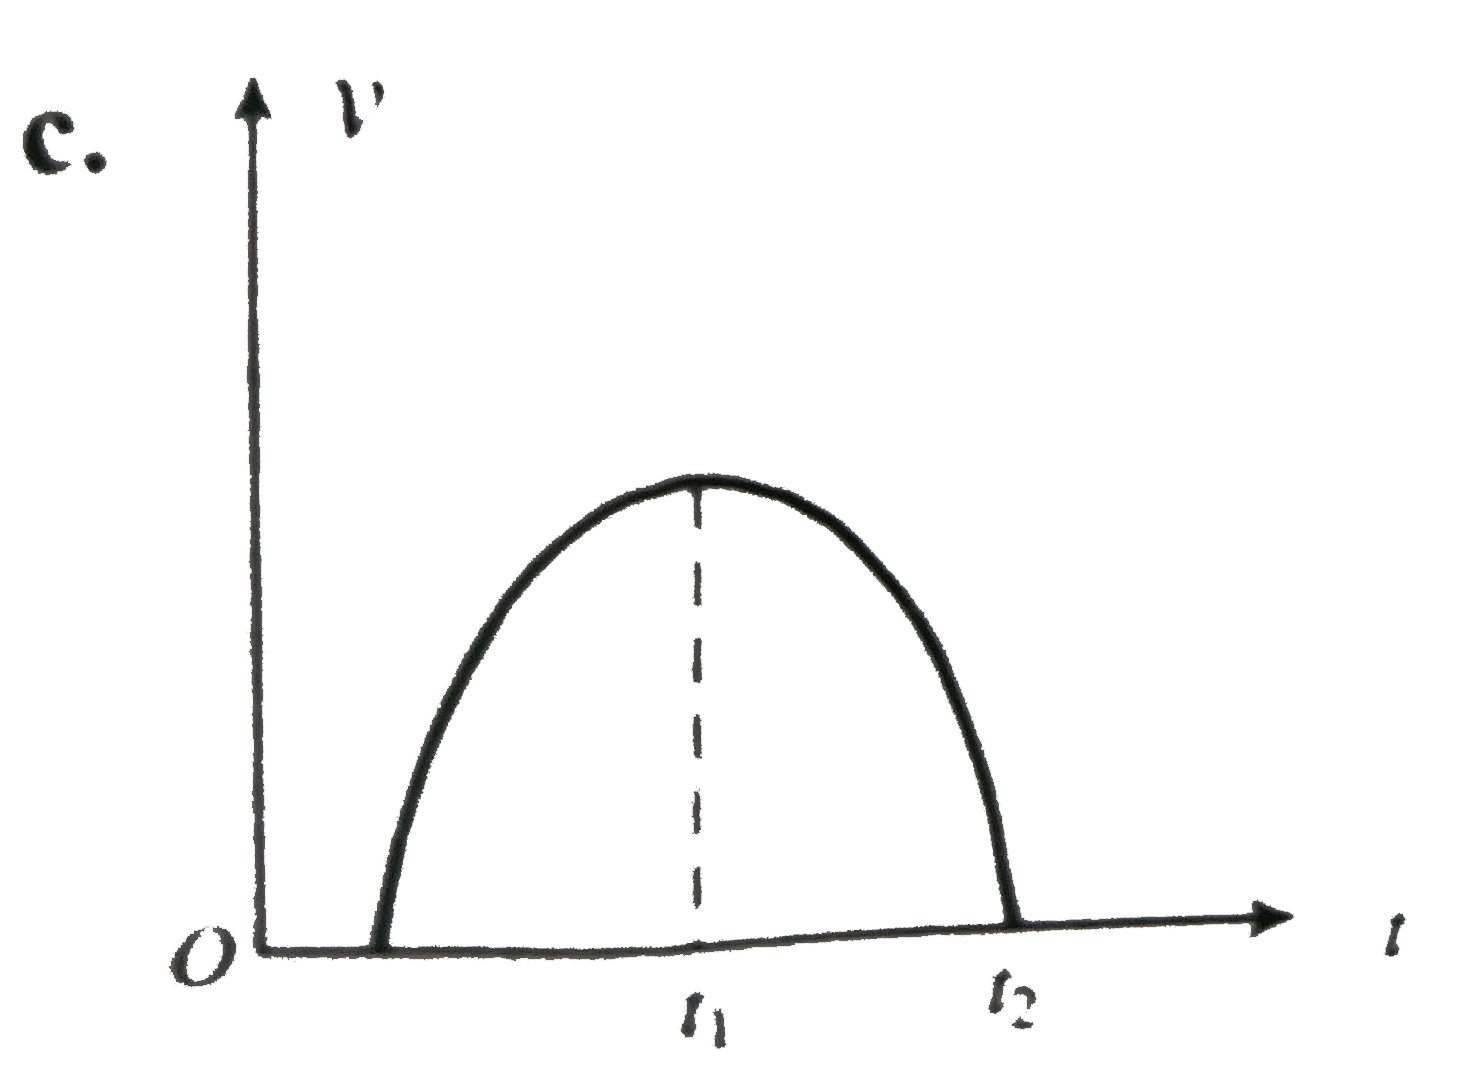 .D
.D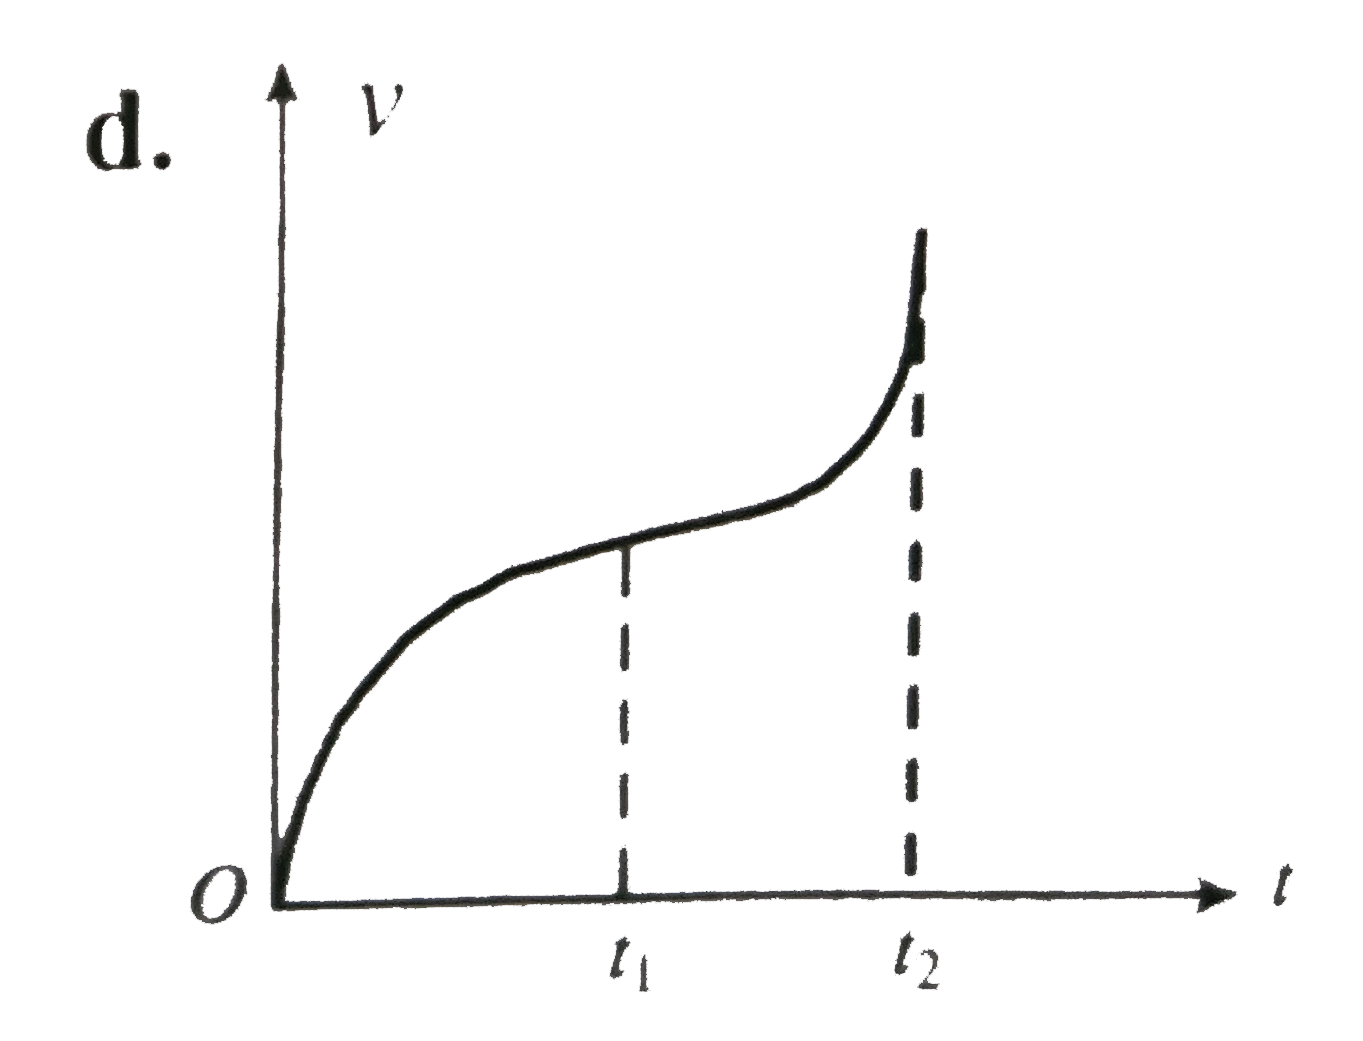 .
.
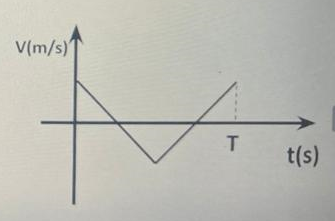
From given v-t graph identify correct a-t graph
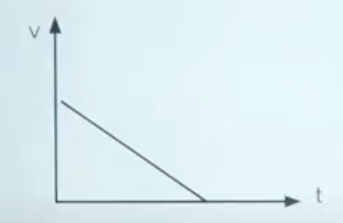
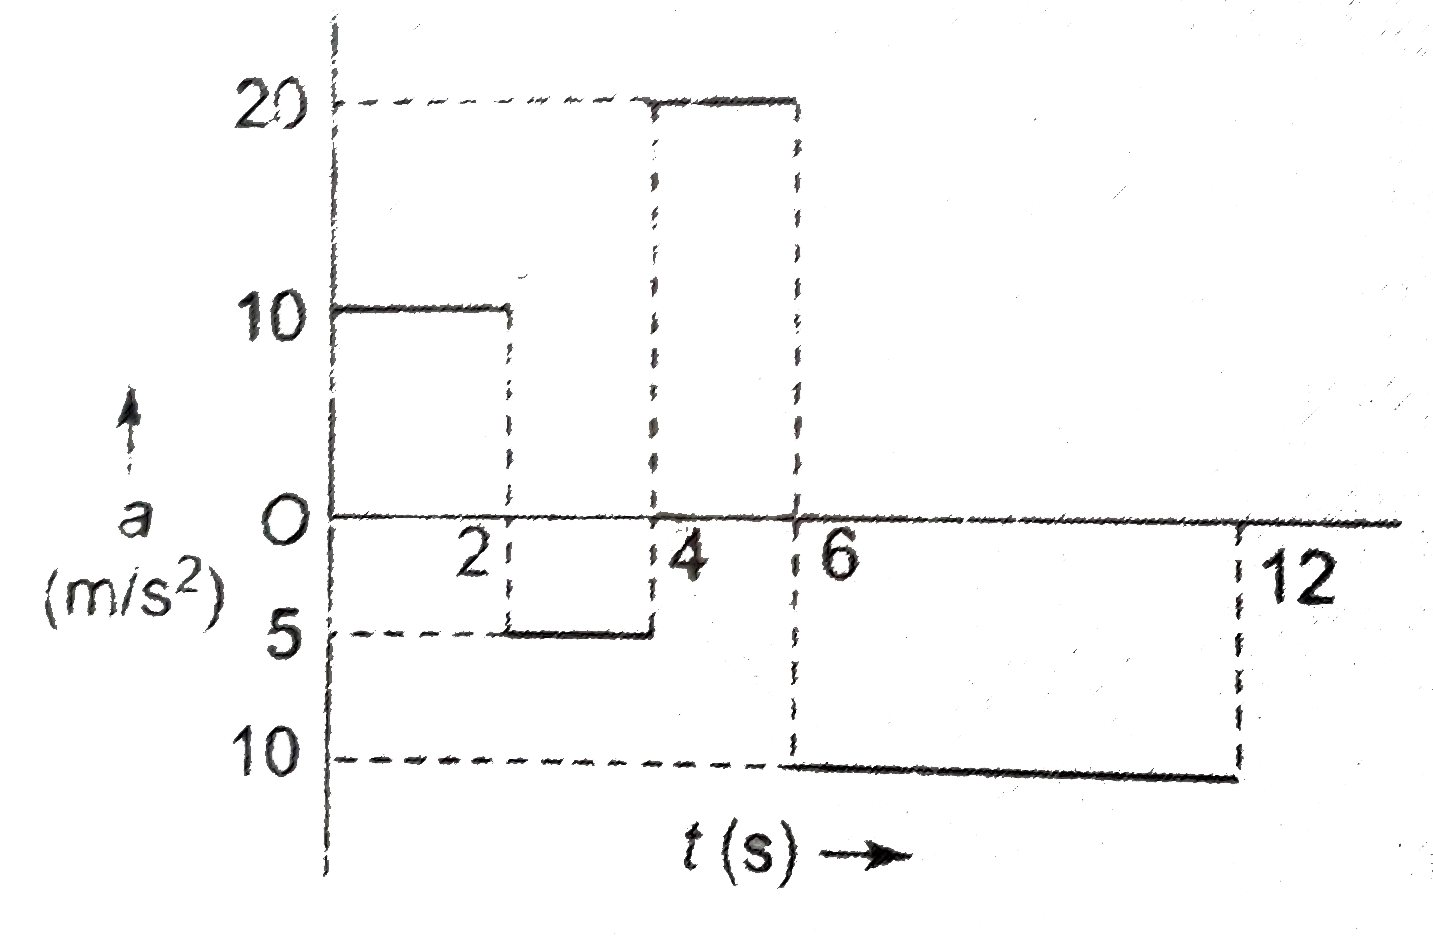
View SolutionA particle is moving along the x-axis. Consider it’s a-t graph. If initial velocity is 10 m//s, sketch the v-t graph and calculate the displacement in the time interval t=0 to 12 s.
View SolutionA particle obeys the following v - t graph as shown. The average velocity over 30 s is
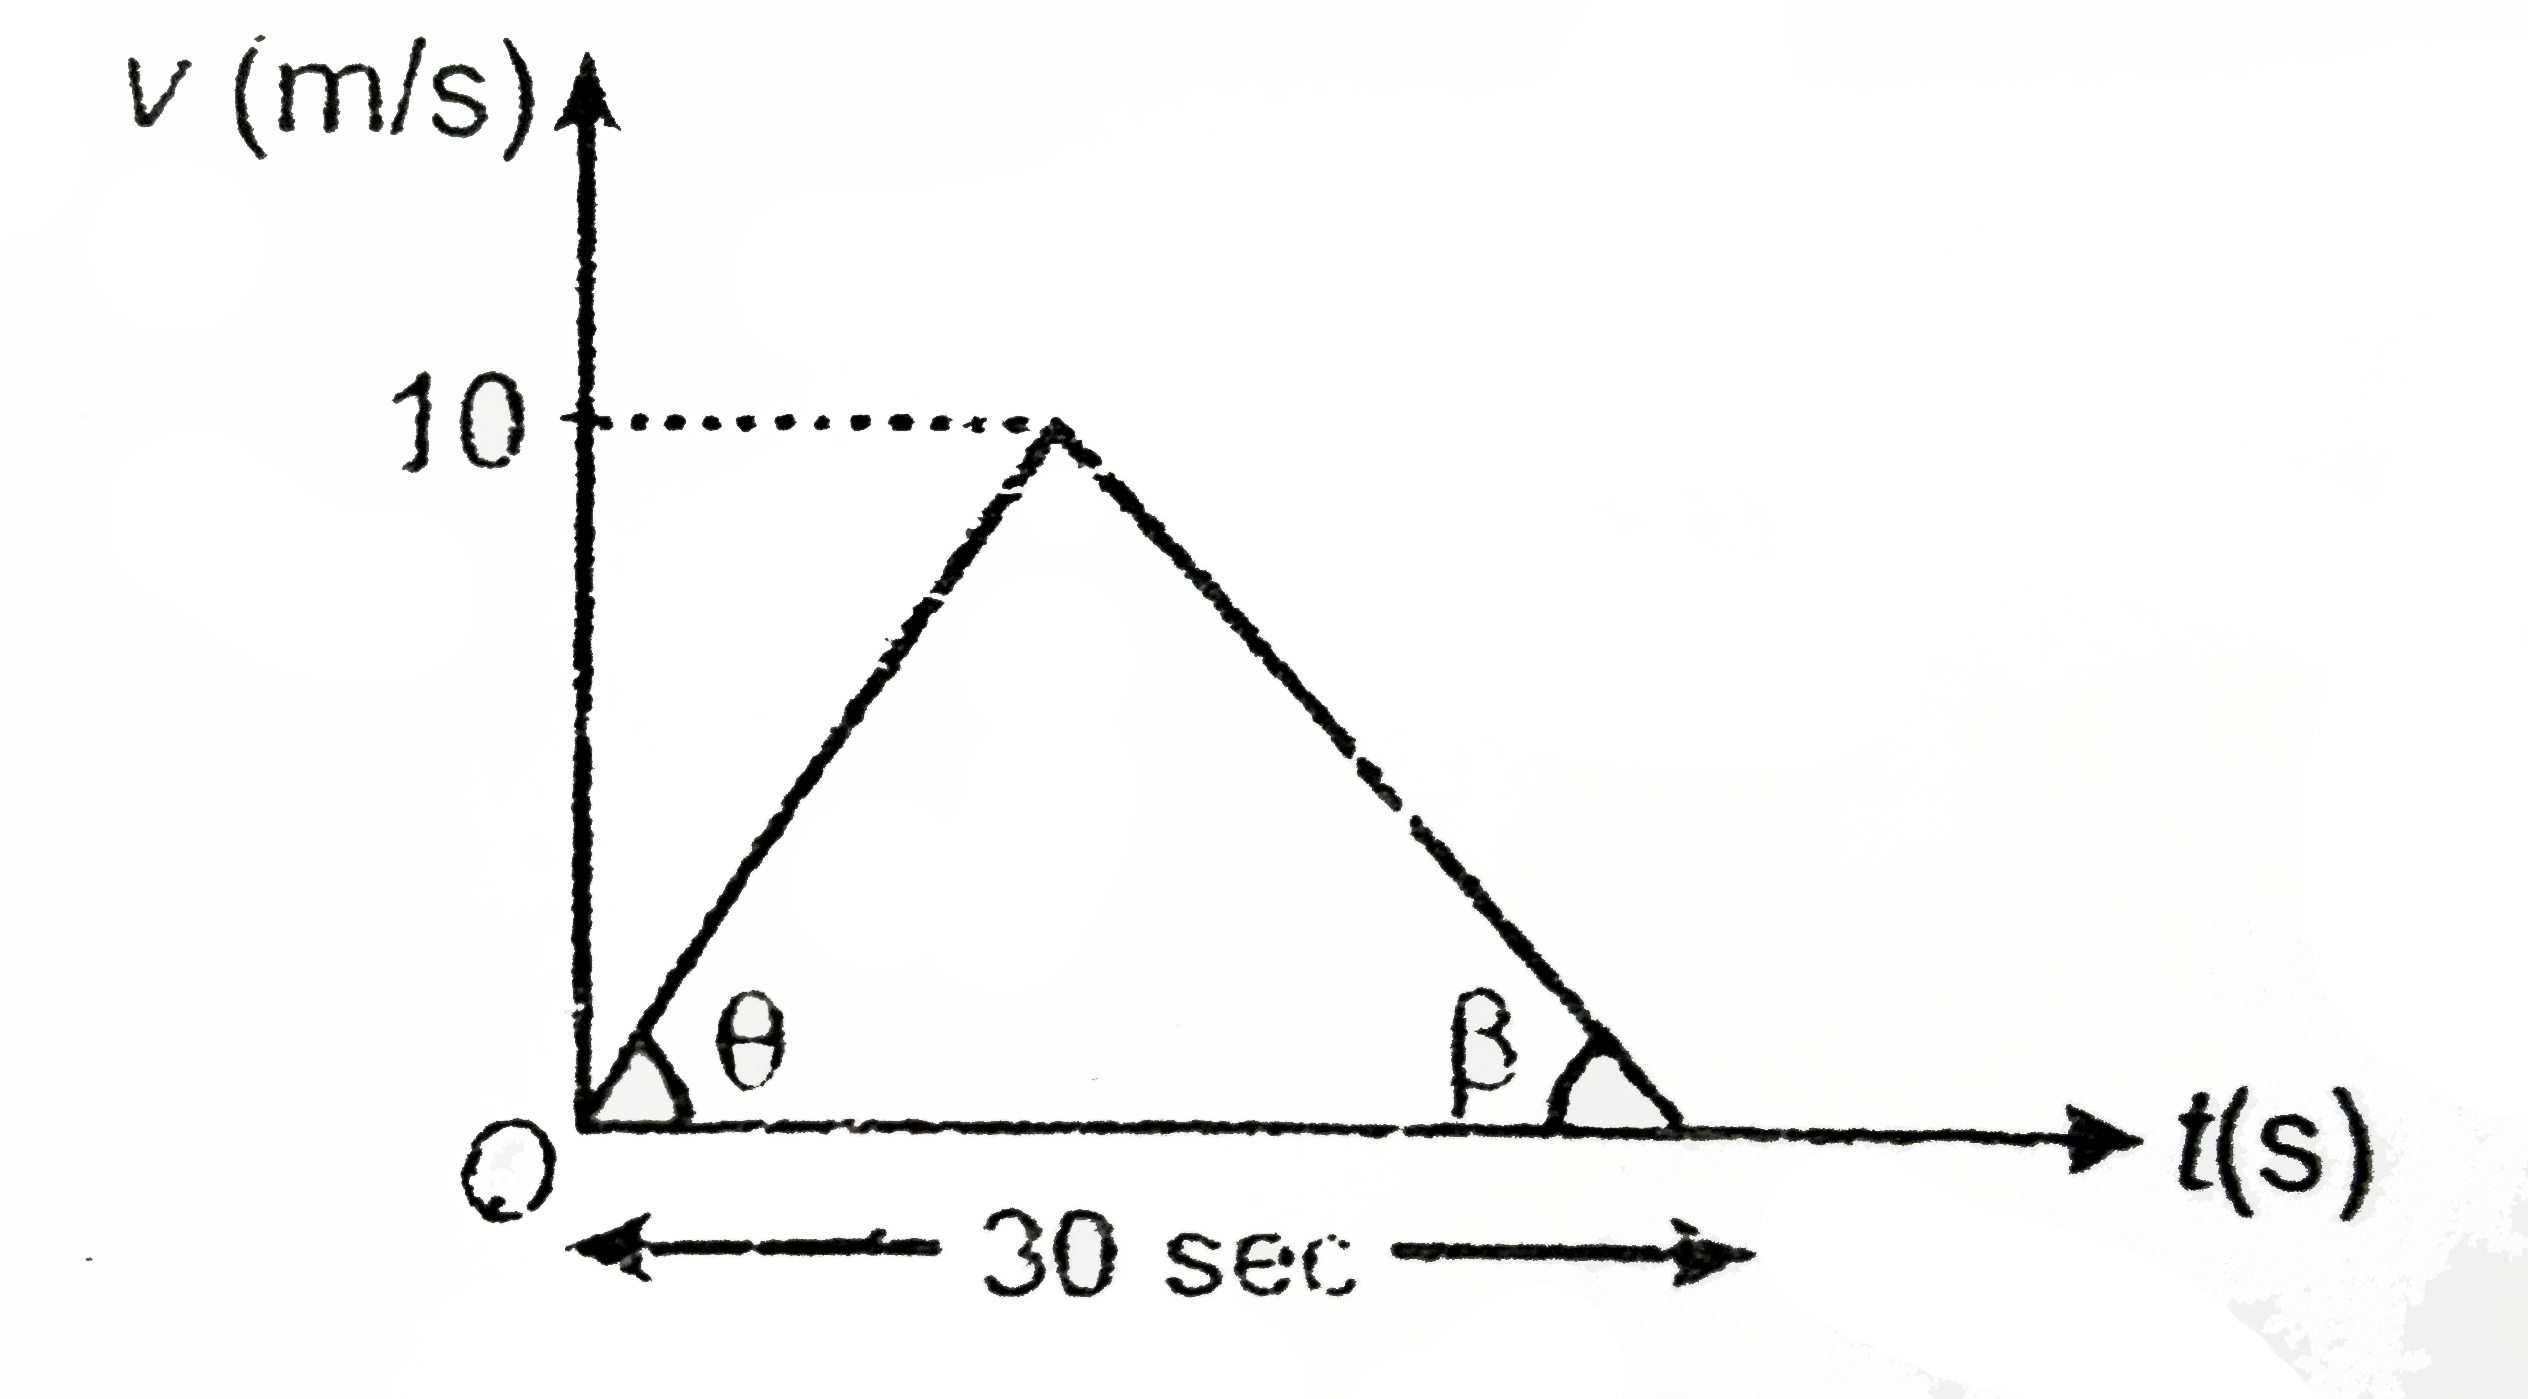
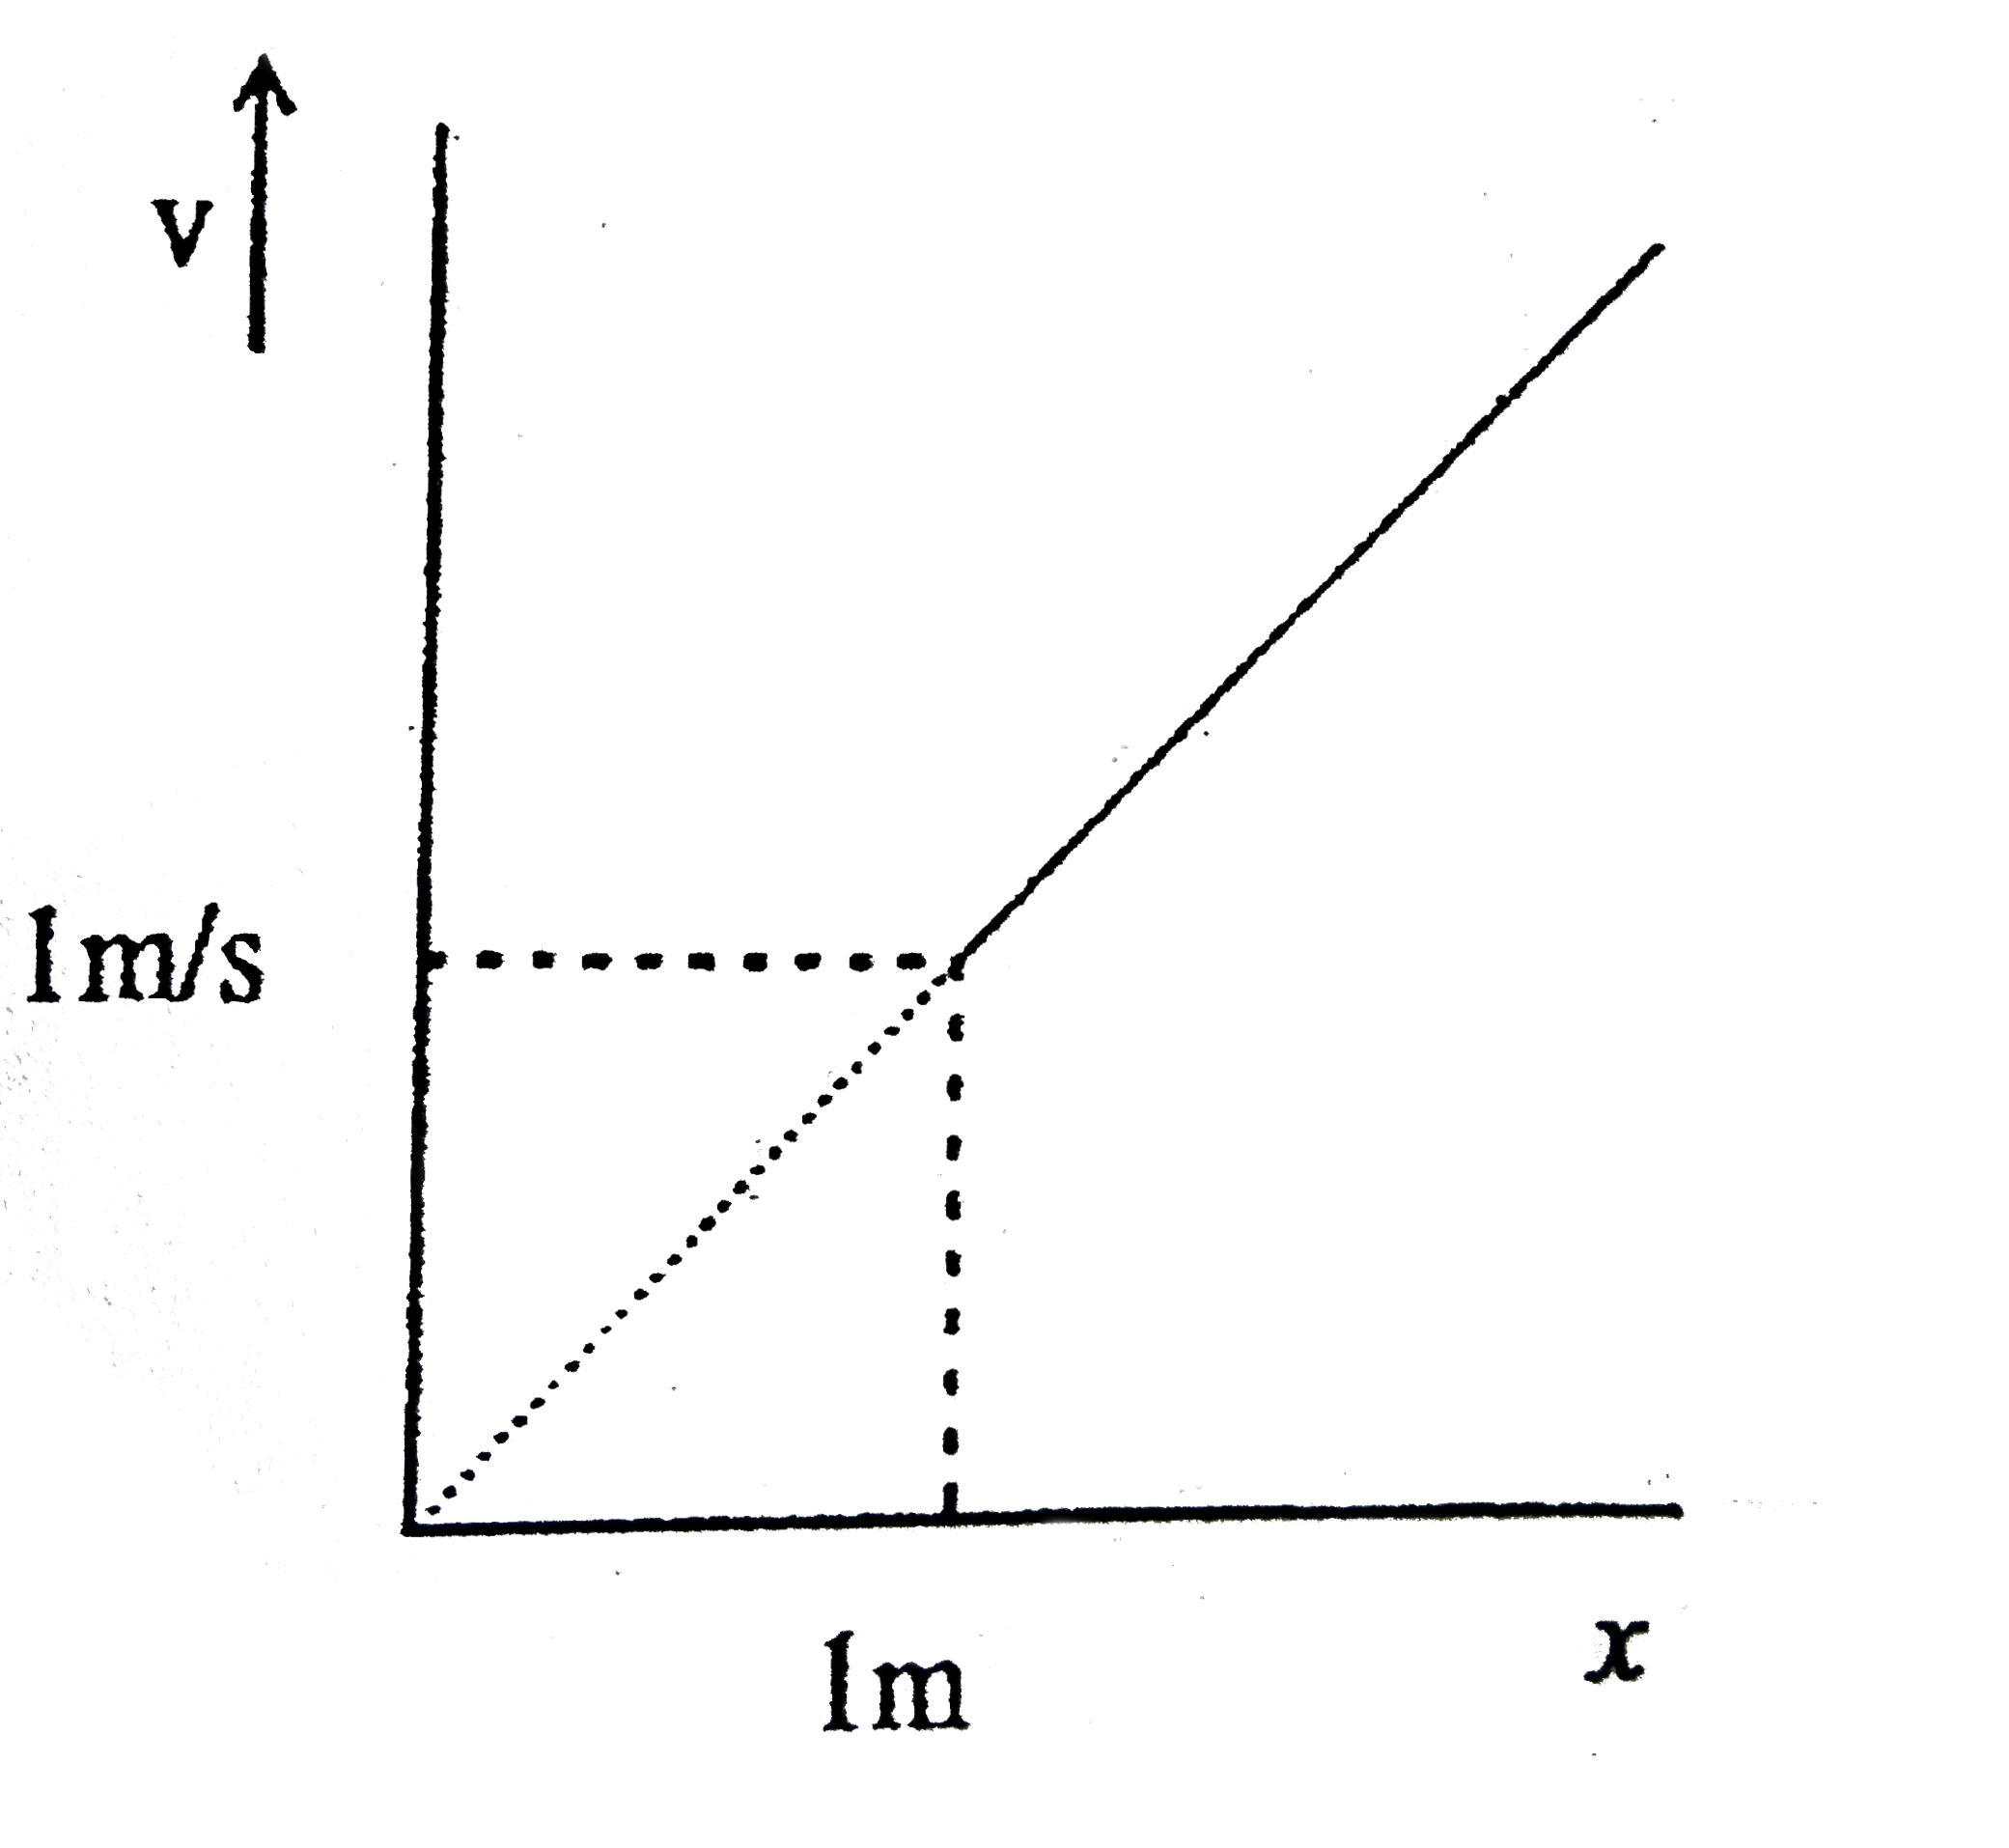
View SolutionA particle is moving in a straight line according to graph given below : (a is acceleration, v is velocity, x is position, t is time) :
View SolutionA particle moves along x− axis. It's velocity is a function of time according to relation V=(3t2−18t+24)m/s assume at t=0 particle is at origin.
Which of the following graph may be correct for the motion of particle
View Solution

