Choose the correct a vs t graph 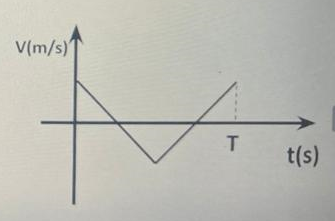
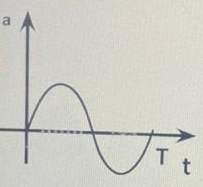
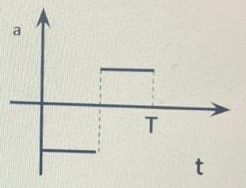
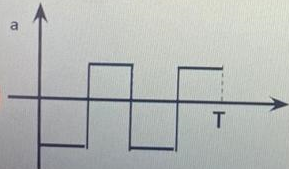
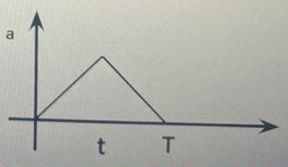
Step by step video & image solution for Choose the correct a vs t graph by Physics experts to help you in doubts & scoring excellent marks in Class 12 exams.
Updated on:21/07/2023Topper's Solved these Questions
- JEE MAIN 2021BOOK - JEE MAINS PREVIOUS YEARCHAPTER - JEE MAIN 2021EXERCISE - SECTION-A
80 Videos
- JEE MAIN 2021BOOK - JEE MAINS PREVIOUS YEARCHAPTER - JEE MAIN 2021EXERCISE - SECTION-B
40 Videos
- JEE MAINBOOK - JEE MAINS PREVIOUS YEARCHAPTER - JEE MAINEXERCISE - All Questions
473 Videos
- JEE MAIN 2022BOOK - JEE MAINS PREVIOUS YEARCHAPTER - JEE MAIN 2022EXERCISE - Question
492 Videos
Similar Questions
Knowledge Check
Observe the graph between light intensity and the rate of photosynthesis. Choose the correct graph w.r.t. A,B,C,D,E mentioned in the graph. a. (A) (I) Value of light intensity after which there is no increase in the rate of photosynthesis.
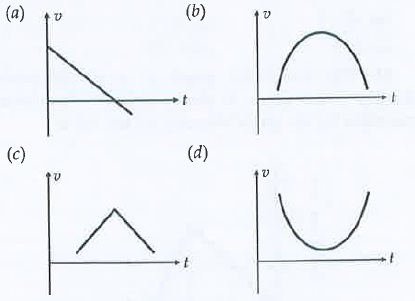
Aa(iii), b(iv), c(i), d(ii)Ba(iv), b(iii), c(i), d(ii)Ca(iii), b(iv), c(i), d(ii) (2) a(iv), b(iii), c(i), d(ii)Da(iv), b(iii), c(i), d(ii)A particle is thrown above, then correct v−t graph will be
A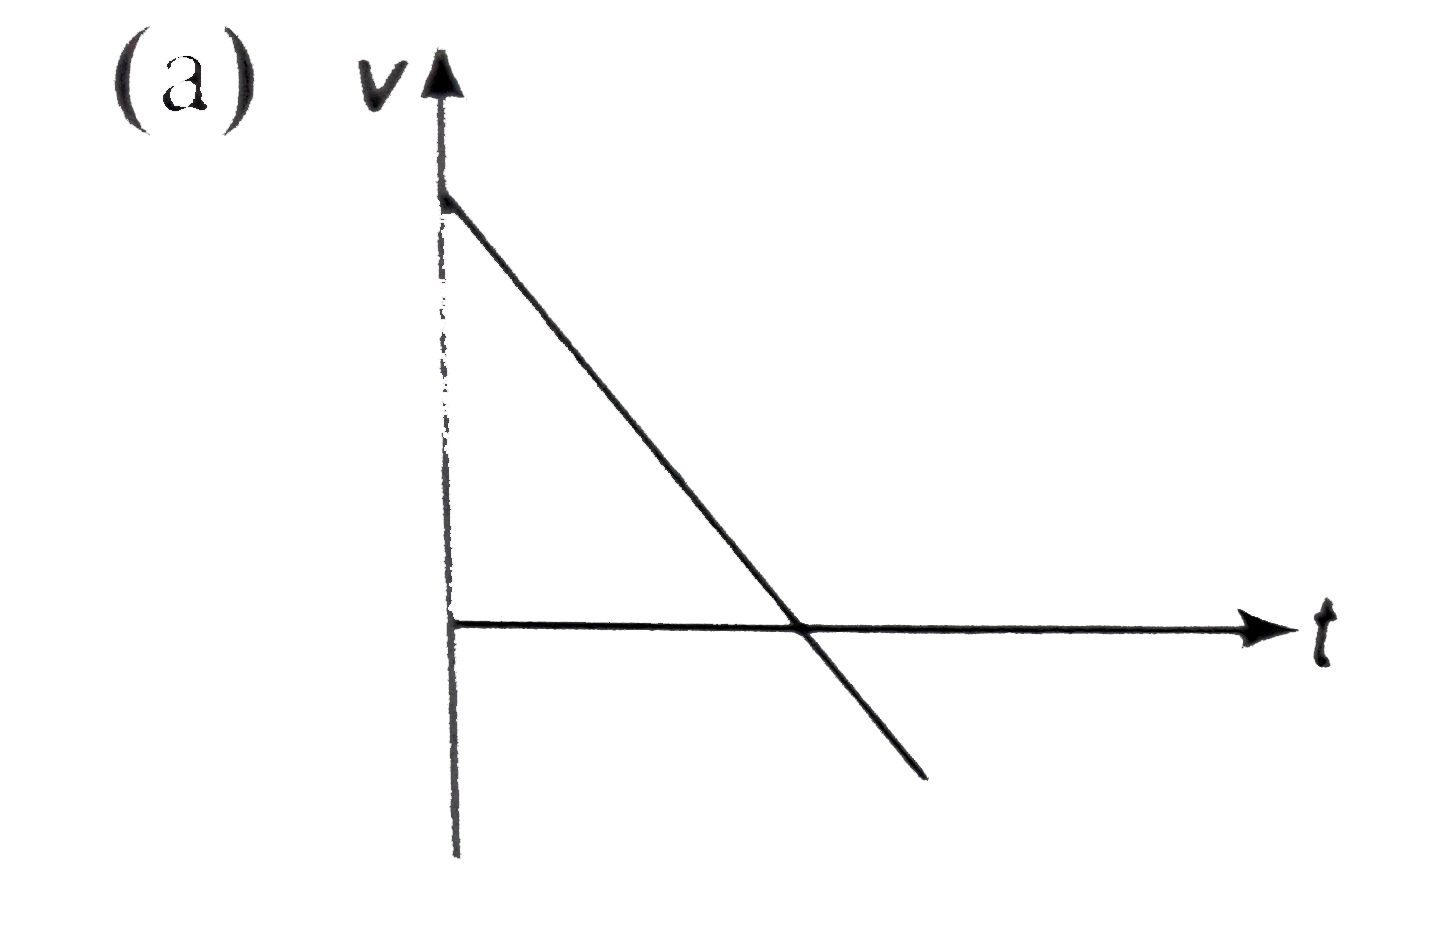 B
B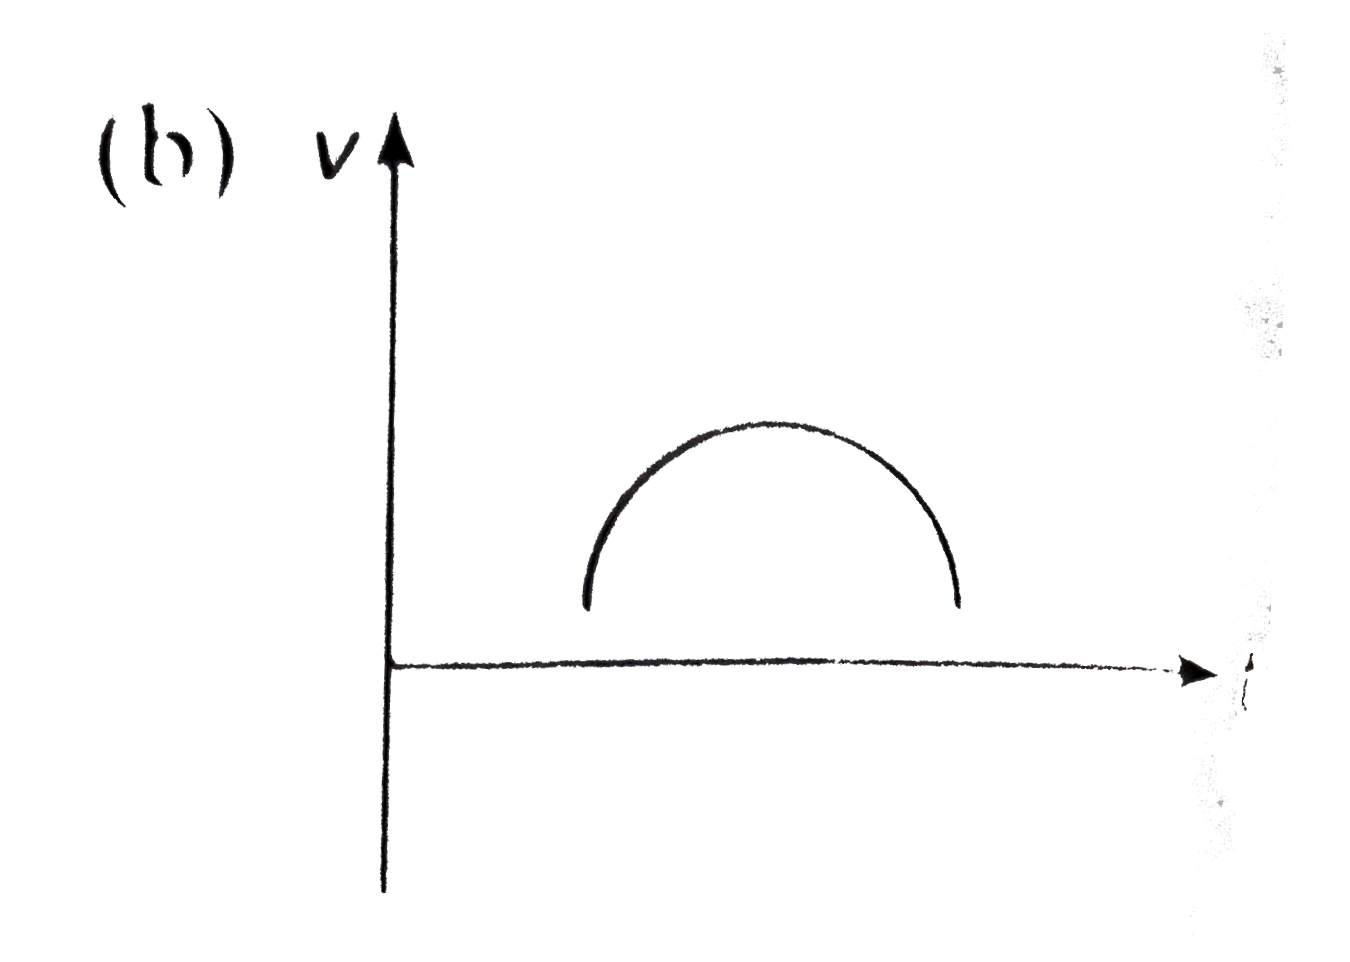 C
C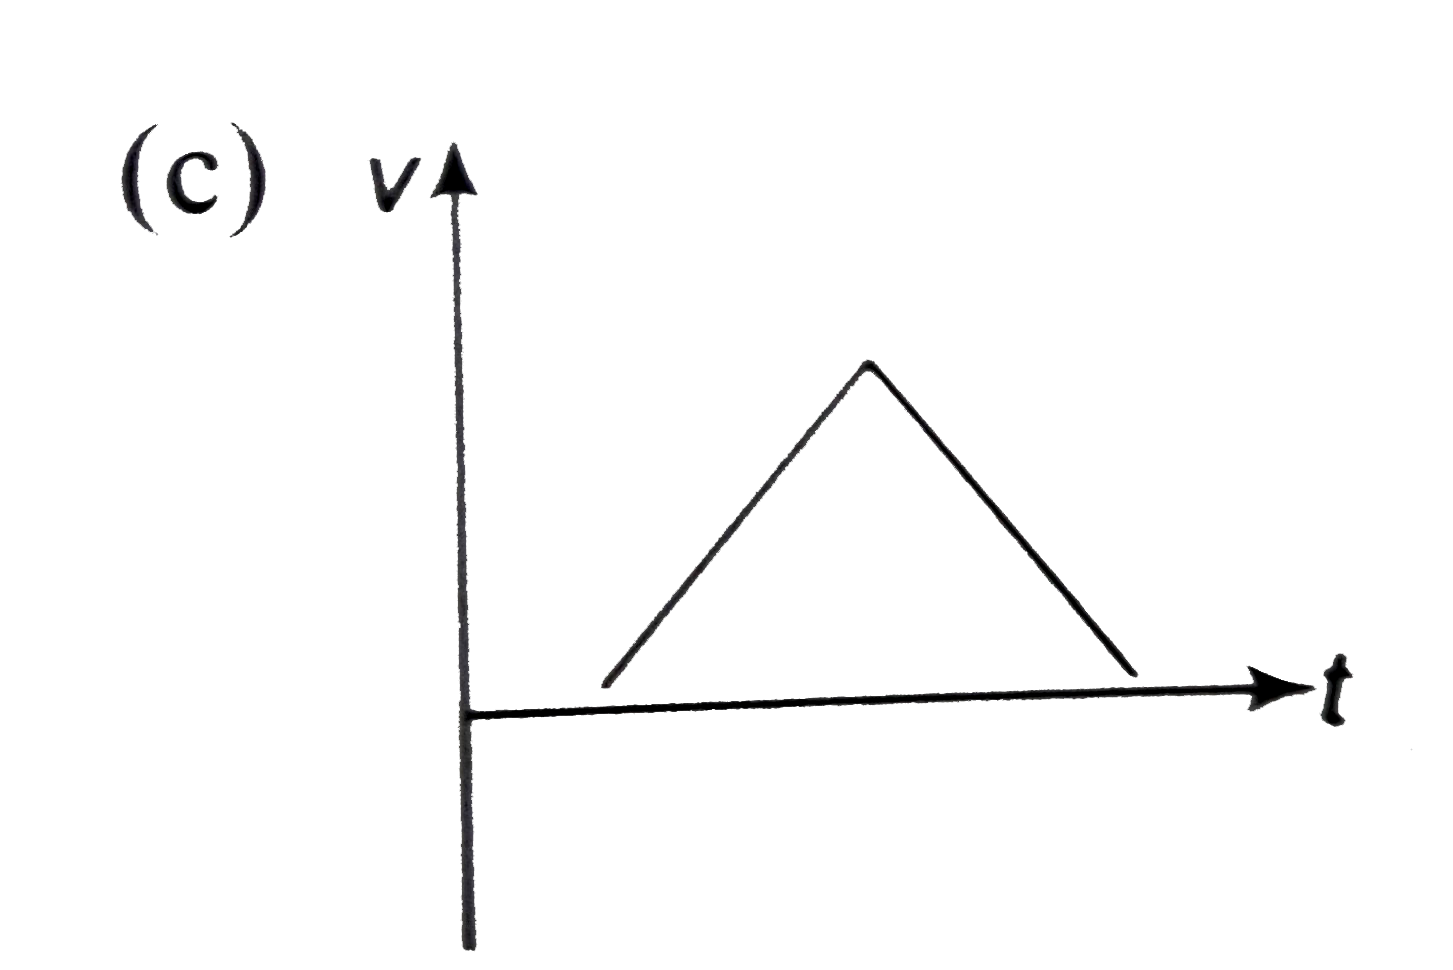 D
D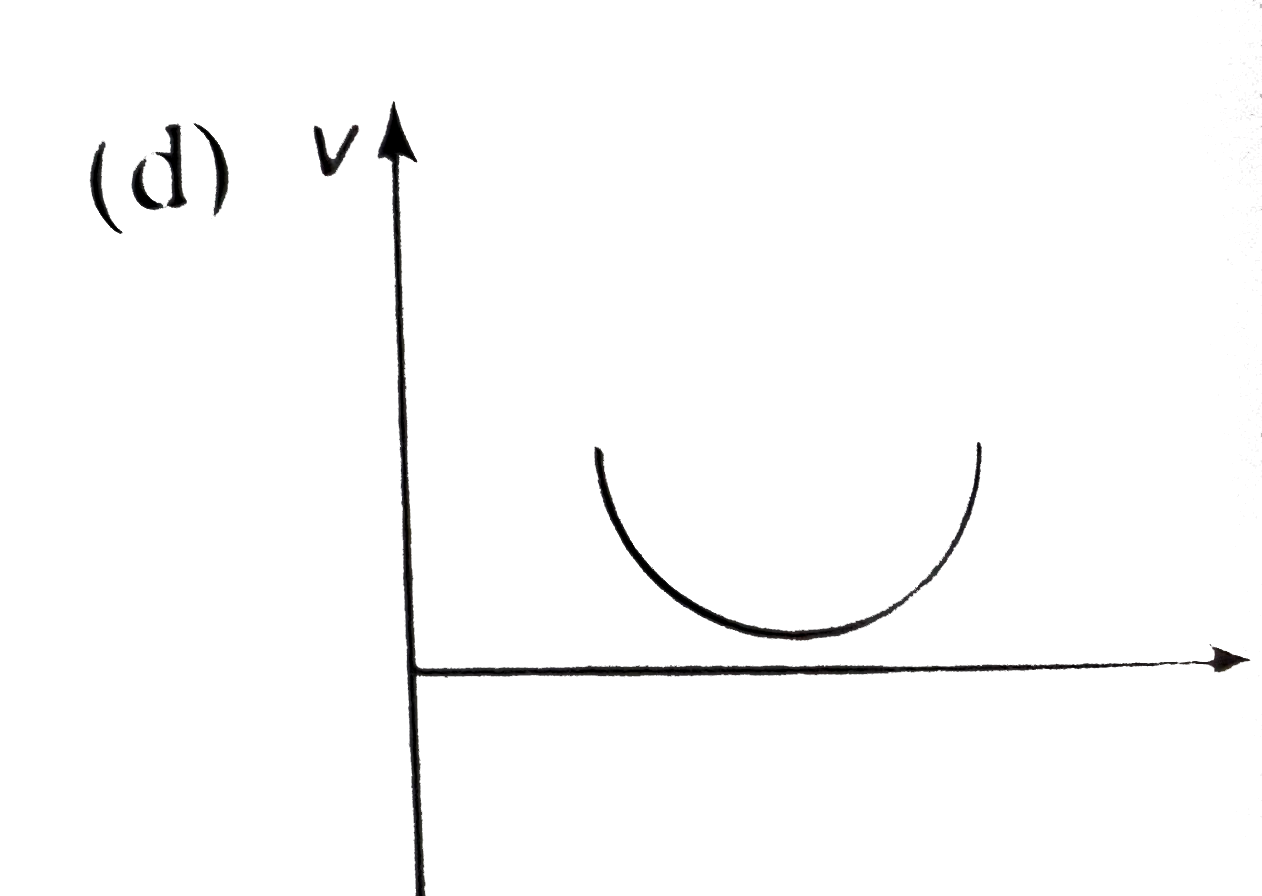
PV versus T graph of equal masses of H2, He and CO2 is shown in figure. Choose the correct alternative?
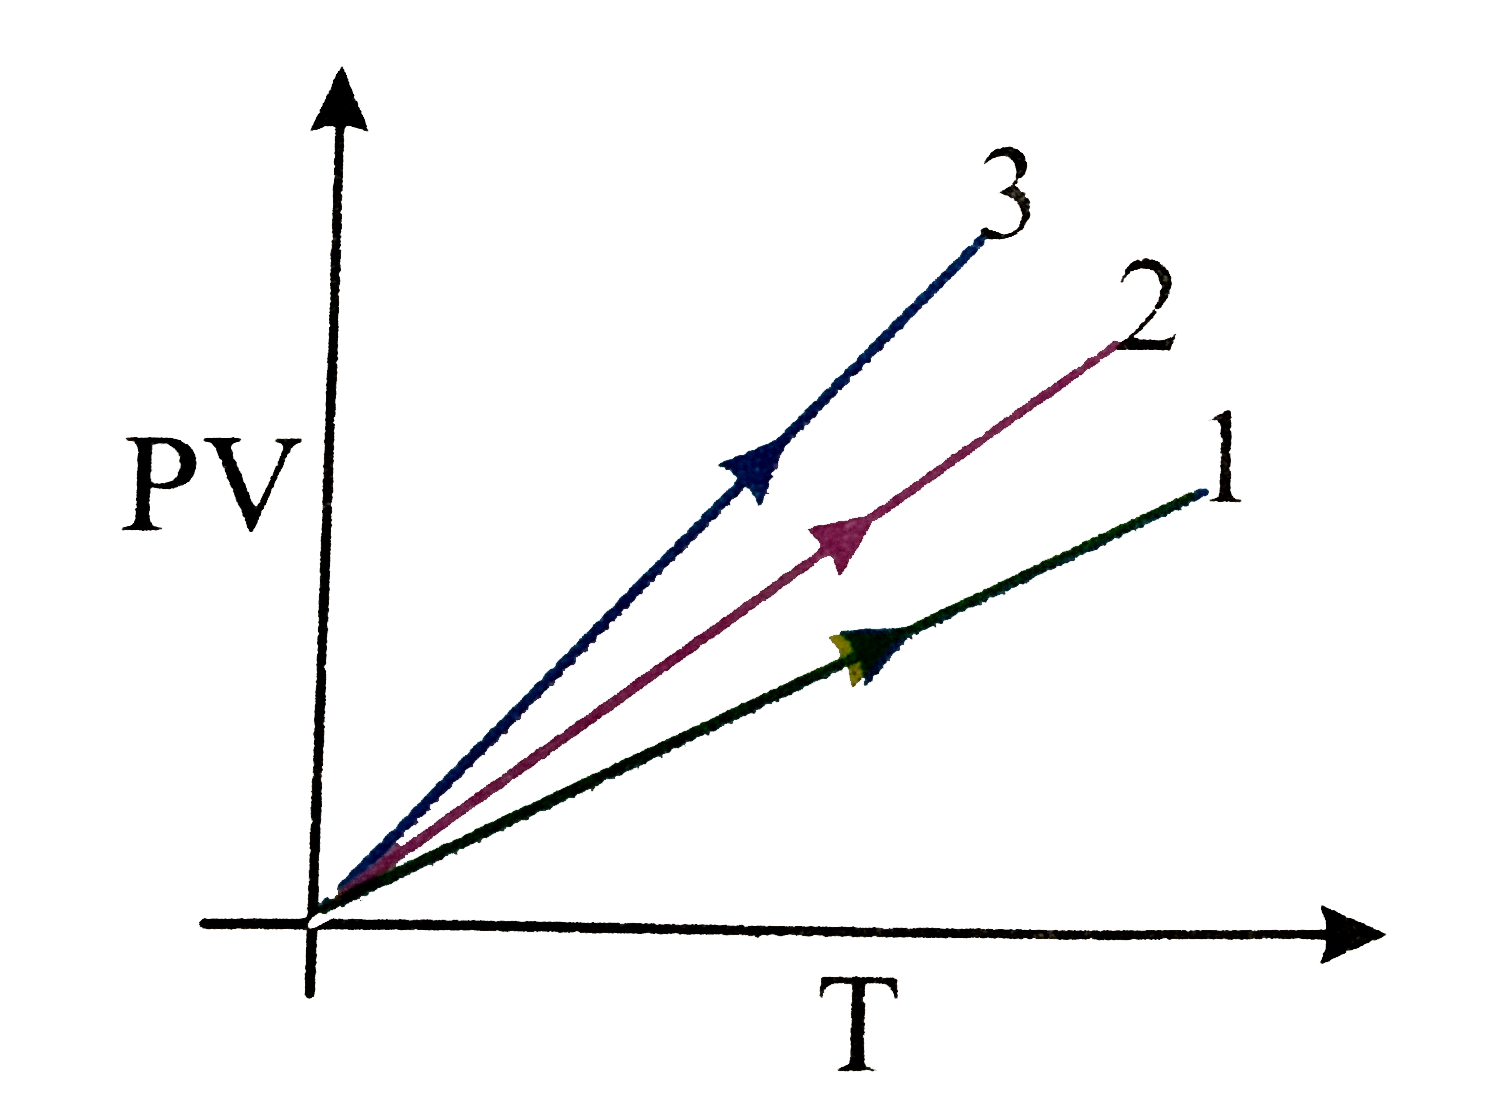 A3 corresponds to H2,2 to He and 1 to CO2B1 corresponds to He, 2 to H2 and 3 to CO2C1 corresponds to He, 3 to H2 and 2 to CO2D1 corresponds to CO2,2 to H2 and 3 to He
Choose the correct option for graphical representation of Boyle's Law, which shows a graph of pressure vs volume of gas at different temperatures:
View SolutionPV versus T graph of equal masses of H2, He and O2 is shown in Figure choose the correct alternative.

View SolutionThe shows a radiant energy spectrum graph for a black body at at temperature T
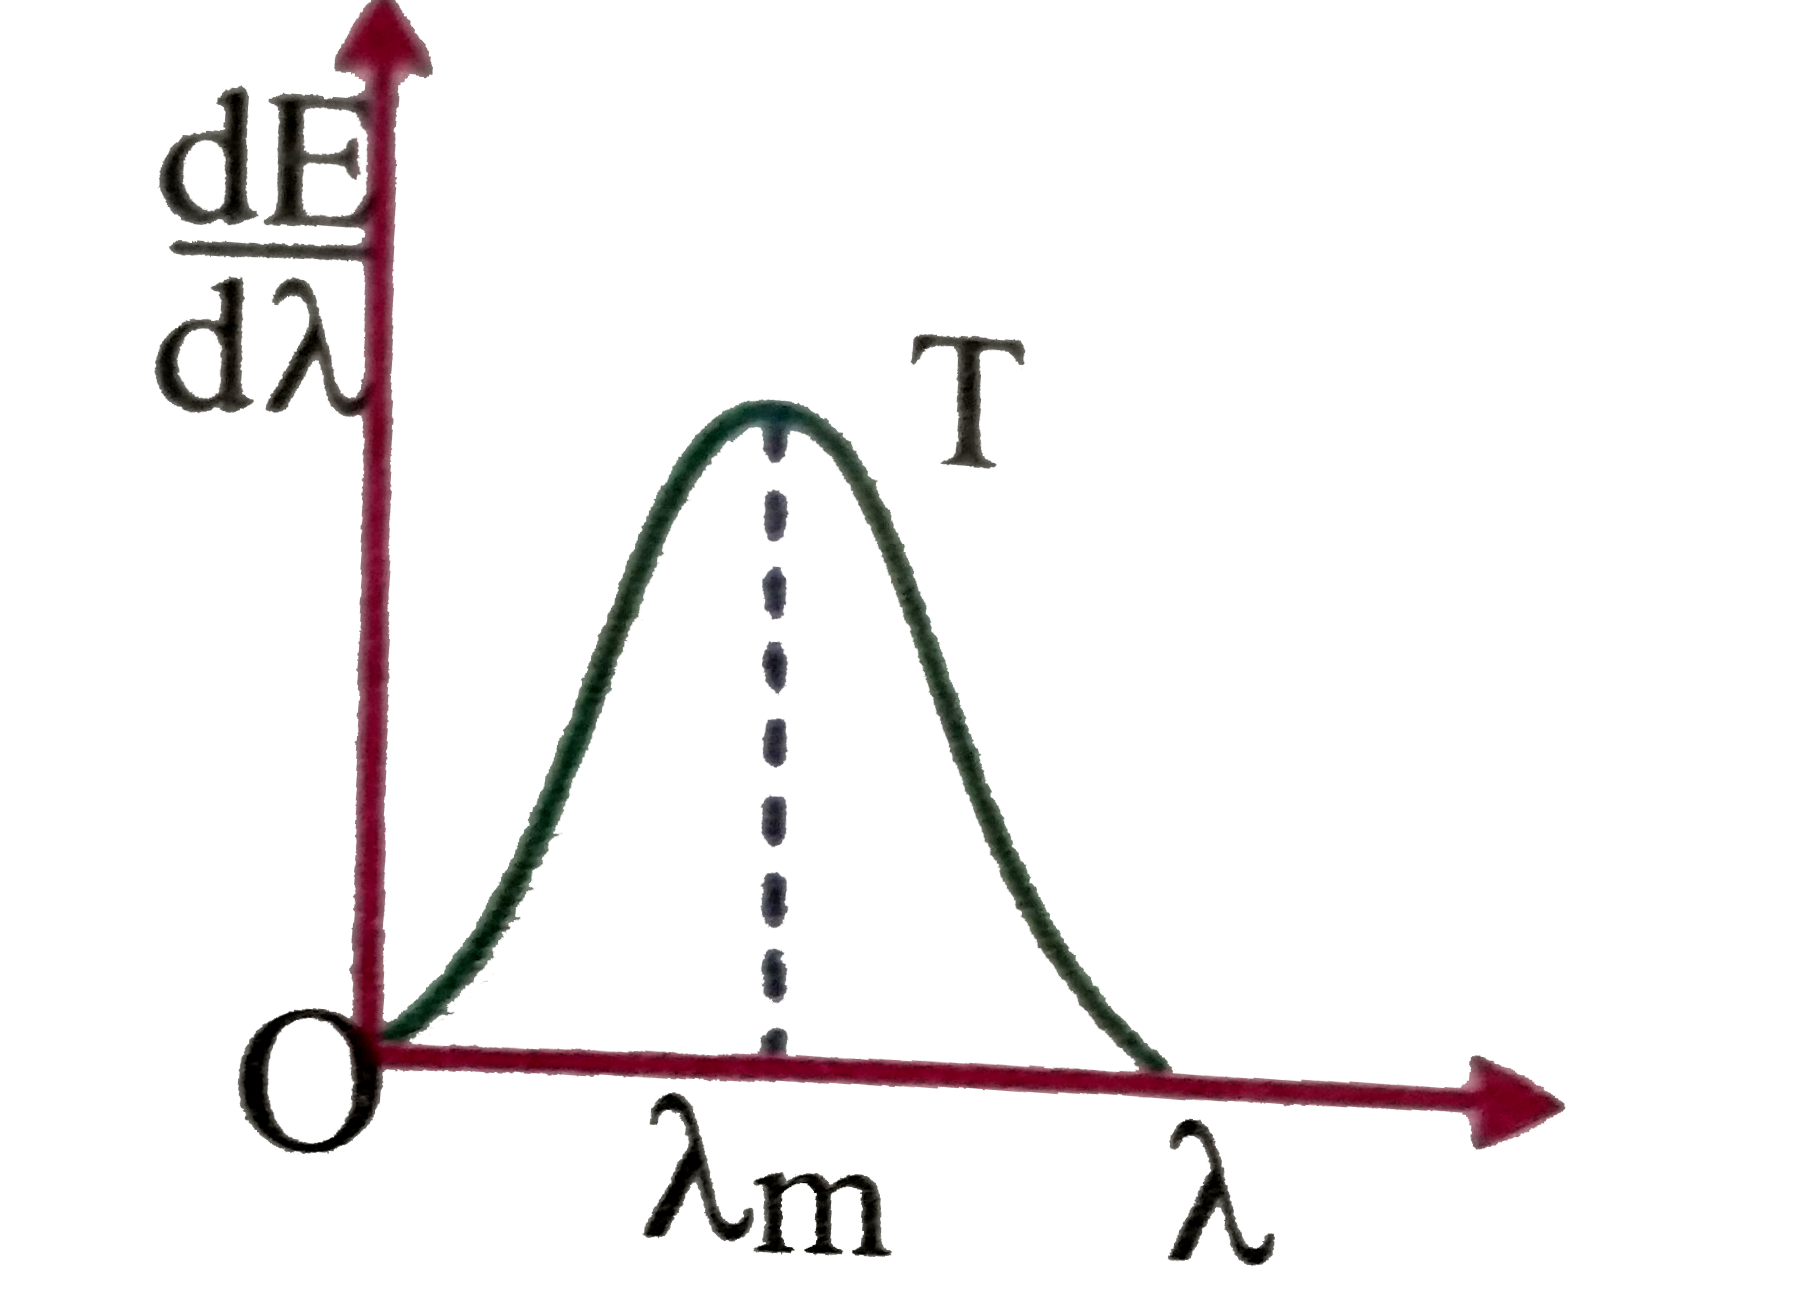
Choose the correct statements (s) .
View SolutionChoose the correct option for the graph between the frequency of incident light and the stopping potential.
View SolutionThe stress- strain graphs for materials A and B are as shown. Choose the correct alternative
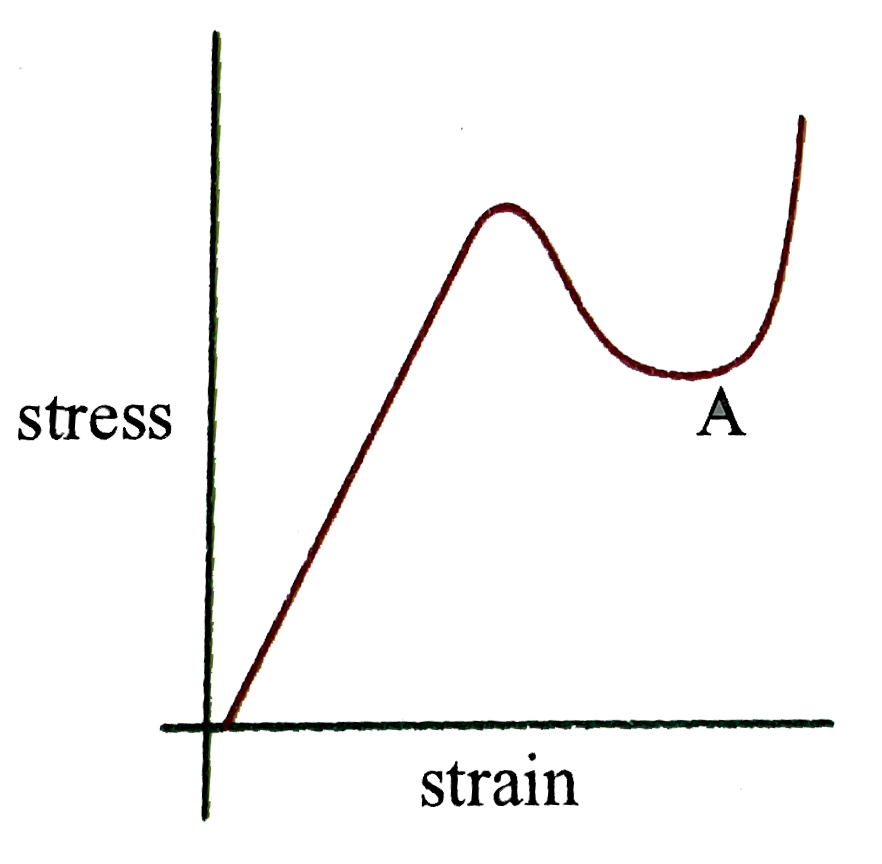
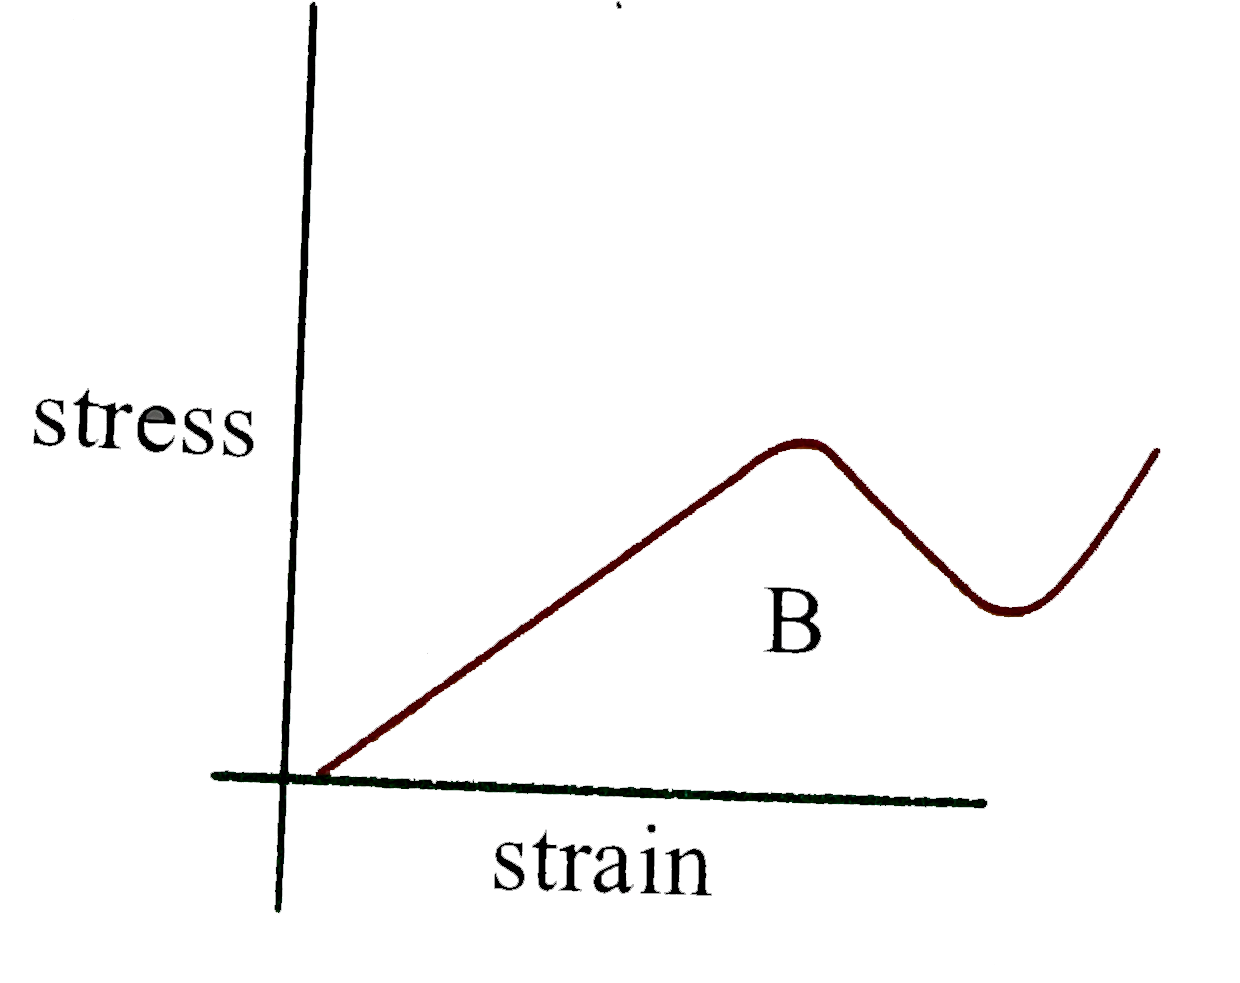
View Solution

