A slab of ice at 0∘C is constantly heated till the steam is formed at 100∘C. Draw a graph showing the change in temperature with time. Label the various parts of the graph properly.
Step by step video & image solution for A slab of ice at 0^@C is constantly heated till the steam is formed at 100^@C. Draw a graph showing the change in temperature with time. Label the various parts of the graph properly. by Physics experts to help you in doubts & scoring excellent marks in Class 10 exams.
Updated on:21/07/2023Topper's Solved these Questions
Similar Questions
A certain mass of ice at 0∘C is converted to steam at 100∘C by constant heating, Draw temperature-time graph showing the change in phases.
View SolutionA certain mass of ice at 0∘C is converted to steam at 100∘C by constant heating, Draw temperature-time graph showing the change in phases.
View Solution
Knowledge Check
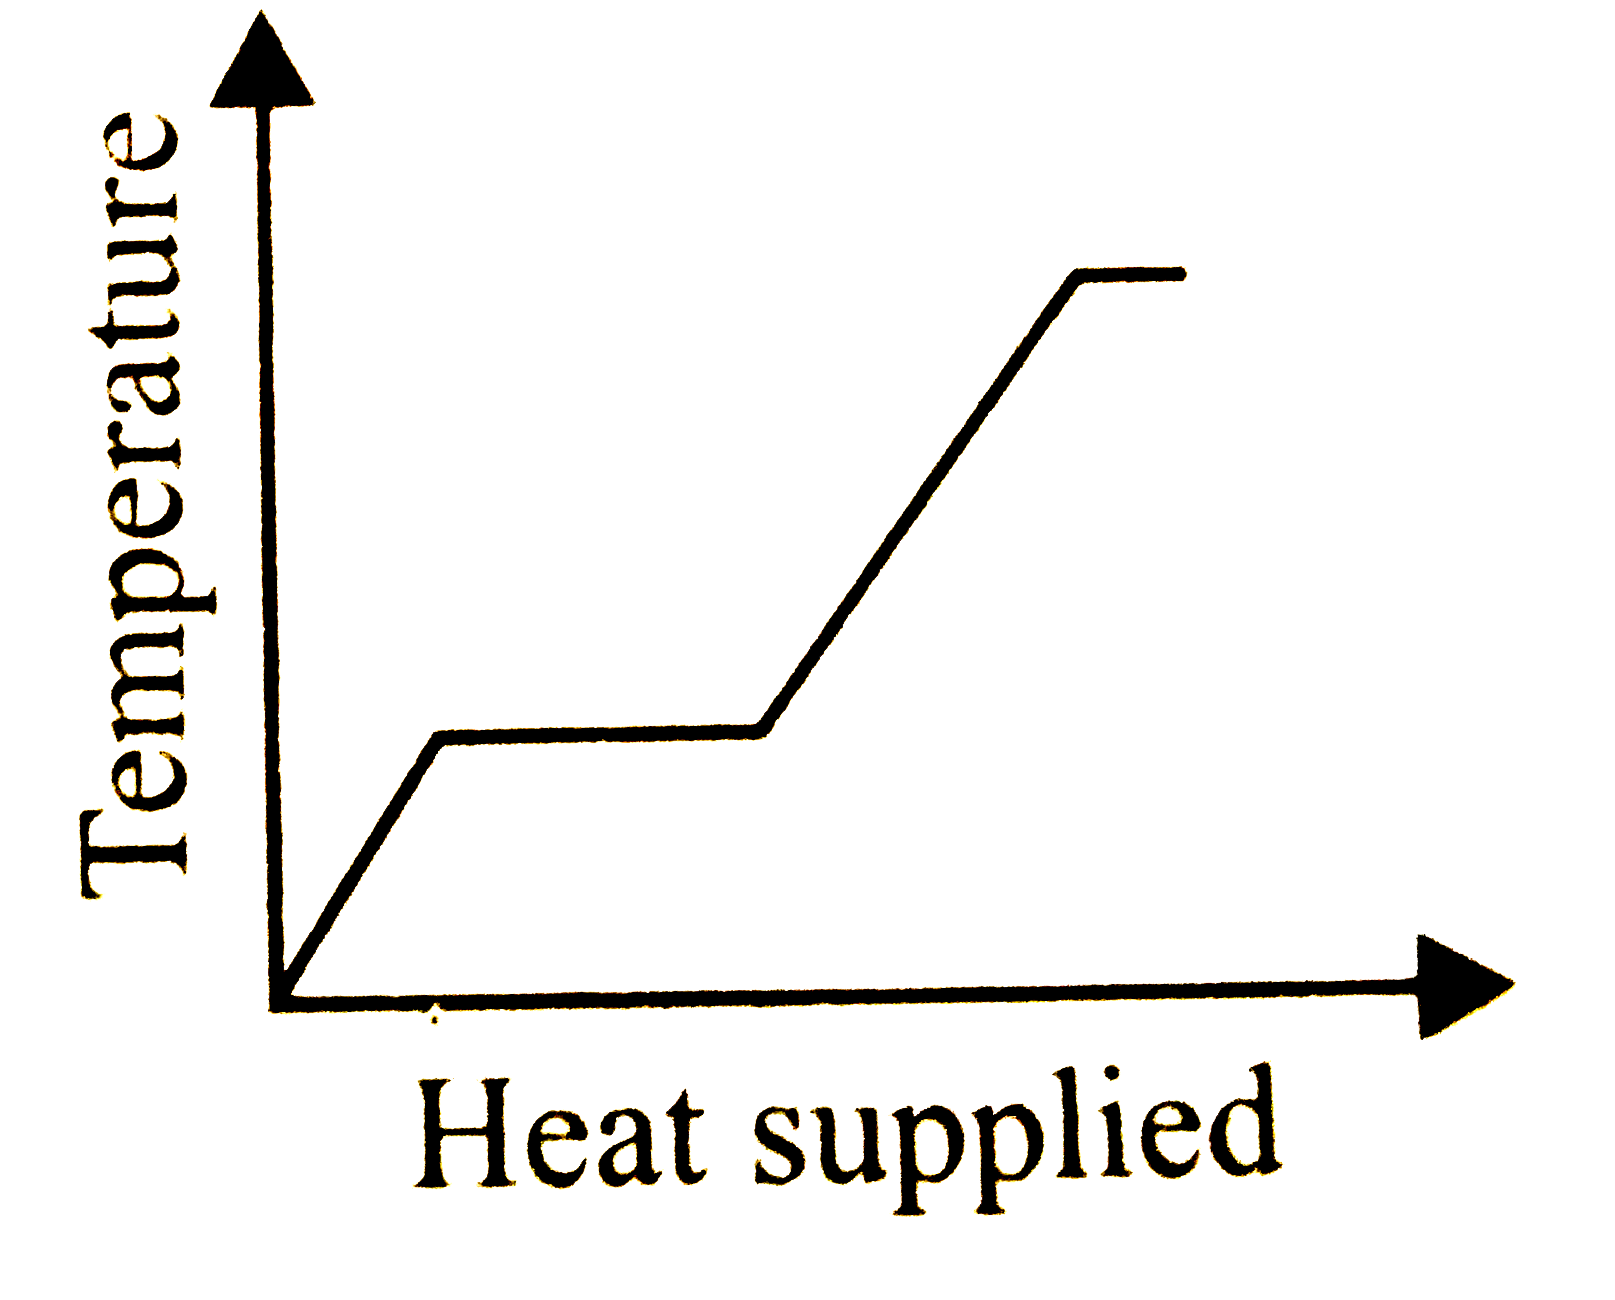
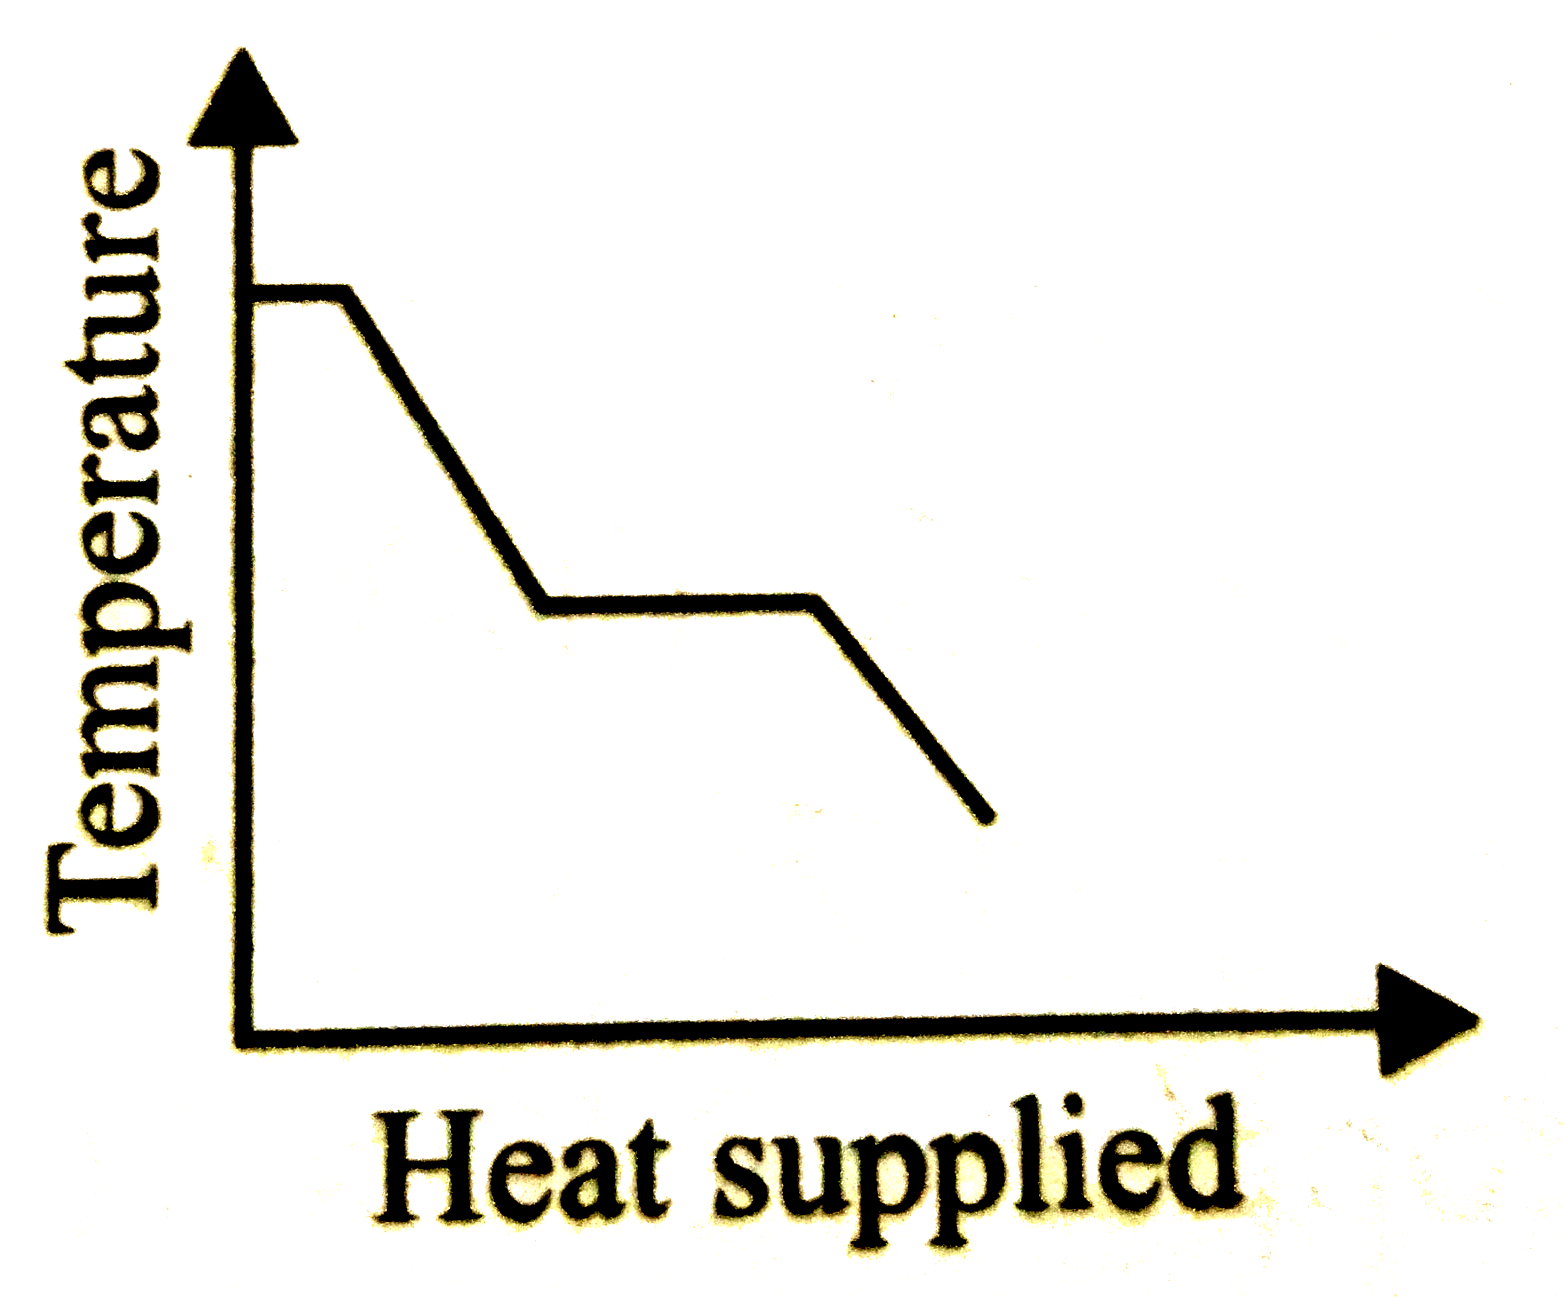
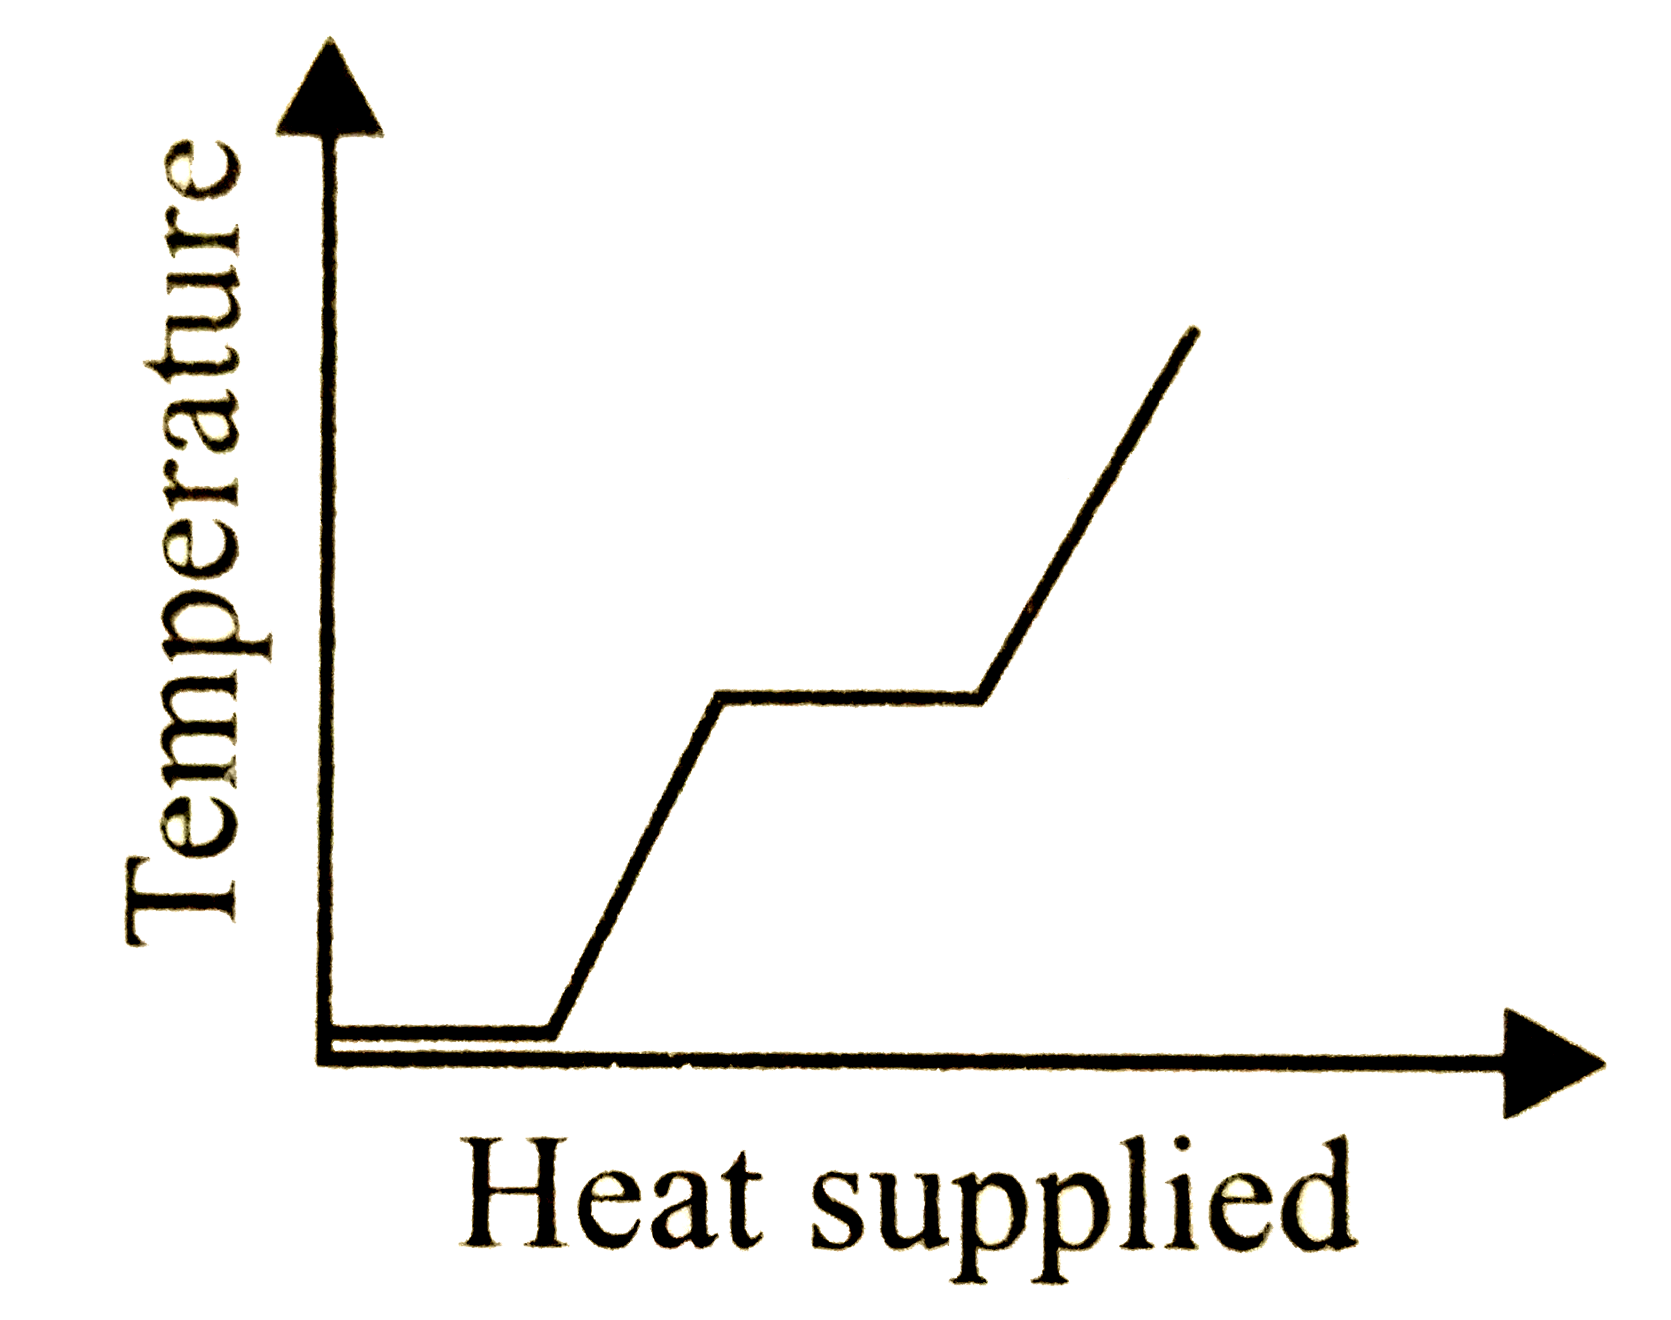
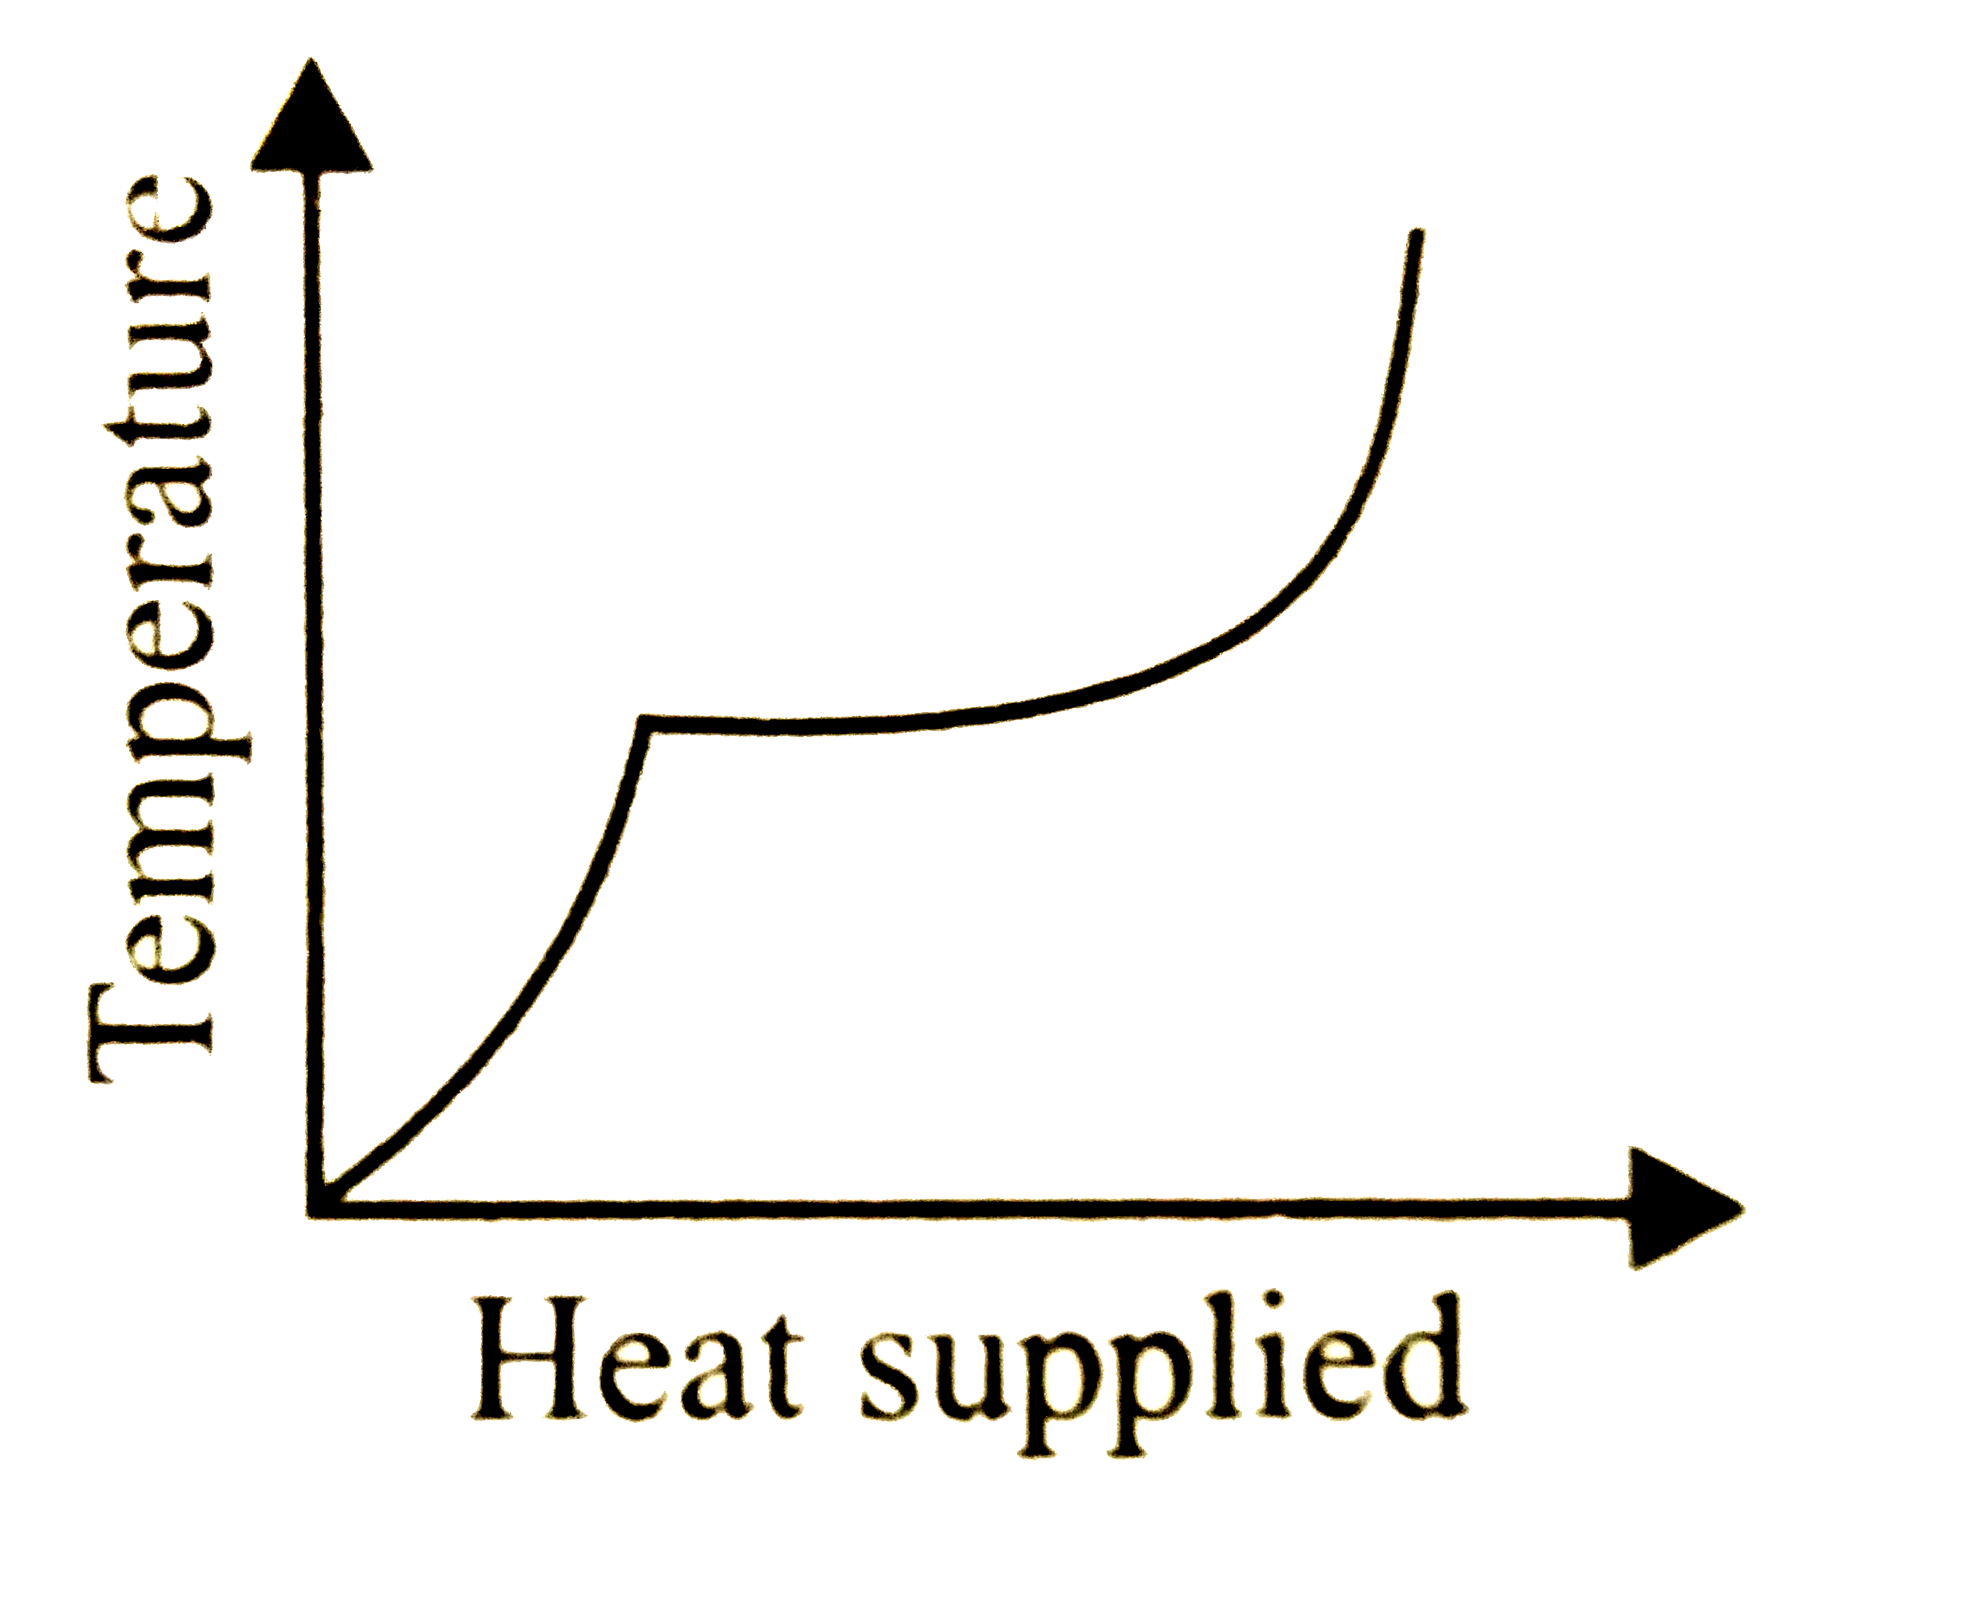
A block of ice at −10∘C is slowly heated and converted to steam at 100∘C. Which of the following curves represents the phenomenon qualitatively?
A B
B C
C D
D
A piece of ice at 0∘C is heated at a constant rate and its temperature recorded at regular intervals till steam is formed at 100∘C. Draw a temperature-time graph to represent the change in phase. Label the different parts of your graph.
View Solution1 kg of ice at 0∘C is heated at a constant rate and its temperature is recorded after every 30 s till steam is formed at 100∘C. Draw a temperature-time graph to represent the change of phases.
View Solution1 g of ice at 0∘C is mixed with 1 g of steam at 100∘C. After thermal equilibrium is achieved, the temperature of the mixture is
View SolutionA block of ice at −12∘C is slowly heated and converted into steam at 100∘C. Which of the following curves best represents the event ?
View Solution5g ice at 0∘C is mixed with 5g of steam at 100∘C. What is the final temperature?
View Solution100 g ice at 0∘C is mixed with 10 g steam at 100∘C . Find the final temperature.
View SolutionAluminium container of mass of 10 g contains 200 g of ice at−20∘C. Heat is added to the system at the rate of 100 calories per second. What is the temperature of the system after four minutes? Draw a rough sketch showing the variation of the temperature of the system as a function of time . Given:
Specific heat of ice = 0.5calg−1(.∘C)−1
Specific heat of aluminium = 0.2calg−1(.∘C)−1
Latent heat of fusion of ice = 80calg−1
View Solution