A block of ice at −12∘C is slowly heated and converted into steam at 100∘C. Which of the following curves best represents the event ?
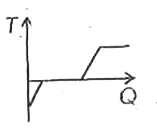
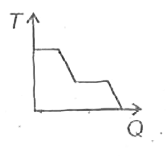
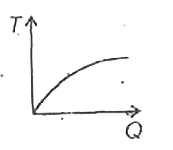
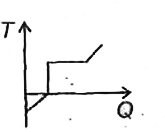
Step by step video & image solution for A block of ice at -12^(@)C is slowly heated and converted into steam at 100^(@)C. Which of the following curves best represents the event ? by Physics experts to help you in doubts & scoring excellent marks in Class 12 exams.
Updated on:21/07/2023Similar Questions
Which of the following P-V curve best represents. As isothermal process?
View Solution1 g of water at 100∘C is completely converted into steam at 100∘C. 1g of steam occupies a volume of 1650cc. (Neglect the volume of 1g of water at 100∘C). At the pressure of 105N/m2, latent heat of steam is 540 cal/g (1 Calorie=4.2 joules). The increase in the internal energy in joules is
View Solution
Knowledge Check
A block of ice at −10∘C is slowly heated and converted to steam at 100∘C. Which of the following curves represents the phenomenon qualitatively?
A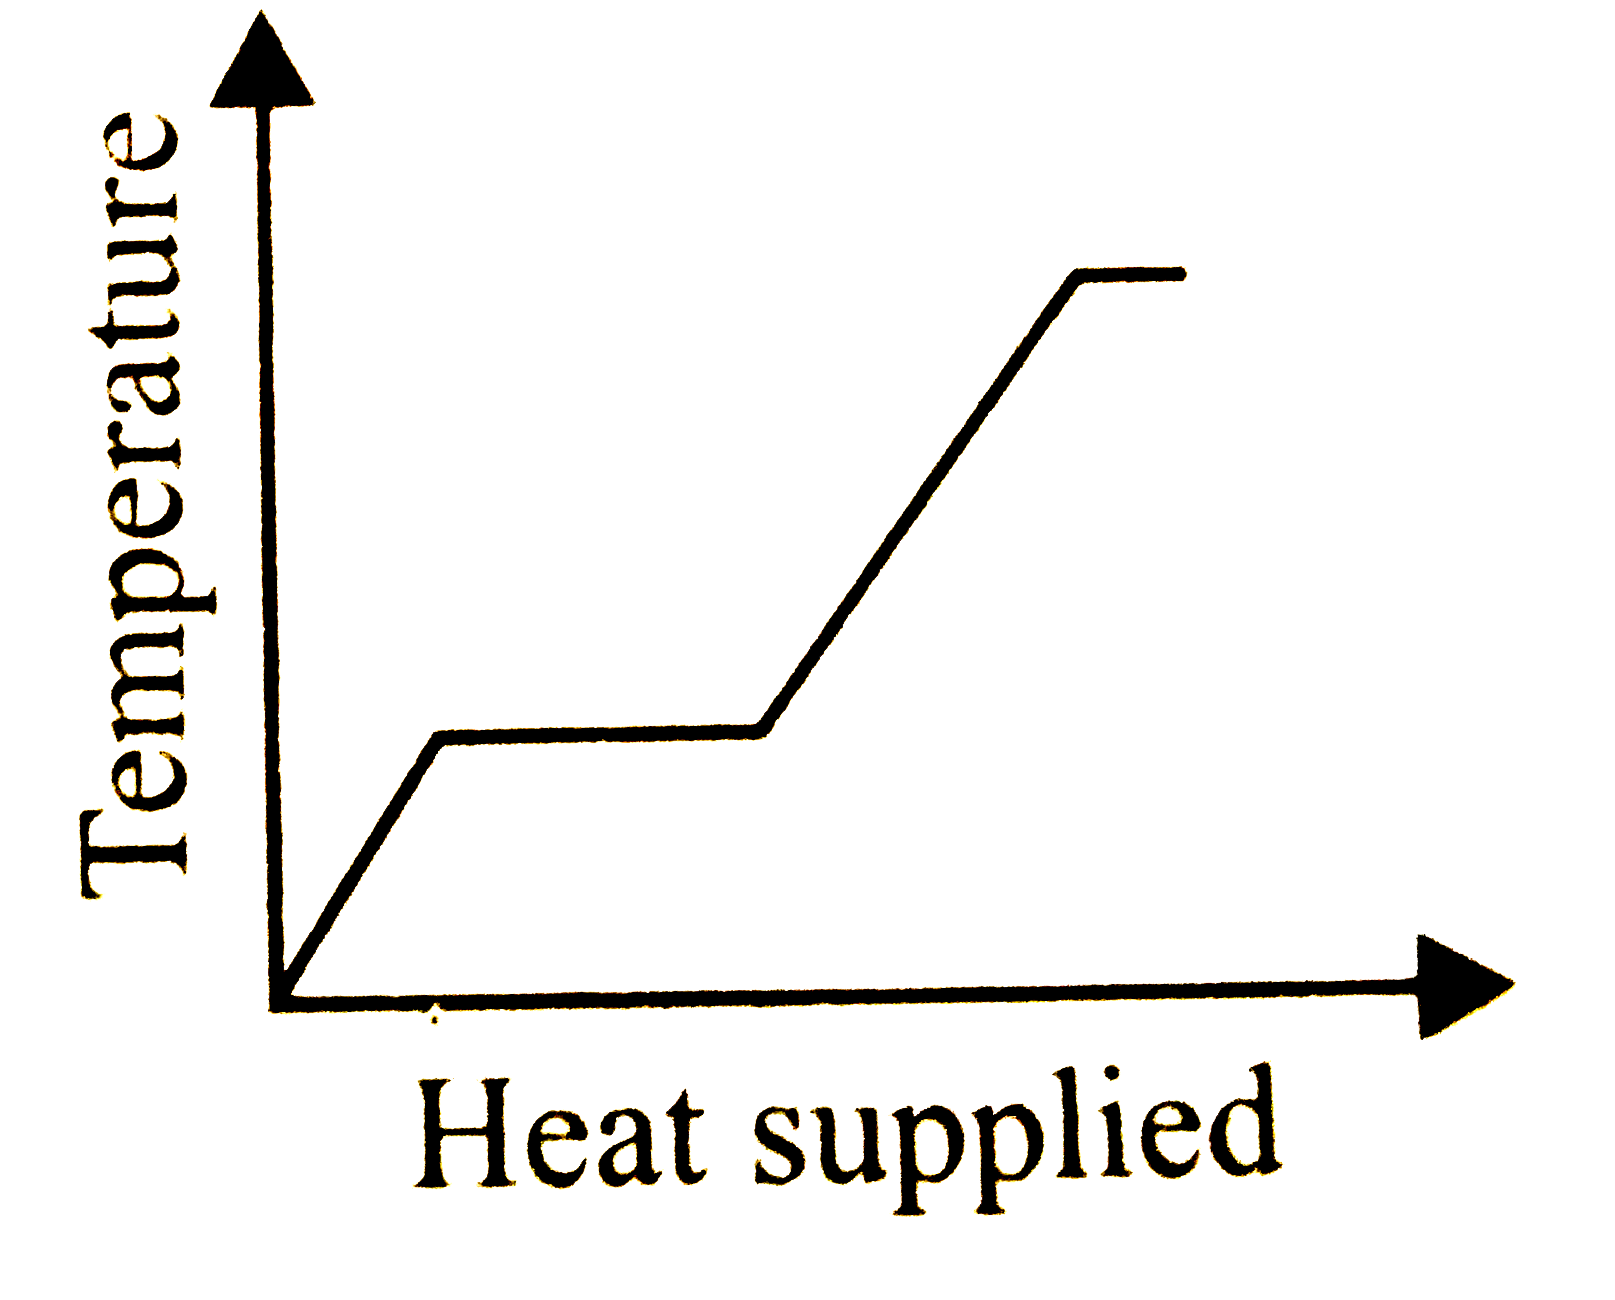 B
B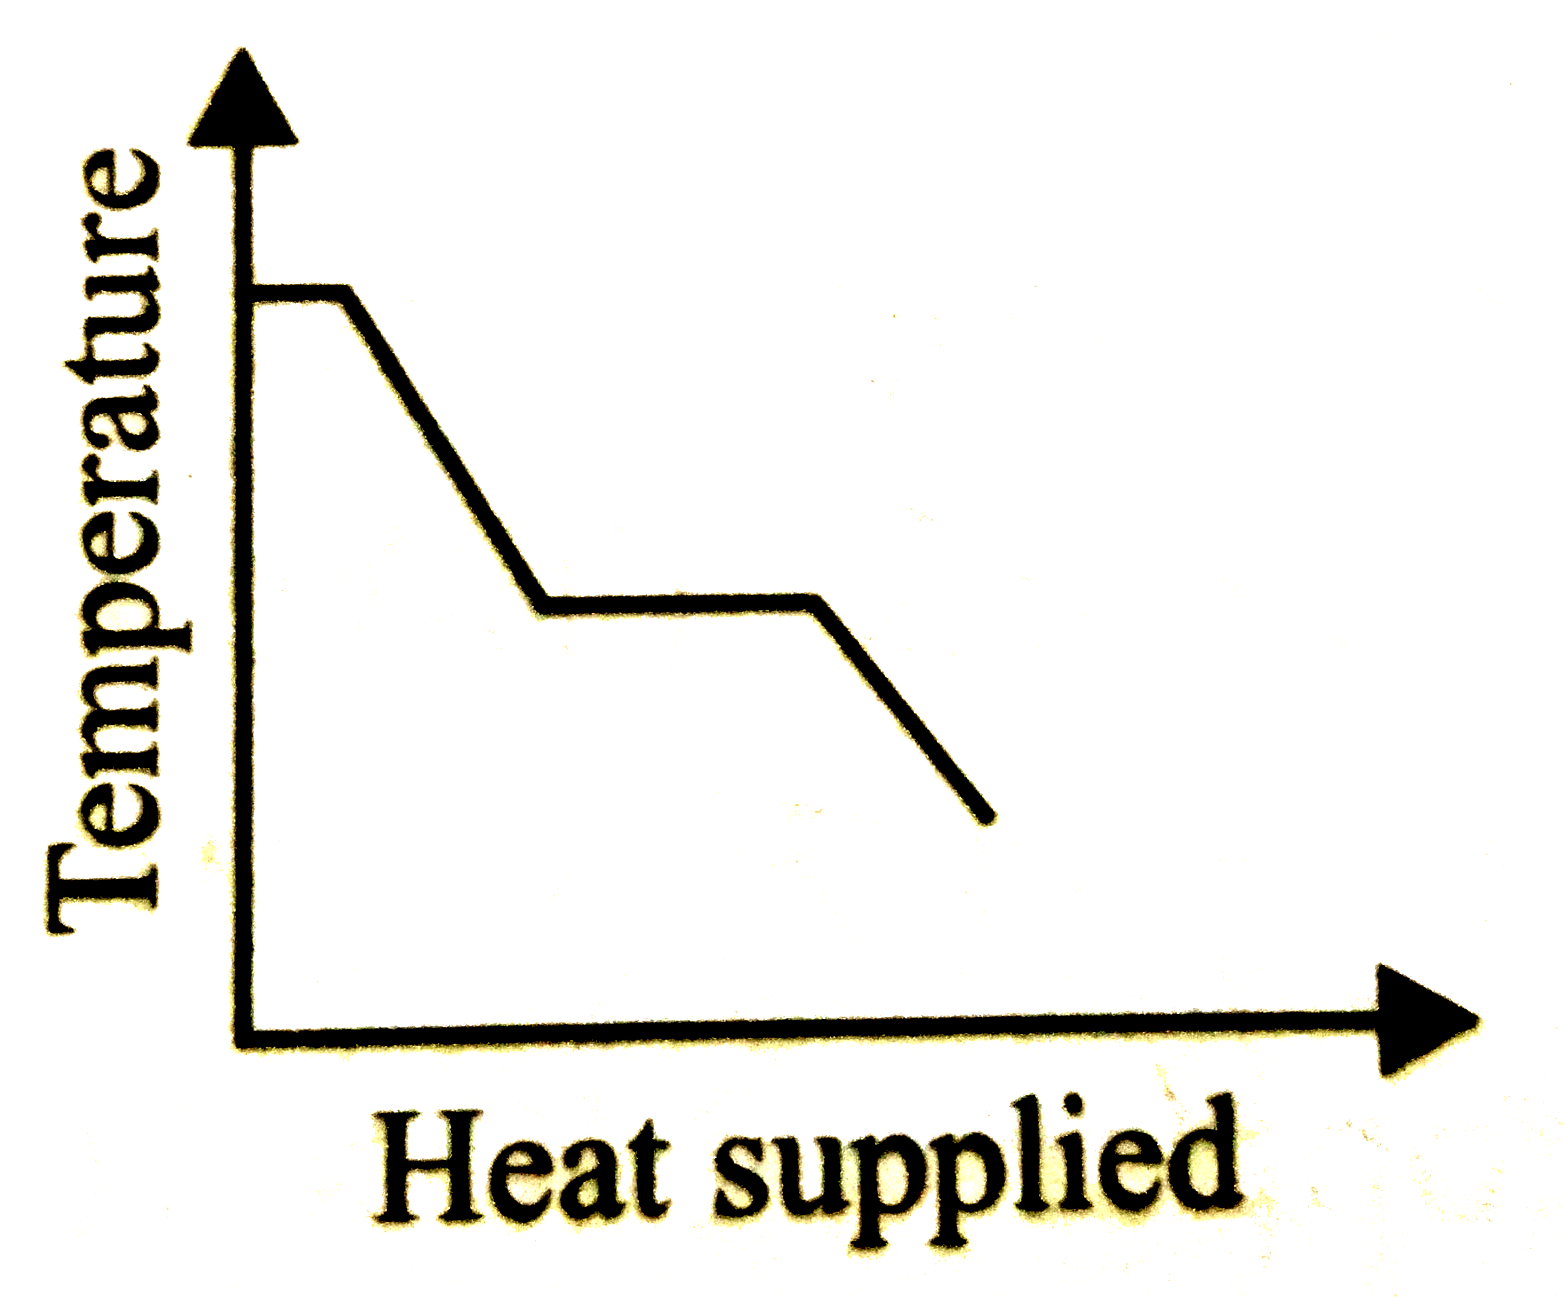 C
C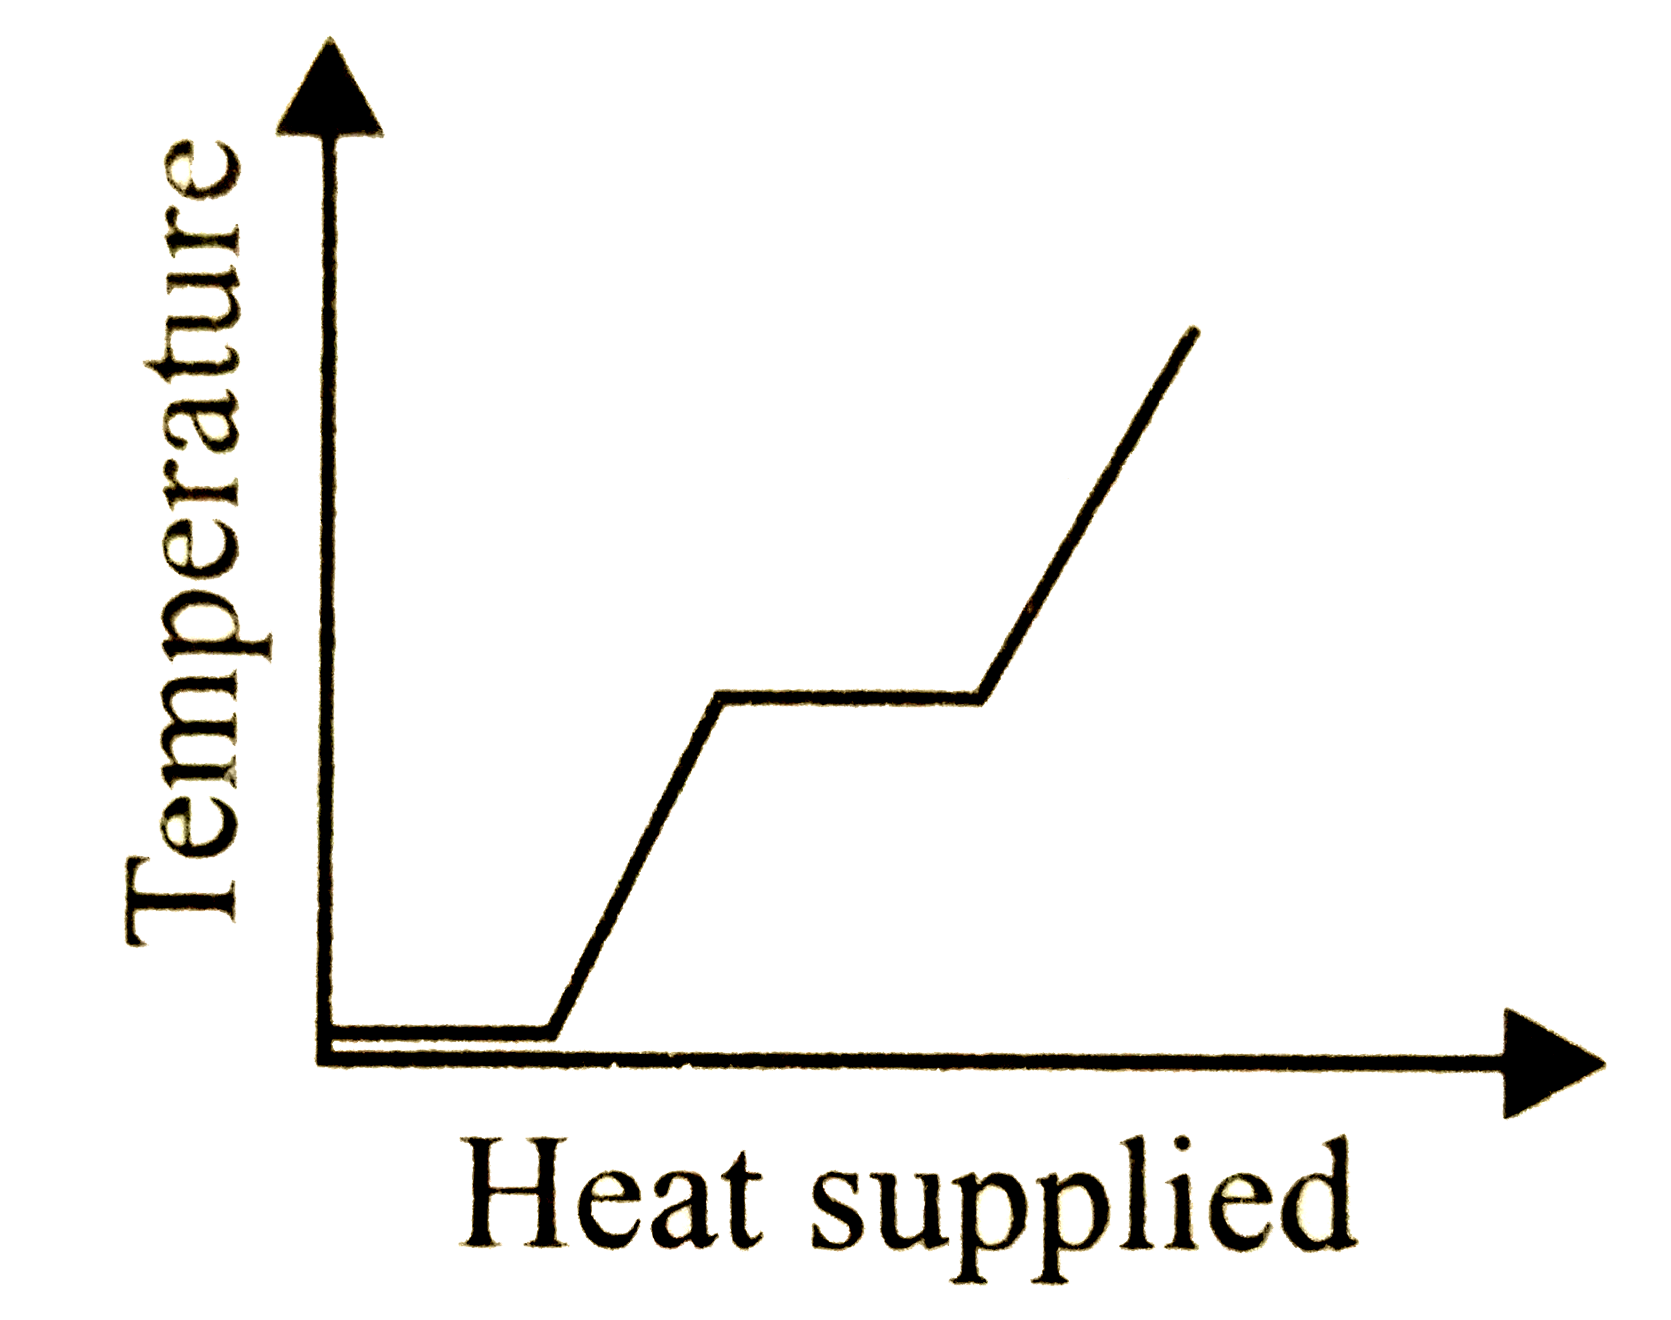 D
D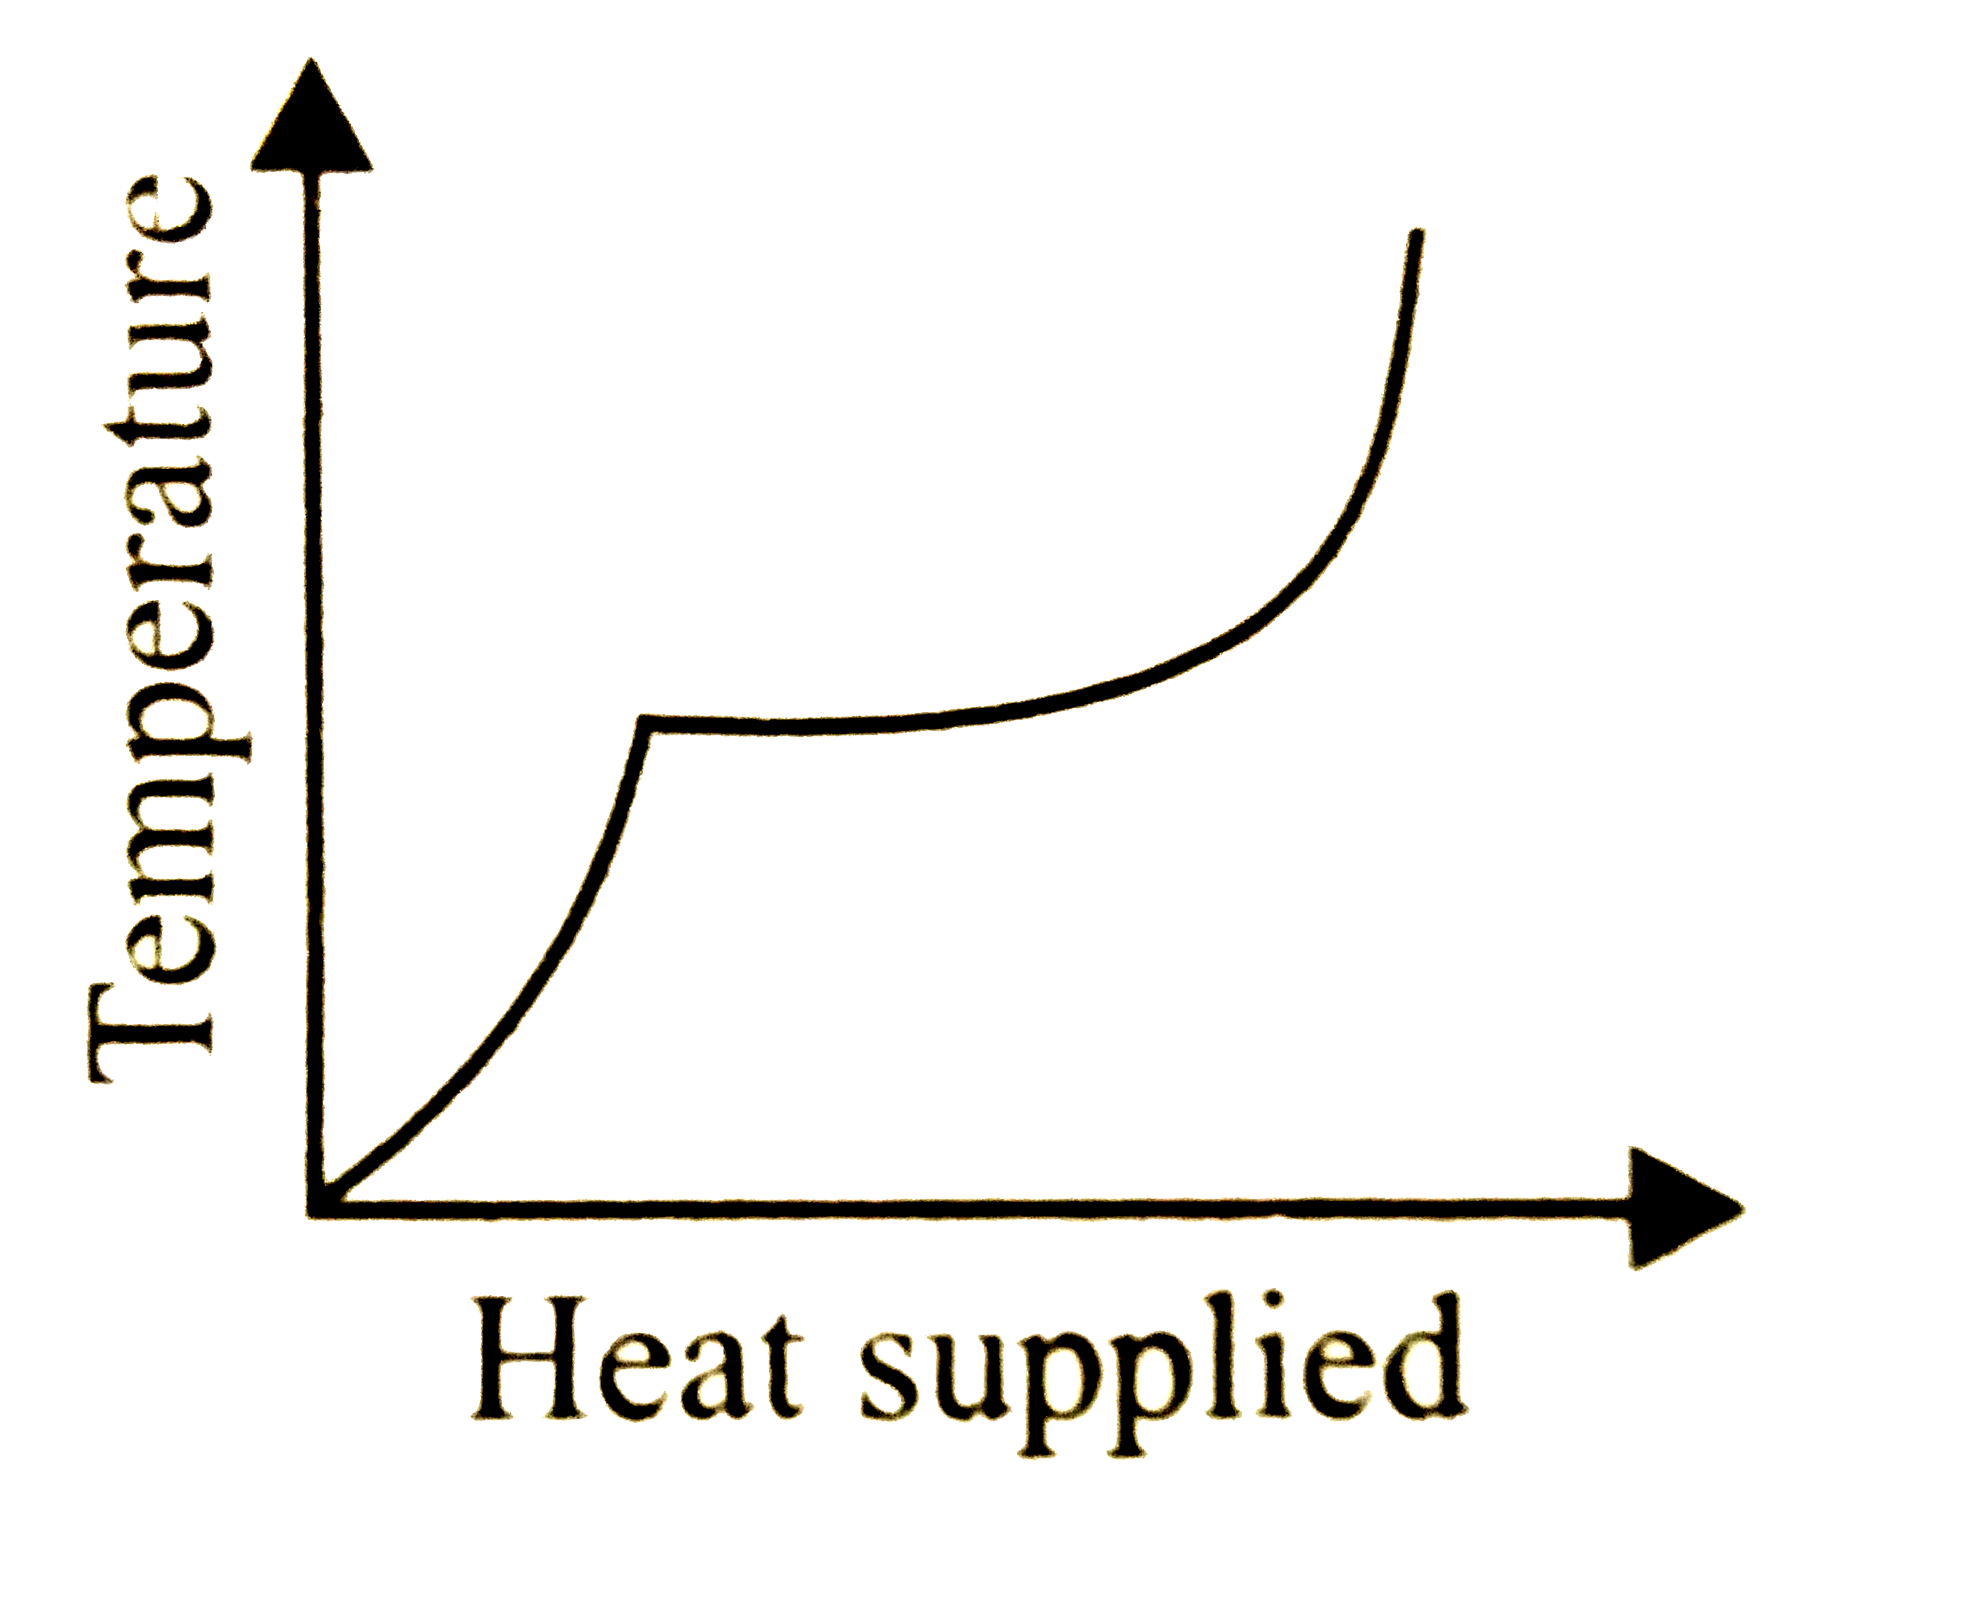
A block of ice, initially at −20∘C, is heated a steady rate until the temperature of the sample reaches 120∘C. Which of the following graphs best illustrates the temperature of the sample as a function of time?
A B
B C
C D
D
5g ice at 0∘C is mixed with 5g of steam at 100∘C. What is the final temperature?
View SolutionThe given curve represents the variation of temperature as a function of volume for one mole of an ideal gas. Which of the following curves best represents the variation of pressure as a function of volume?
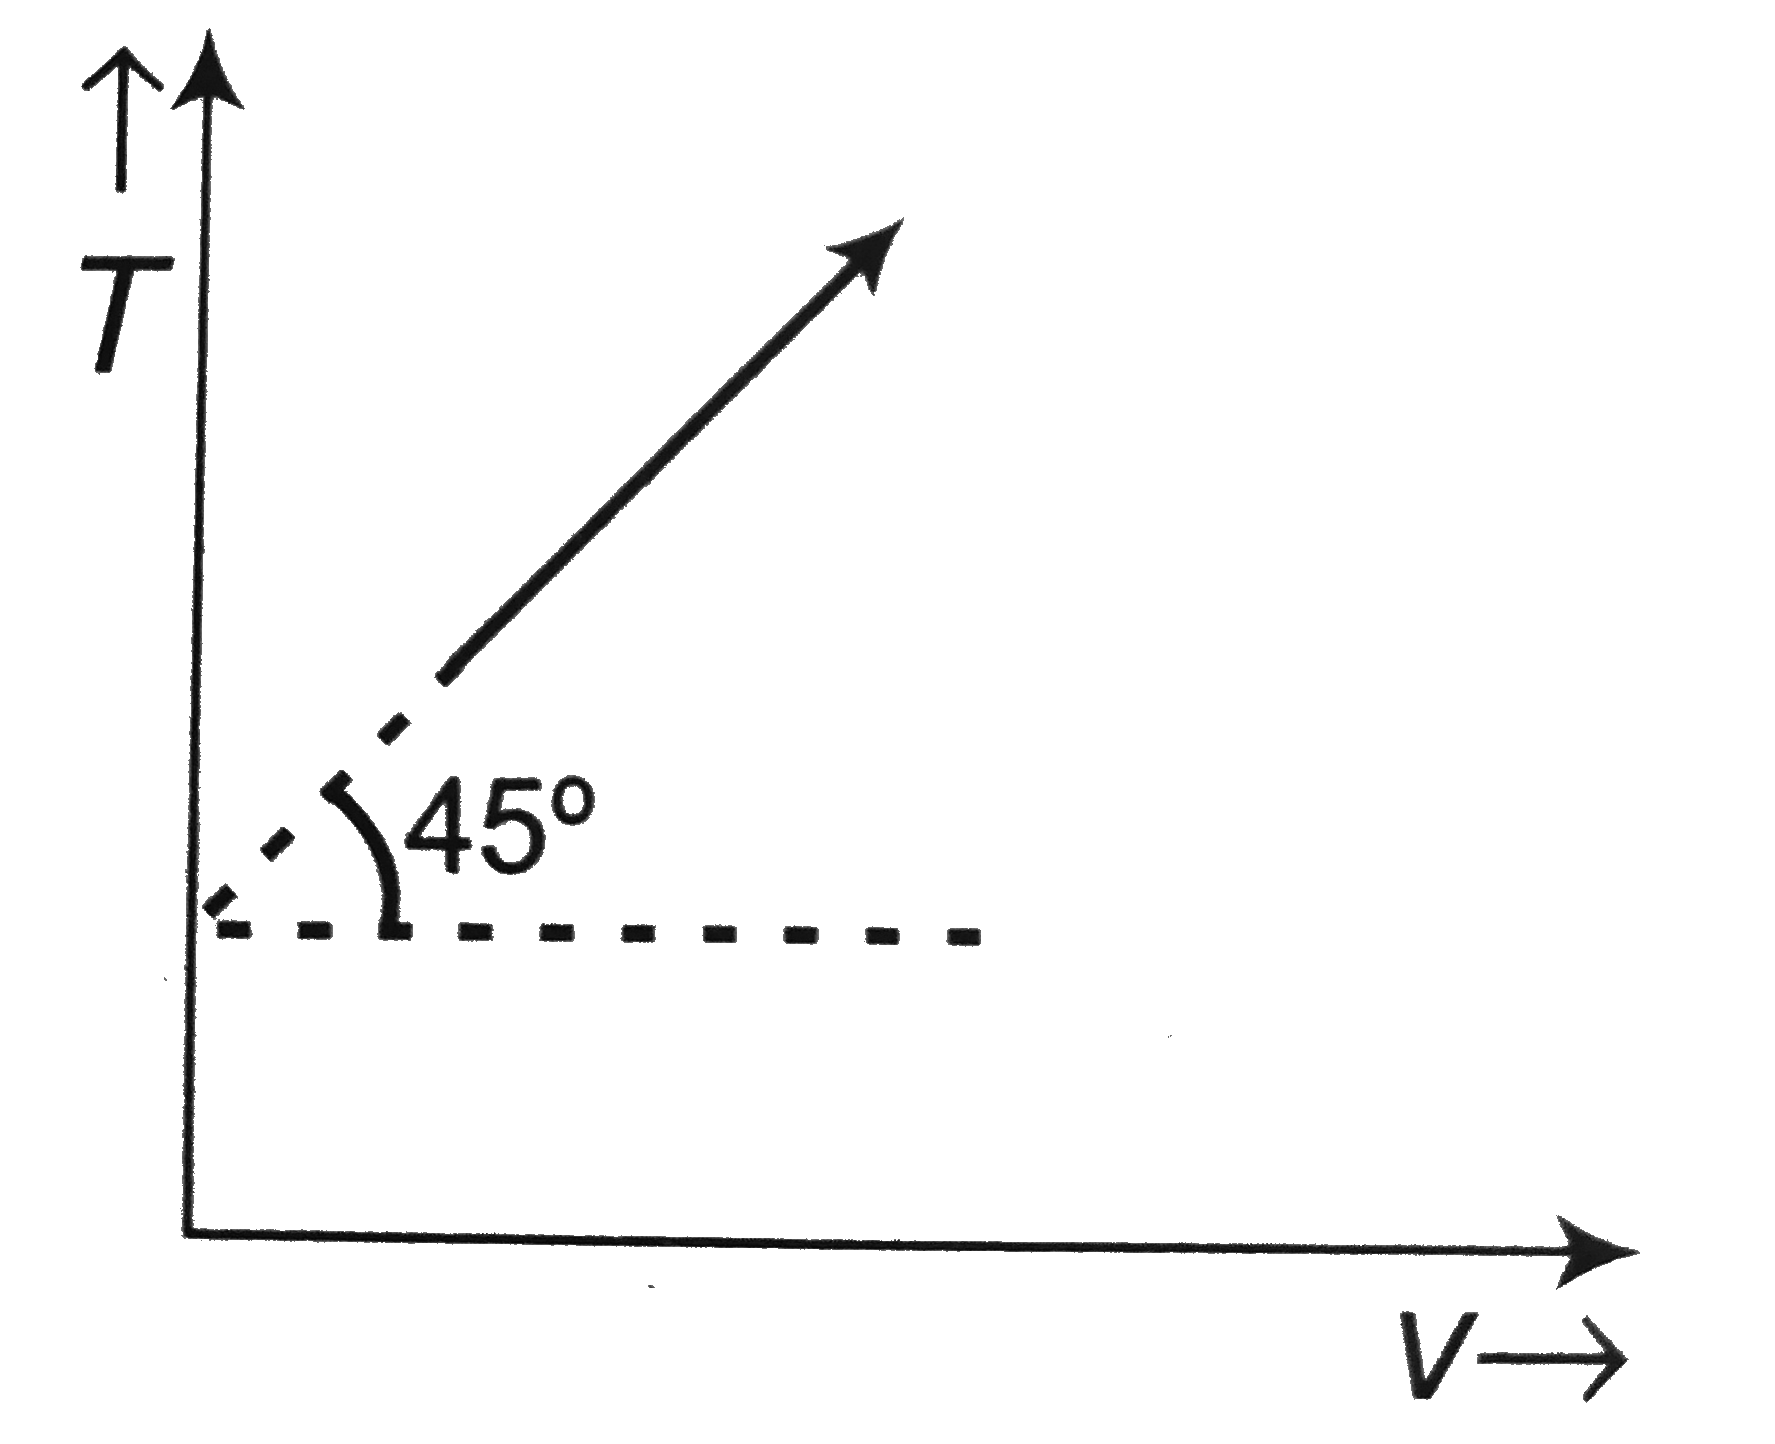
View SolutionThe given curve represents the variation of temperature as a function of volume for one mole of an ideal gas. Which of the following curves best represents the variation of pressure as a function of volume?

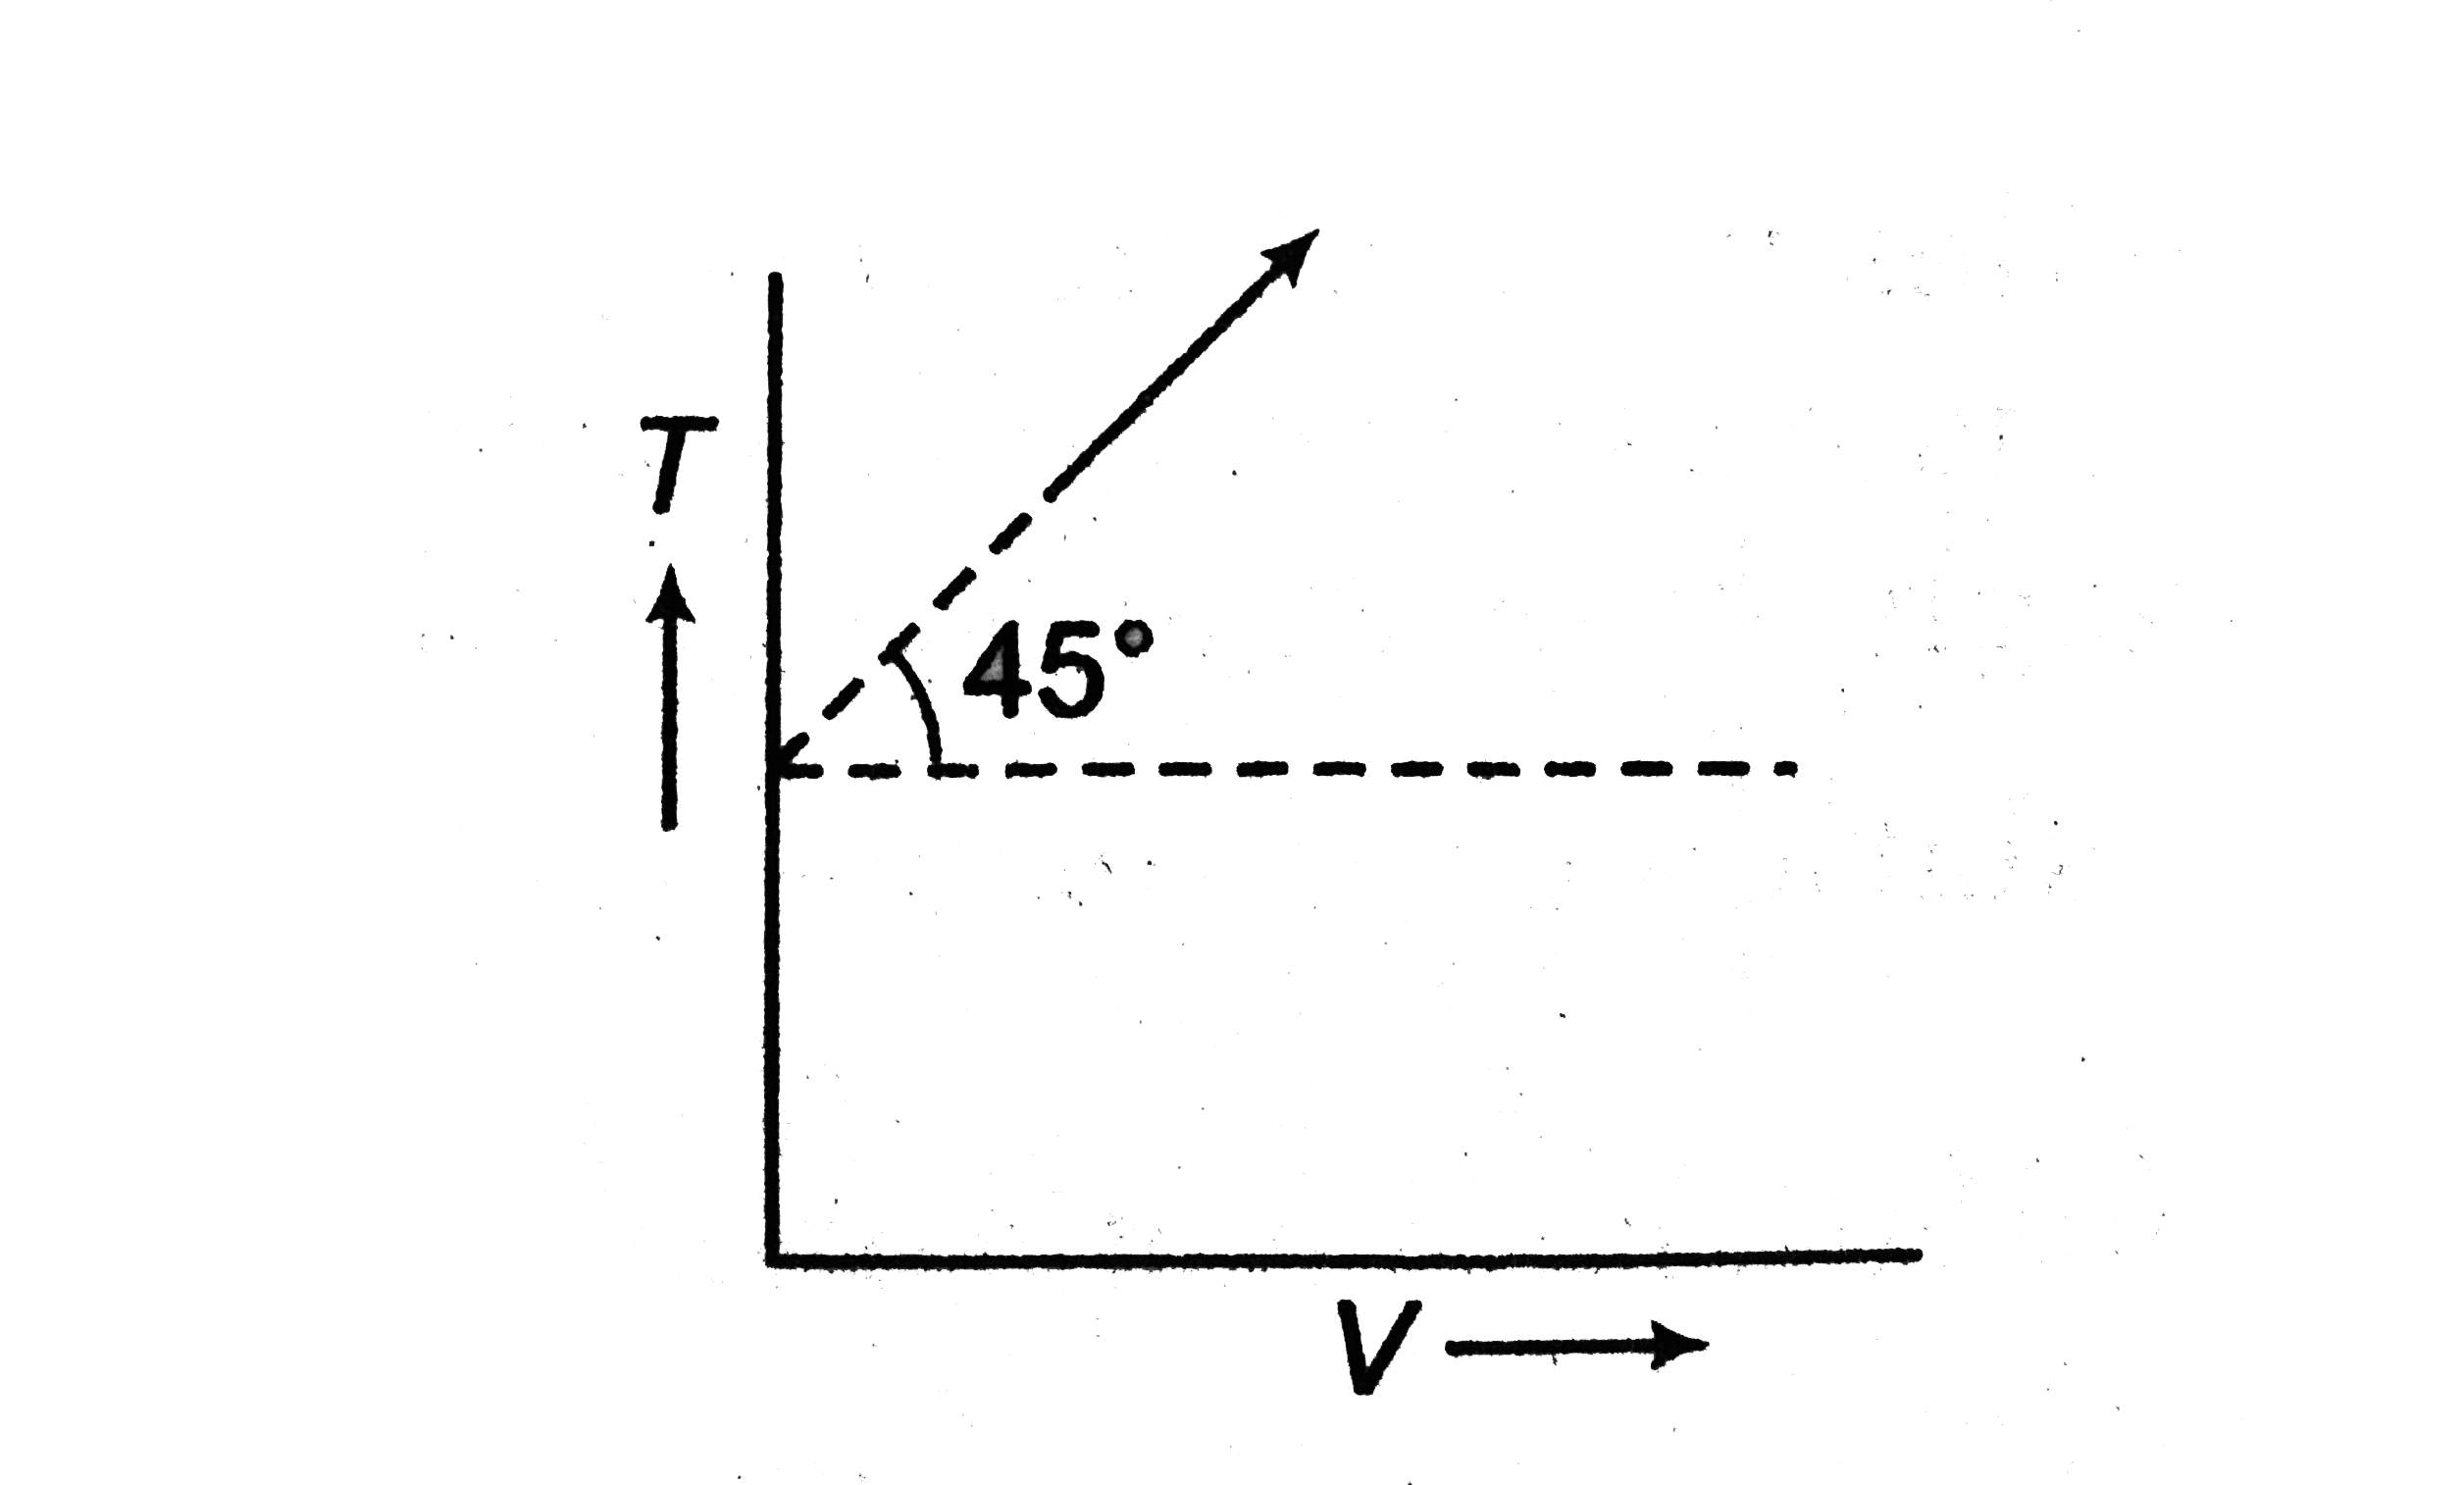
View SolutionThe given curve represents the variation of temperatue as a function of volume for one mole of an ideal gas. Which of the following curves best represents the variation of pressure as a function of volume ?
 .
.
View SolutionThe given curve represents the variation of temperatue as a function of volume for one mole of an ideal gas. Which of the following curves best represents the variation of pressure as a function of volume ?
 .
.
View SolutionHeat energy is supplied at a constant rate to 100 g of ice at 0∘C. The ice is converted into water at 0∘C in 2 minutes. How much time will be required to raise the temperature of water from 0∘C to 20∘C ? [Given : sp. Heat capacity of water 4.2g−1∘C−1, sp. latent heat of ice = 336Jg−1]
View Solution
