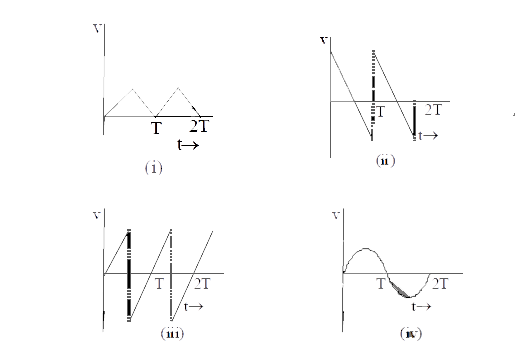
A Tennis ball is released from a height h and after freely falling on a wooden floor it rebounds and reaches height h2. The velocity versus height of the ball during its motion may be represented graphically by :
(graph are drawn schematically and on not to scale )
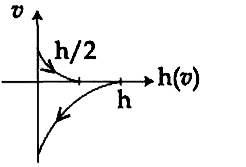
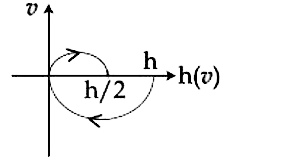
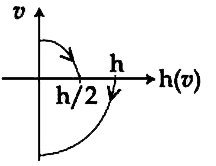
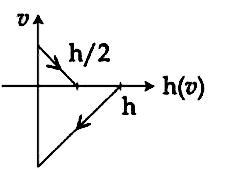
The correct Answer is:B
To solve the problem of the tennis ball's motion and to determine the appropriate velocity versus height graph, we can follow these steps:
Step 1: Understand the Motion of the Ball
The tennis ball is released from a height h and falls freely under the influence of gravity until it hits the wooden floor. After bouncing, it reaches a height of h2.
Step 2: Analyze the Falling Motion
When the ball is released from height h:
- The initial velocity u=0 (since it is released).
- As it falls, its velocity increases due to gravitational acceleration g.
- The velocity just before it hits the floor can be calculated using the equation of motion:
v2=u2+2gh⟹v2=0+2gh⟹v=√2gh
- This velocity is directed downwards, so we consider it negative in our graph.
Step 3: Analyze the Bouncing Motion
Upon hitting the floor:
- The ball rebounds to a height of h2.
- At the peak of its rebound, the velocity becomes 0 again.
- The velocity just after leaving the floor can be calculated using the same principle:
v2=u2−2g(h2)⟹v2=0−gh⟹v=−√gh
- After the bounce, the ball moves upwards, and its velocity becomes positive as it rises to h2.
Step 4: Graphical Representation
- The graph will start from height h with a negative velocity (falling down).
- As the ball falls, the velocity increases in the negative direction until it reaches the ground (height 0).
- After bouncing, the ball will have a positive velocity as it rises to h2, and the velocity will decrease to 0 at the peak.
Step 5: Determine the Shape of the Graph
- The velocity versus height graph will not be linear due to the nature of the equations of motion (quadratic relationships).
- The downward motion will show an increasing negative velocity (steeper slope) as it approaches the ground.
- The upward motion will show a decreasing positive velocity (less steep slope) as it approaches the height h2.
Conclusion
Based on the analysis:
- The graph starts with a negative slope (falling) that becomes steeper as the height decreases, and then it transitions to a positive slope (rising) that becomes less steep as the height increases to h2.
The tennis ball is released from a height h and falls freely under the influence of gravity until it hits the wooden floor. After bouncing, it reaches a height of h2.
When the ball is released from height h:
- The initial velocity u=0 (since it is released).
- As it falls, its velocity increases due to gravitational acceleration g.
- The velocity just before it hits the floor can be calculated using the equation of motion:
v2=u2+2gh⟹v2=0+2gh⟹v=√2gh
- This velocity is directed downwards, so we consider it negative in our graph.
Upon hitting the floor:
- The ball rebounds to a height of h2.
- At the peak of its rebound, the velocity becomes 0 again.
- The velocity just after leaving the floor can be calculated using the same principle:
v2=u2−2g(h2)⟹v2=0−gh⟹v=−√gh
- After the bounce, the ball moves upwards, and its velocity becomes positive as it rises to h2.
- The graph will start from height h with a negative velocity (falling down).
- As the ball falls, the velocity increases in the negative direction until it reaches the ground (height 0).
- After bouncing, the ball will have a positive velocity as it rises to h2, and the velocity will decrease to 0 at the peak.
- The velocity versus height graph will not be linear due to the nature of the equations of motion (quadratic relationships).
- The downward motion will show an increasing negative velocity (steeper slope) as it approaches the ground.
- The upward motion will show a decreasing positive velocity (less steep slope) as it approaches the height h2.
Based on the analysis:
- The graph starts with a negative slope (falling) that becomes steeper as the height decreases, and then it transitions to a positive slope (rising) that becomes less steep as the height increases to h2.
Topper's Solved these Questions
Similar Questions
A ball is dropped from a height h on to a floor . If the cofficient of restitution is e, calculate the height the ball first rebounds ?
View SolutionA tennis ball is thrown from a height h with an initial downward velocity u. It rebounces back to the same height after losing half of its KE.The value of u is
View Solution
Knowledge Check
A ball is dropped from some height. After rebound from the floor it ascends to the same height. Draw the velocity-time graph for the given motion.
A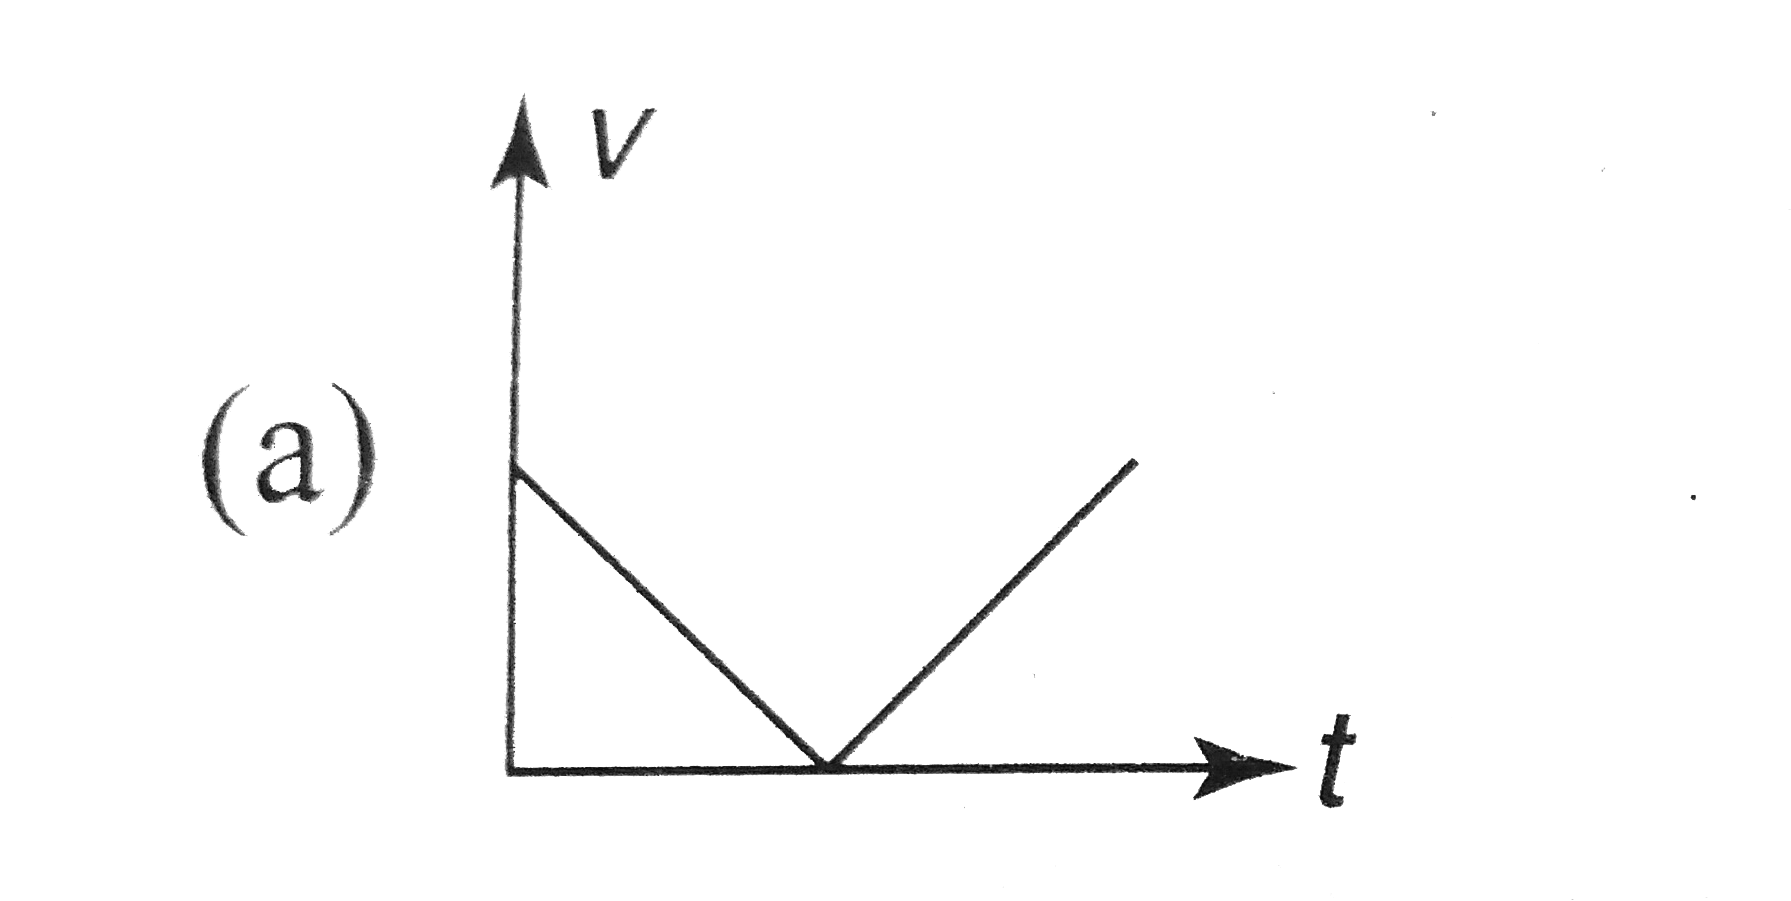 .B
.B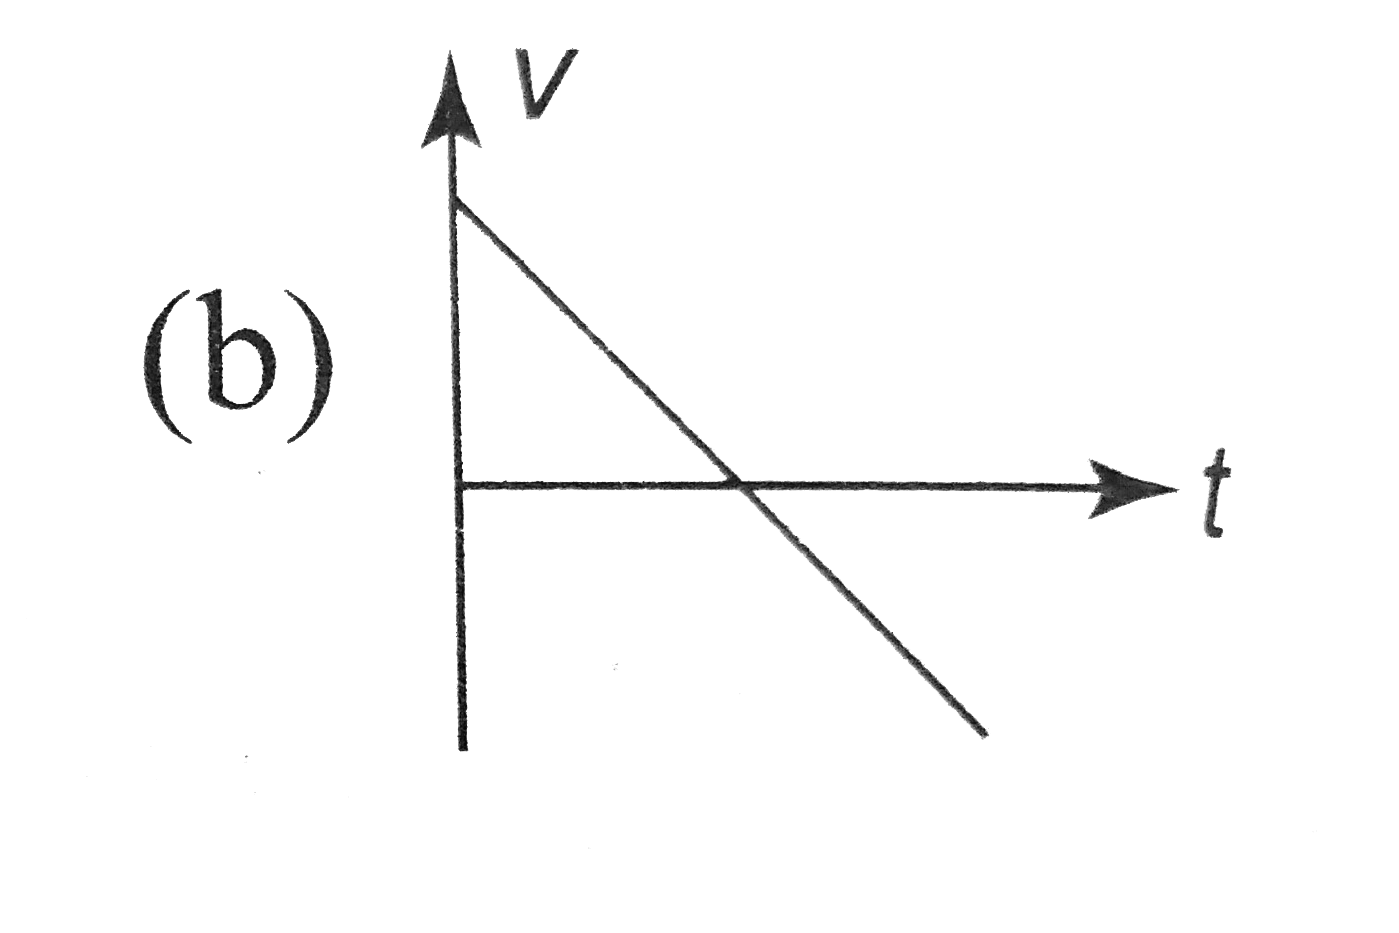 C
C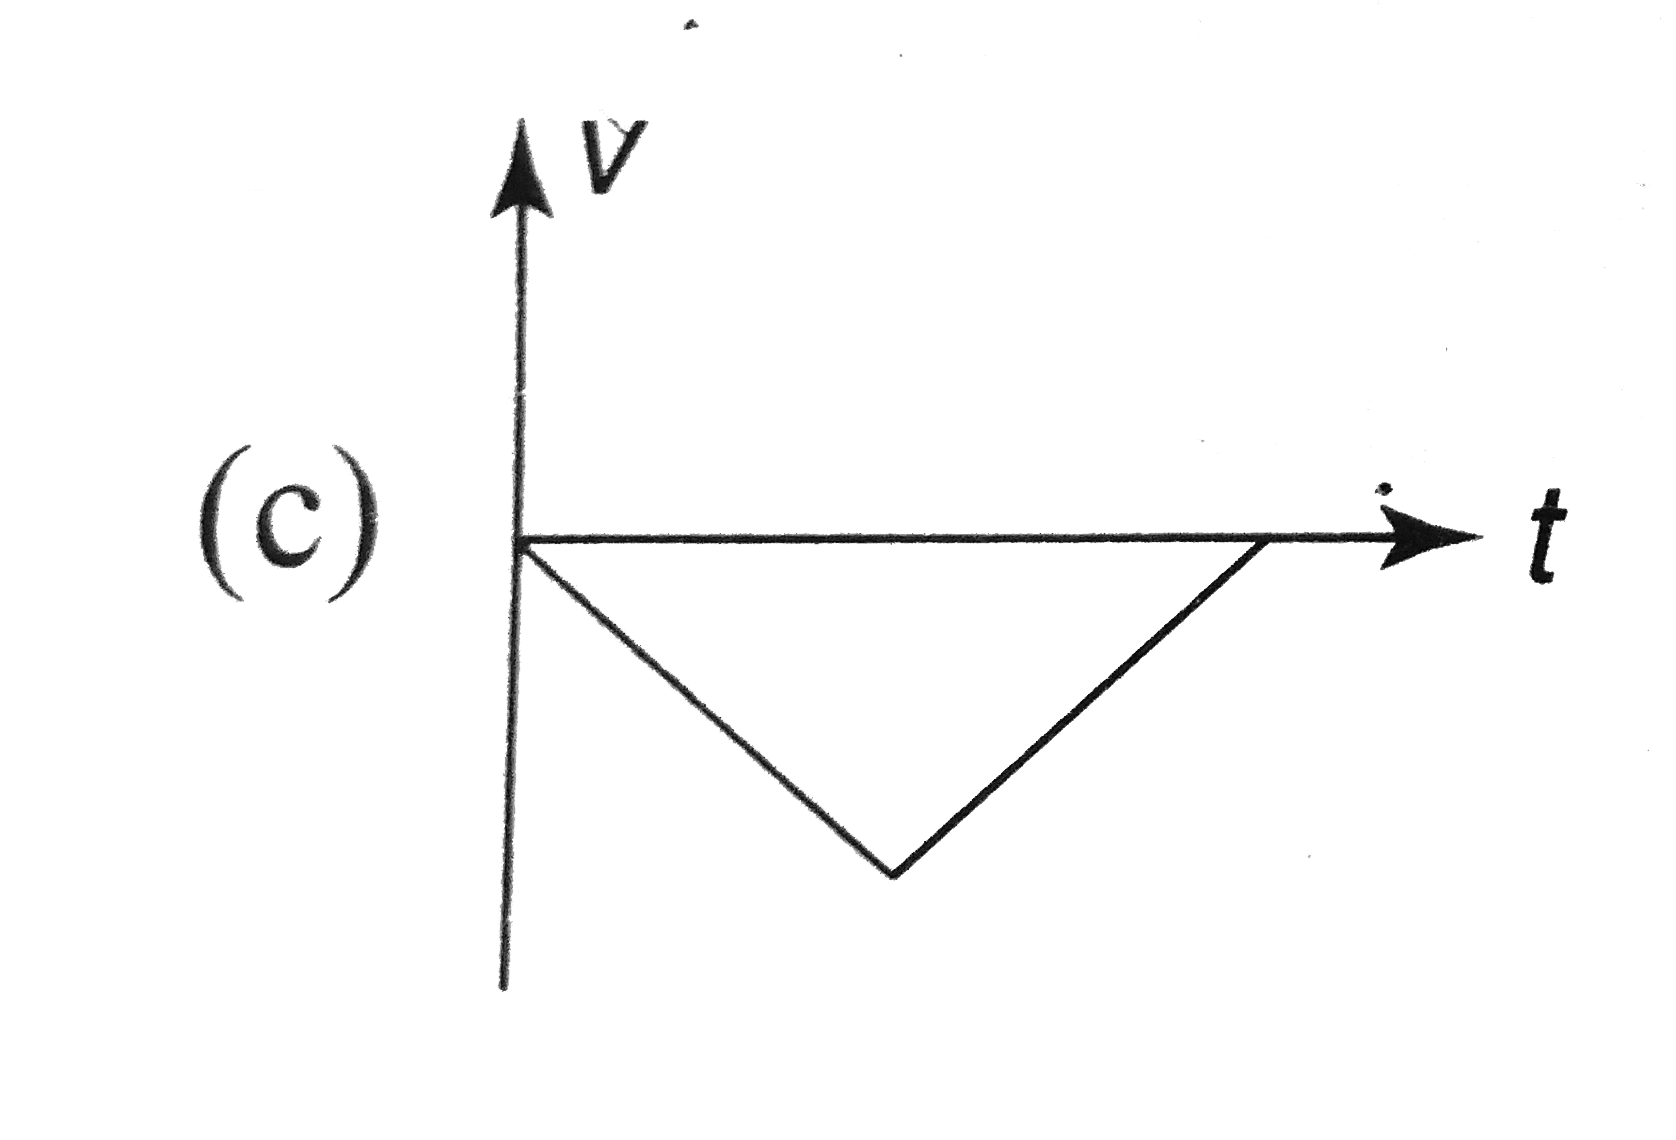 .D
.D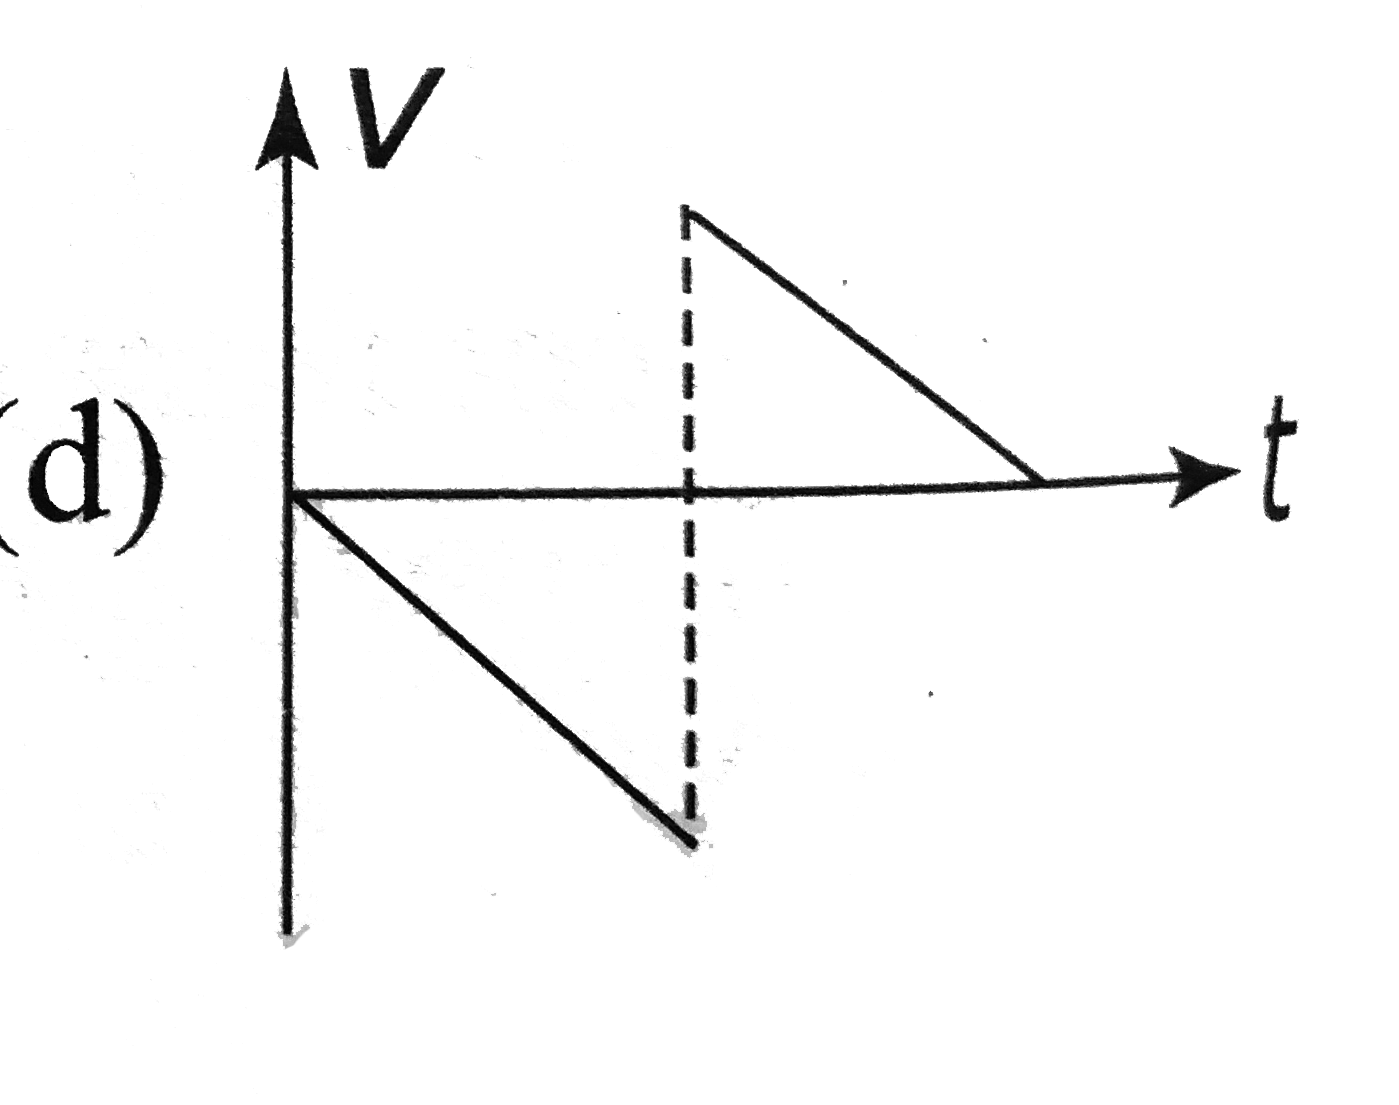 .
.A ball is dropped from a height h onto a floor and rebounds to a height h/6. The coefficient of restitution between the ball and the floor is
A12B14C23D1√6A tennis ball is released from height h above ground level. If the ball makes inelastic collision with the ground, to what height will it rise after third collision
Ahe6Be2hCe3hDNone of these
A tennis ball is released from height h above ground level. If the ball makes inelastic collision with the ground, to what height will it rise after third collision
View SolutionA ball falls from rest from a height h onto a floor, and rebounds to a height h/4. The coefficient of restitution between the ball and the floor is
View SolutionA ball of mass m falls vertically to the ground from a height h1 and rebound to a height h1 and rebound to a height h2. The change in momentum of the ball on striking the ground is.
View SolutionA ball is dropped from certain height on a glass floor so that it rebounds elastically to the same height. If the process continues, the velocity -time graph for such a motion would be -
View SolutionA rubber ball falling from a height of 5m rebounds from hard floor to a height of 3.5m. The % loss of energy during the impact is
View Solution
