A travelling wave on a long stretched string along the positIve x-axis is given by y=5mme(T5s−x5cm)2. Using this equation answer the following questions.
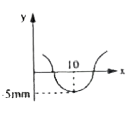
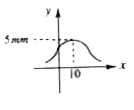
The plot of y and x at t = 10 s is best indicated by


The correct Answer is:B
To solve the problem, we need to analyze the given wave equation and determine the plot of y versus x at t=10s.
1. Understand the Wave Equation:
The wave is described by the equation:
y=5mme(T5s−x5cm)2
Here, T is the time variable, x is the position along the string, and e is the base of the natural logarithm.
2. Substitute the Given Time:
We are asked to find the plot at t=10s. Substitute T=10s into the equation:
y=5mme(10s5s−x5cm)2
Simplifying this gives:
y=5mme(2−x5cm)2
3. Analyze the Exponential Term:
The term (2−x5cm)2 indicates that the wave will have a maximum value when the argument of the exponential function is zero. This occurs when:
2−x5cm=0⟹x=10cm
4. Determine the Maximum Value of y:
At x=10cm:
y=5mme0=5mm
This is the maximum value of y.
5. Behavior of the Function:
As x moves away from 10cm, the value of y will decrease rapidly due to the nature of the exponential function. The plot will show a peak at x=10cm and will taper off as x moves away from this point.
6. Plotting the Function:
The plot of y versus x at t=10s will show a Gaussian-like shape centered at x=10cm with a maximum height of 5mm.
Conclusion:
The plot of y versus x at t=10s is best indicated by a Gaussian curve peaking at x=10cm with a maximum value of 5mm.
The wave is described by the equation:
y=5mme(T5s−x5cm)2
Here, T is the time variable, x is the position along the string, and e is the base of the natural logarithm.
We are asked to find the plot at t=10s. Substitute T=10s into the equation:
y=5mme(10s5s−x5cm)2
Simplifying this gives:
y=5mme(2−x5cm)2
The term (2−x5cm)2 indicates that the wave will have a maximum value when the argument of the exponential function is zero. This occurs when:
2−x5cm=0⟹x=10cm
At x=10cm:
y=5mme0=5mm
This is the maximum value of y.
As x moves away from 10cm, the value of y will decrease rapidly due to the nature of the exponential function. The plot will show a peak at x=10cm and will taper off as x moves away from this point.
The plot of y versus x at t=10s will show a Gaussian-like shape centered at x=10cm with a maximum height of 5mm.
The plot of y versus x at t=10s is best indicated by a Gaussian curve peaking at x=10cm with a maximum value of 5mm.
Topper's Solved these Questions
- BOOK - AAKASH SERIESCHAPTER - WAVE MOTIONEXERCISE - LECTURE SHEET (EXERCISE-I (LEVEL-II(ADVANCED)MATRIX MATCHING TYPE QUESTIONS))1videos
WAVE MOTION
- BOOK - AAKASH SERIESCHAPTER - WAVE MOTIONEXERCISE - LECTURE SHEET (EXERCISE-II (LEVEL-I(MAIN) STRAIGHT OBJECTIVE TYPE QUESTIONS))6videos
WAVE MOTION
- BOOK - AAKASH SERIESCHAPTER - WAVE MOTIONEXERCISE - LECTURE SHEET (EXERCISE-I (LEVEL-II(ADVANCED)MORE THAN ONE CORRECT ANSWER TYPE QUESTIONS))4videos
WAVE MOTION
- BOOK - AAKASH SERIESCHAPTER - UNITS AND MEASUREMENTSEXERCISE - EXERCISE -366videos
UNITS AND MEASUREMENTS
- BOOK - AAKASH SERIESCHAPTER - WAVE MOTION AND SOUNDEXERCISE - PROBLEMS (LEVEL - II)97videos
WAVE MOTION AND SOUND
Similar Questions
A travelling wave on a long stretched string along the positIve x-axis is given by y=5mme(T5s−x5cm)2 . Using this equation answer the following questions.
The velocity of the wave isView SolutionA travelling wave on a long stretched string along the positIve x-axis is given by y=5mme(t5s−x5cm)2. Using this equation answer the following questions.
At t = 0, x = 0, the displacement of the wave isView Solutionthe equation of a wave travelling along the positive x - axis ,as shown in figure at t = 0 is given by
 View Solution
The equation of a wave travelling on a string stretched along the X-axis is given by
y=Ae(−xa+tT)2
(a) Write the dimensions of A, a and T.
(b) Find the wave speed.
(c) In which direction is the wave travelling?
(d) Where is the maximum of the pulse located at t=T and at t=2T?View SolutionThe equation of a wave travelling along the positive x-axis, as shown in figure at t = 0 is given by
 View Solution
The equation of a wave travelling on a string stretched along the X-axis is given by
y=Ae(−xa+tT)2
(a) Write the dimensions of A, a and T.
(b) Find the wave speed.
(c) In which direction is the wave travelling?
(d) Where is the maximum of the pulse located at t=T and at t=2T?View SolutionA wave is propagating on a long stretched string along its length taken as the positive x-axis. The wave equation is given as
y=y0e−(tT−xλ)2
where y0=4mm,T=1.0sandλ=4cm.(a) find the velocity of wave. (b) find the function f(t) giving the displacement of particle at x=0. (c) find the function g(x) giving the shape of the string at t=0.(d) plot the shape g(x) of the string at t=0 (e) Plot of the shape of the string at t=5s.View SolutionA transverse wave travelling on a stretched string is is represented by the equation
y=2(2x−6.2t)2+20. Then ,View SolutionA transverse wave travelling along the positive x-axis, given by y=Asin(kx−ωt) is superposed with another wave travelling along the negative x-axis given by y=Asin(kx+ωt). The point x=0 is
View SolutionA pulse is propagating on a long stretched string along its length taken as positive x-axis. Shape of the string at t = 0 is given by y=√a2−x2when |x|≤a=0 when |x|≥a . What is the general equation of pulse after some time 't' , if it is travelling along positive x-direction with speed V?
View Solution
