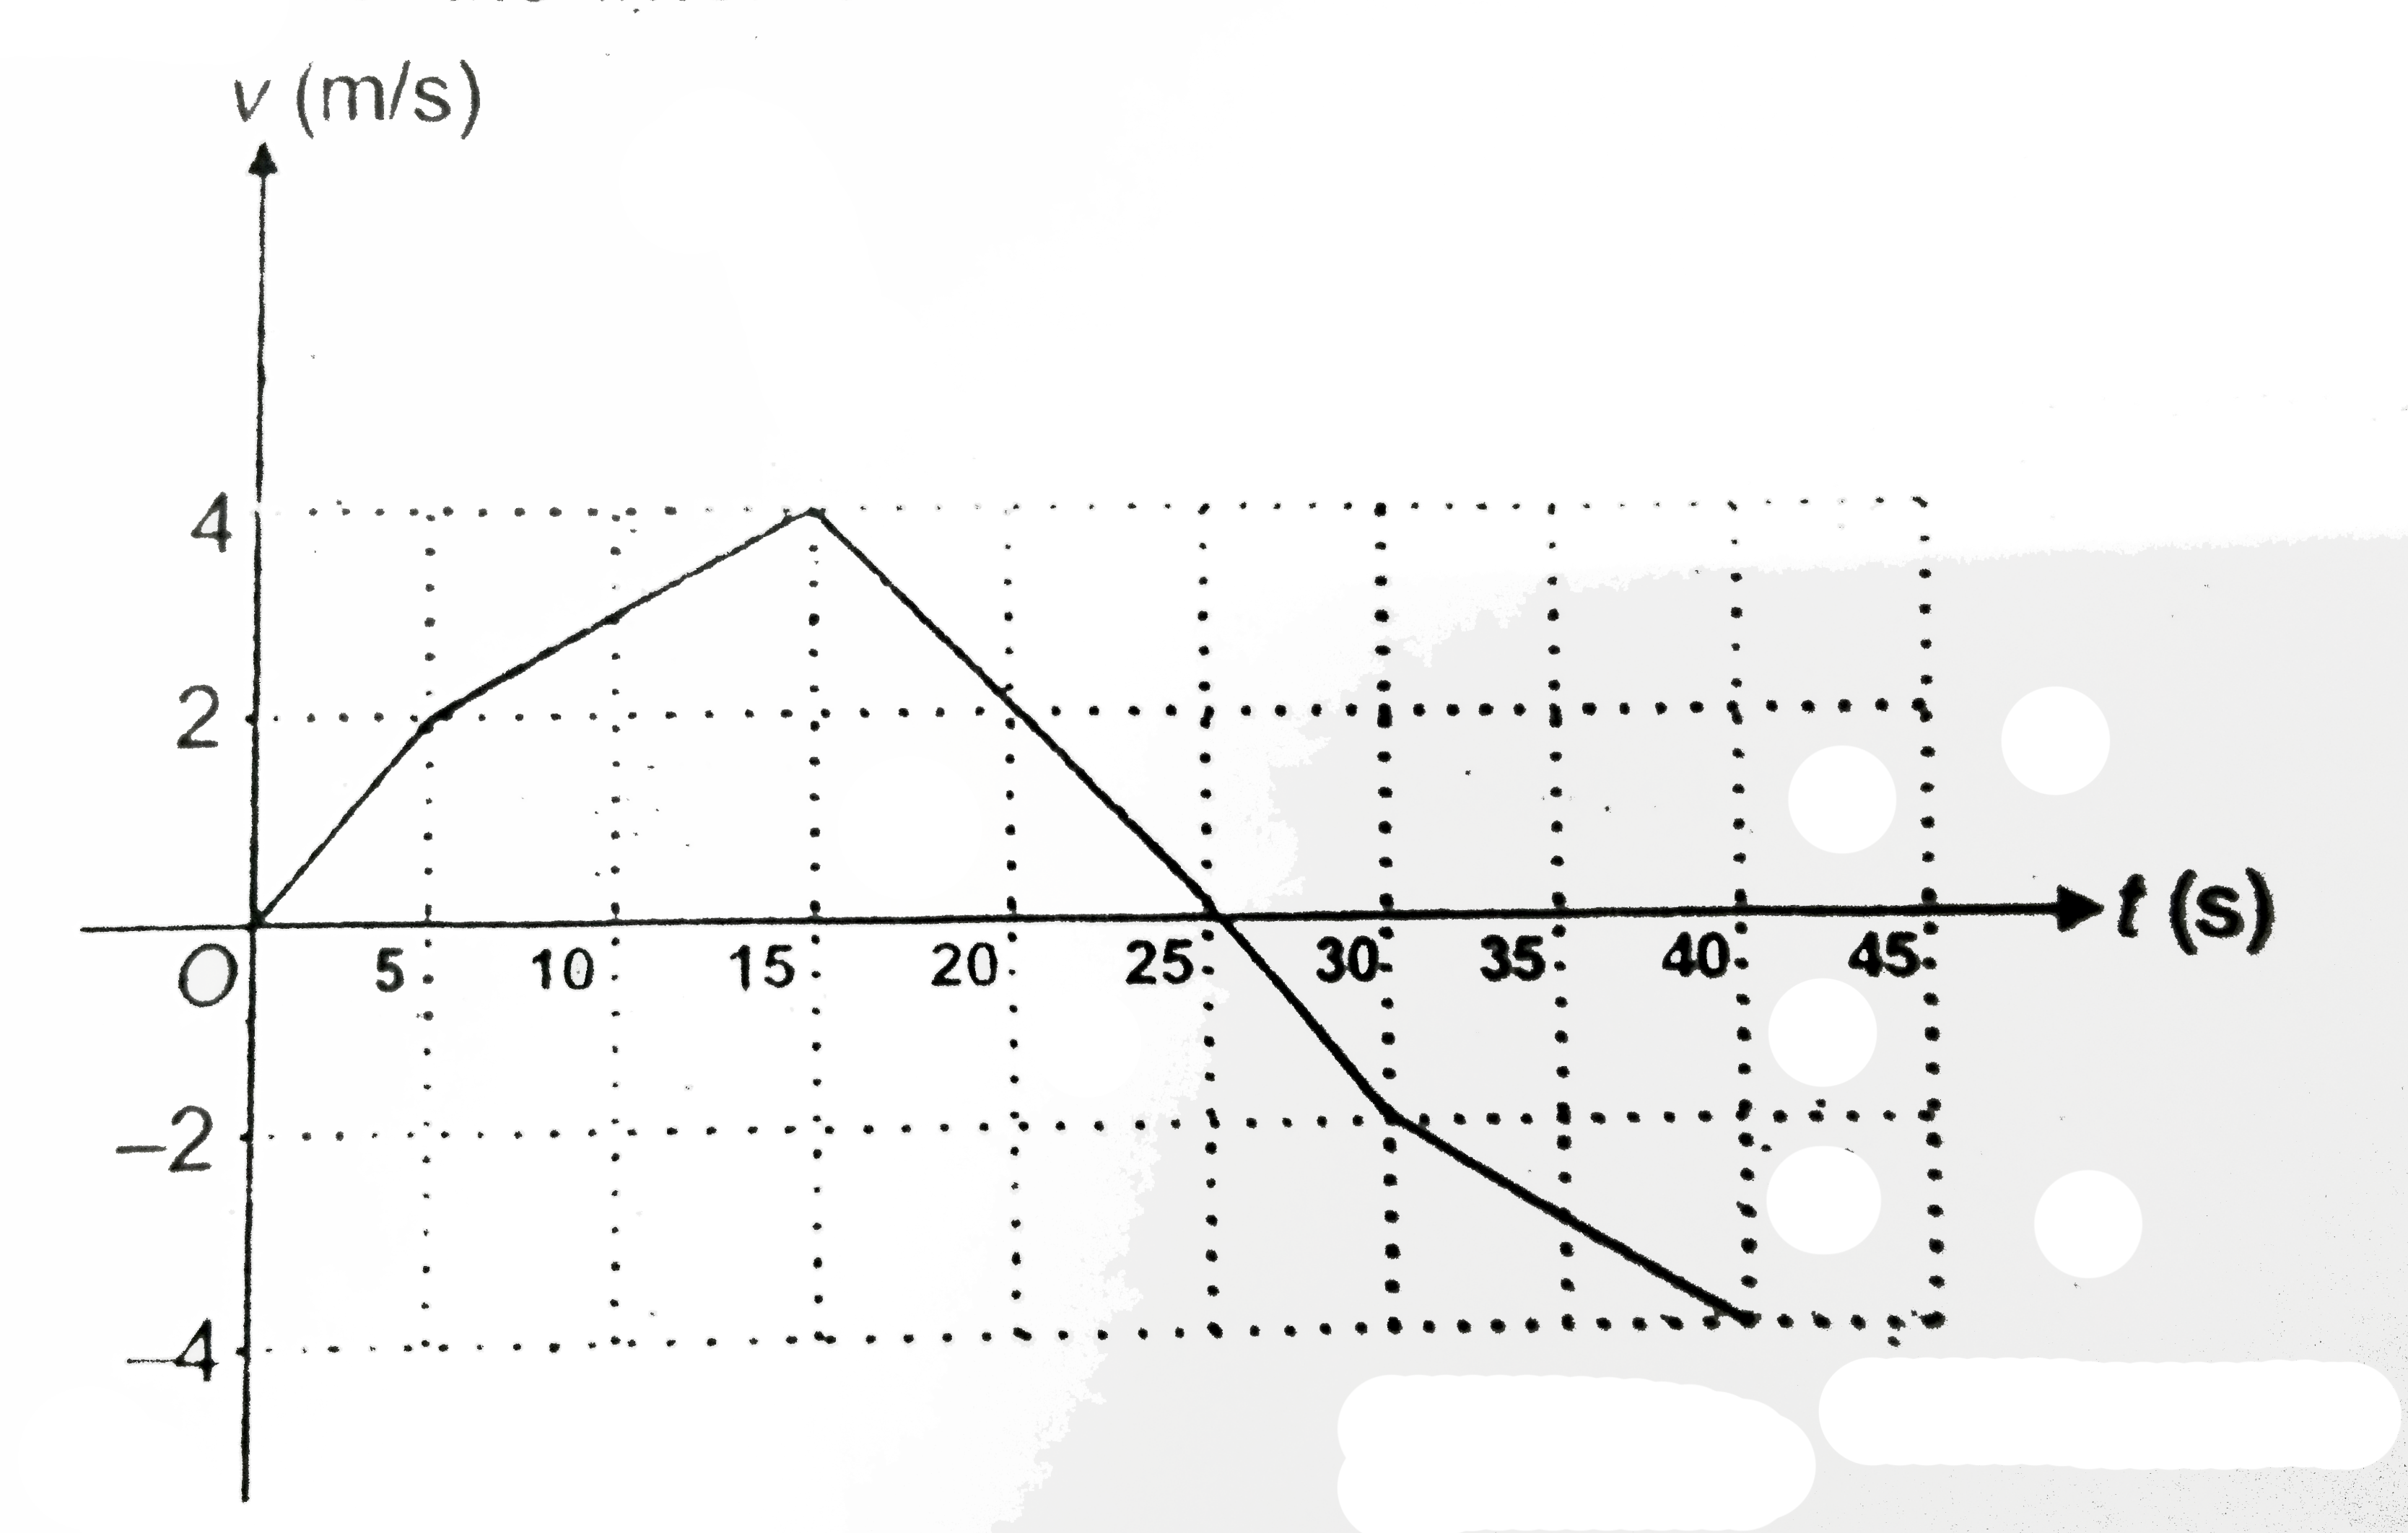
A velocity time graph is given for a particle moving in x direction, as below

(a) Describe the motion qualitatively in the interval 0 to 55s.
(b) Find the distance and displacement travelled from 0 to 40 s.
Find the acceleration at t = 5s and at 20 s.
From Oto A: (0 sto 10 s) At t=0 the particle has zero velocity. At t>0, particle has positive velocity and moves in the positive x direction. From Os to 10s the slope (dydt) is positive, implying the particle is accelerating.
Thus the velocity increases during this time interval. Froin A to B: (10 s to 15 s)
From 10 s to 15 s the velocity stays constant at 60ms−1. The acceleration is 0 during this period. But the particle continues to travel in the positive x-direction.
From B to C:(15 s to 30s)
From the 15 s to 30 s the slope is negative, implying the velocity is decreasing. But the particle is moving in the positive x direction. At = 30 s the velocity becomes zero, and the particle comes to rest momentarily at t = 30 s.
From C to D: (30 s to 40 s)
From 30 s to 40 s the velocity is negative. It implies that the particle starts to move in the negative x direction. The magnitude of velocity increases to a maximum 40ms−1
From D to E: (40 s to 55 s)
From 40 s to 55 s the velocity is still negative, but starts increasing from −40ms−1. At t= 55 s the velocity of the particle is zero and particle comes to rest.
(b) The total area under the curve from 0 s to 40 s will give the displacement. Here the area from 0 to Crepresents motion along positive x-direction and the area under the graph from C to D represents the particle.s motion along negative x-direction.
The displacement travelled by the particle from 0 s to 10s=12×10×60=300m.
The displacement travelled from 10 s to 15 s=12×60×5=300m.
The displacement travelled from 15 s to 30 s=12×15×60=450m.
The displacement travelled from 30 s to 40s =12×10×(−40)=−200m. Here the negative sign implies that the particle travels 200 m in the negative x direction.
The total displacement from 0 to 40 s is given by
300m+300m+450m−200m=+850m
Thus the particle.s net displacement is along the positive x-direction.
The total distance travelled by the particle from 0 s to 40s =300+300+450+200=1250m.
(c) The acceleration is given by the slope in the velocity-time graph. In the first 10 seconds the velocity has constant slope (constant acceleration). It implies that the acceleration a is from v1=0 to v2=60ms−1.
Hence, a=v2−v1t2−t1 gives
a=60−010−0=6ms−2
Next, the particle has constant negative slope from 15s to 30s. In this case v2=0andv160ms−1. Thus the acceleration at t=20 s is given by a=0−6030−15=−4ms−2. Here the negative sign implies that the particle has negative acceleration.
Topper's Solved these Questions
- KINEMATICSBOOK - FULL MARKSCHAPTER - KINEMATICSEXERCISE - TEXTUAL QUESTIONS SOLVED (MULTIPLE CHOICE QUESTIONS:)
30 Videos
- KINEMATICSBOOK - FULL MARKSCHAPTER - KINEMATICSEXERCISE - TEXTUAL QUESTIONS SOLVED (SHORT ANSWER QUESTIONS)
30 Videos
- HEAT AND THERMODYNAMICSBOOK - FULL MARKSCHAPTER - HEAT AND THERMODYNAMICSEXERCISE - ADDITIONAL QUESTIONS SOLVED (Numerical Problems)
16 Videos
- KINETIC THEORY OF GASESBOOK - FULL MARKSCHAPTER - KINETIC THEORY OF GASESEXERCISE - Addtional Numerical Problems
10 Videos
Similar Questions
From the veloicty time graph of a particle given in figure describe the motion of the particle qualitively int eh interval 0 to 4s. Find a. the distance travelled during first two seconds, b. during the time 2s to 4s, c. during the time 0 to 4s d. displacement during 0 to 4 s. e. acceleration at t=1/2 and f. acceleration at t=2s
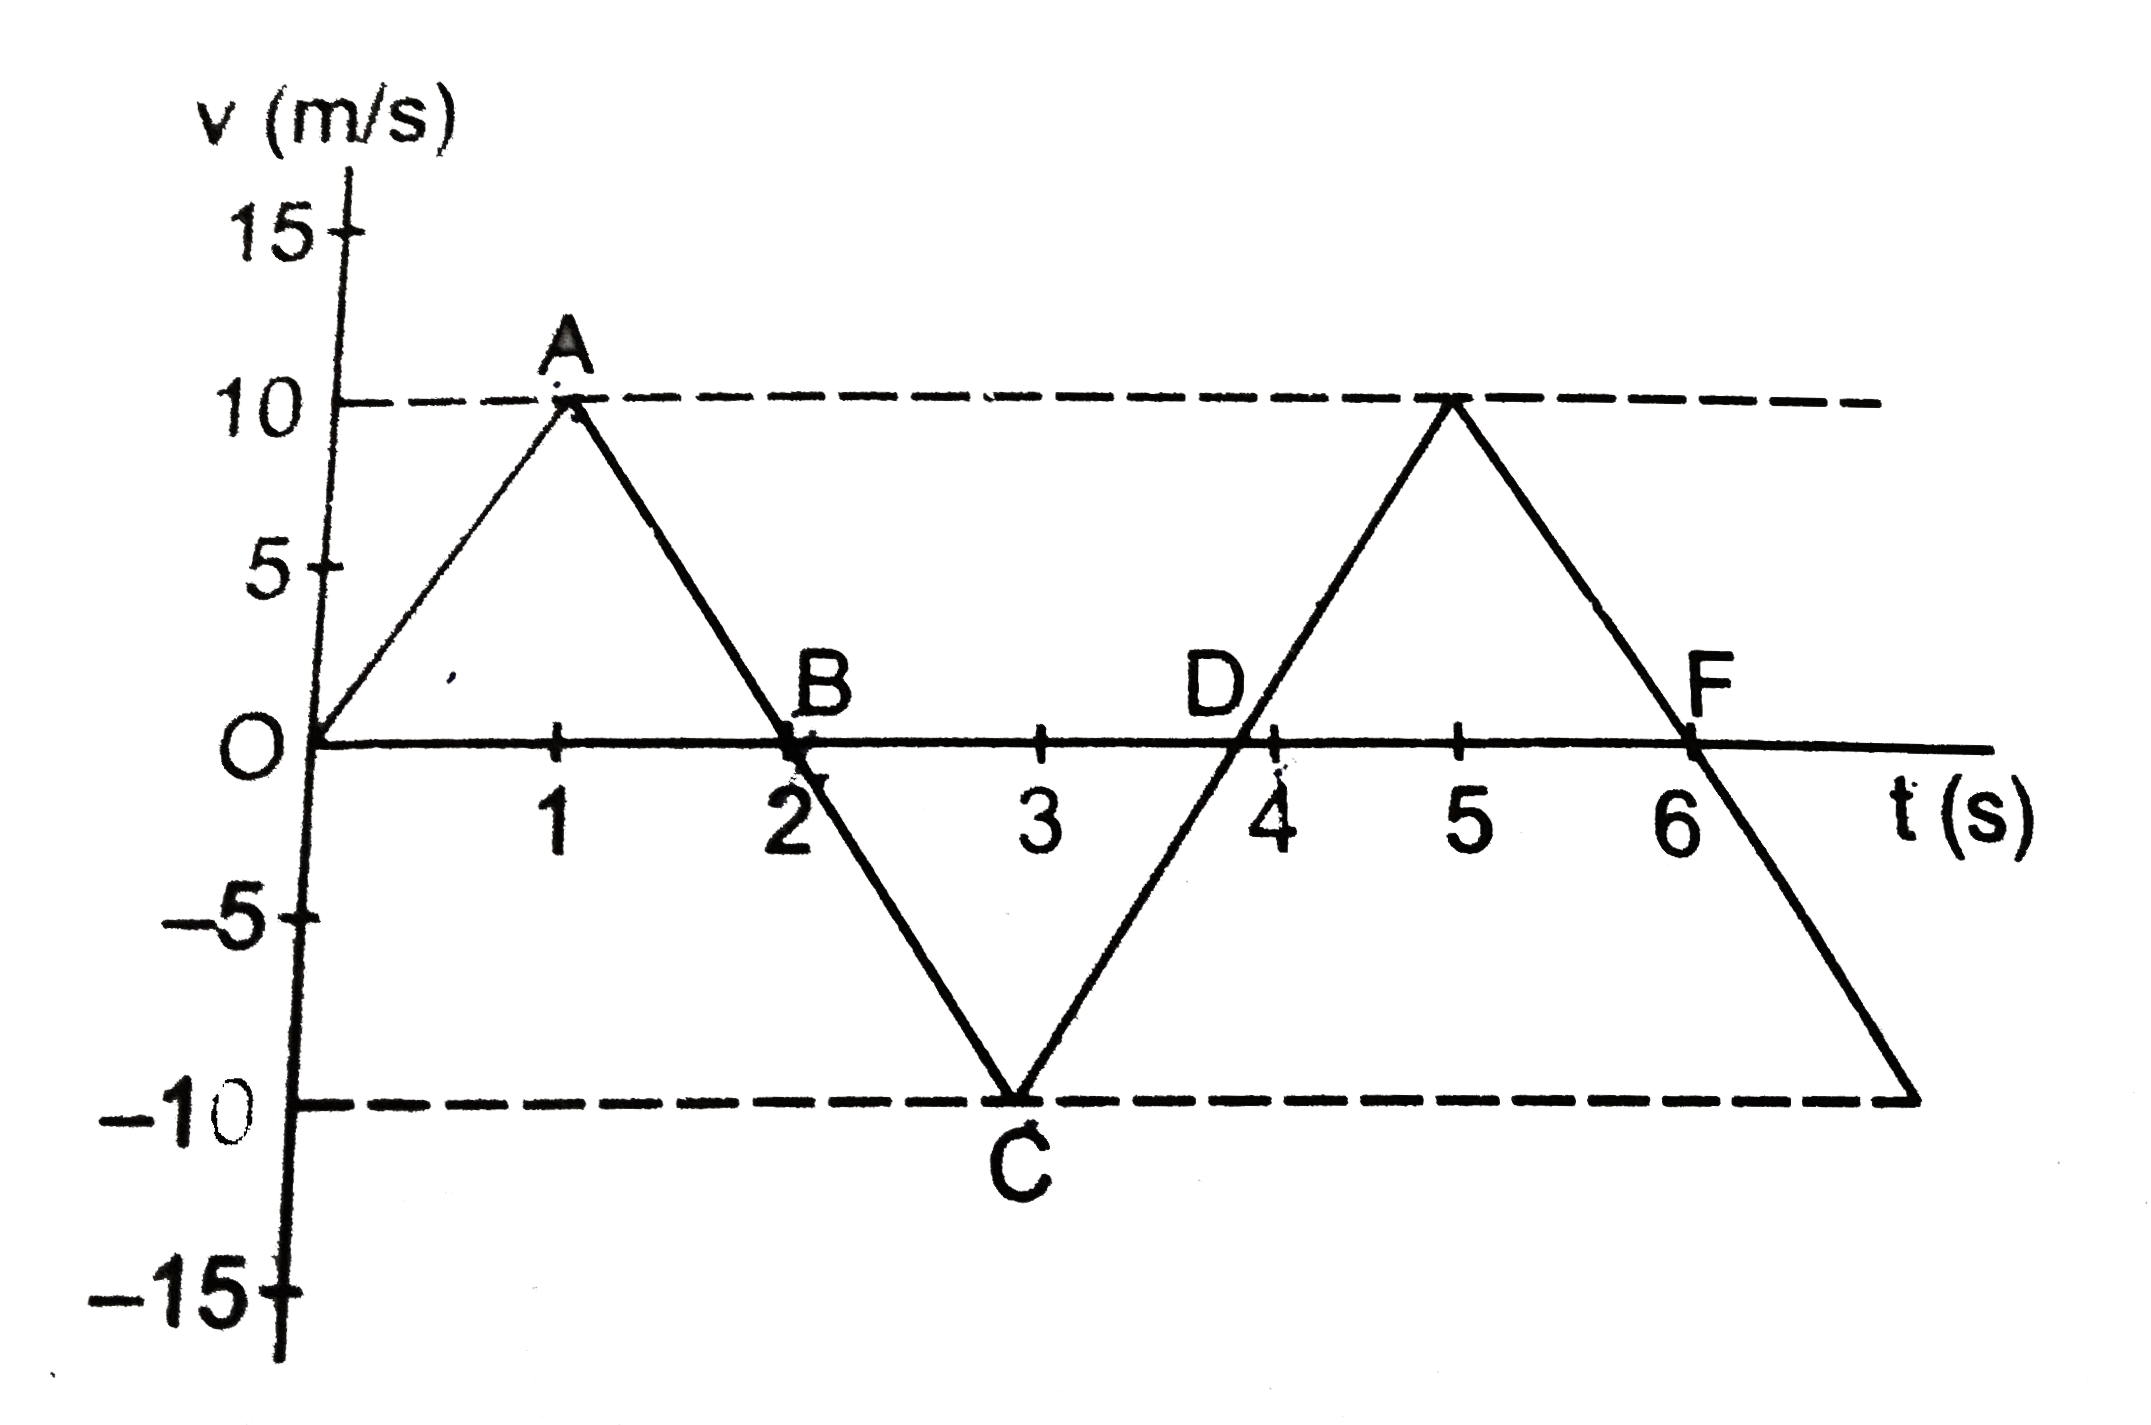 .
.
View SolutionThe v-t graph for a particle moving along x-axis is shown in the figure, find
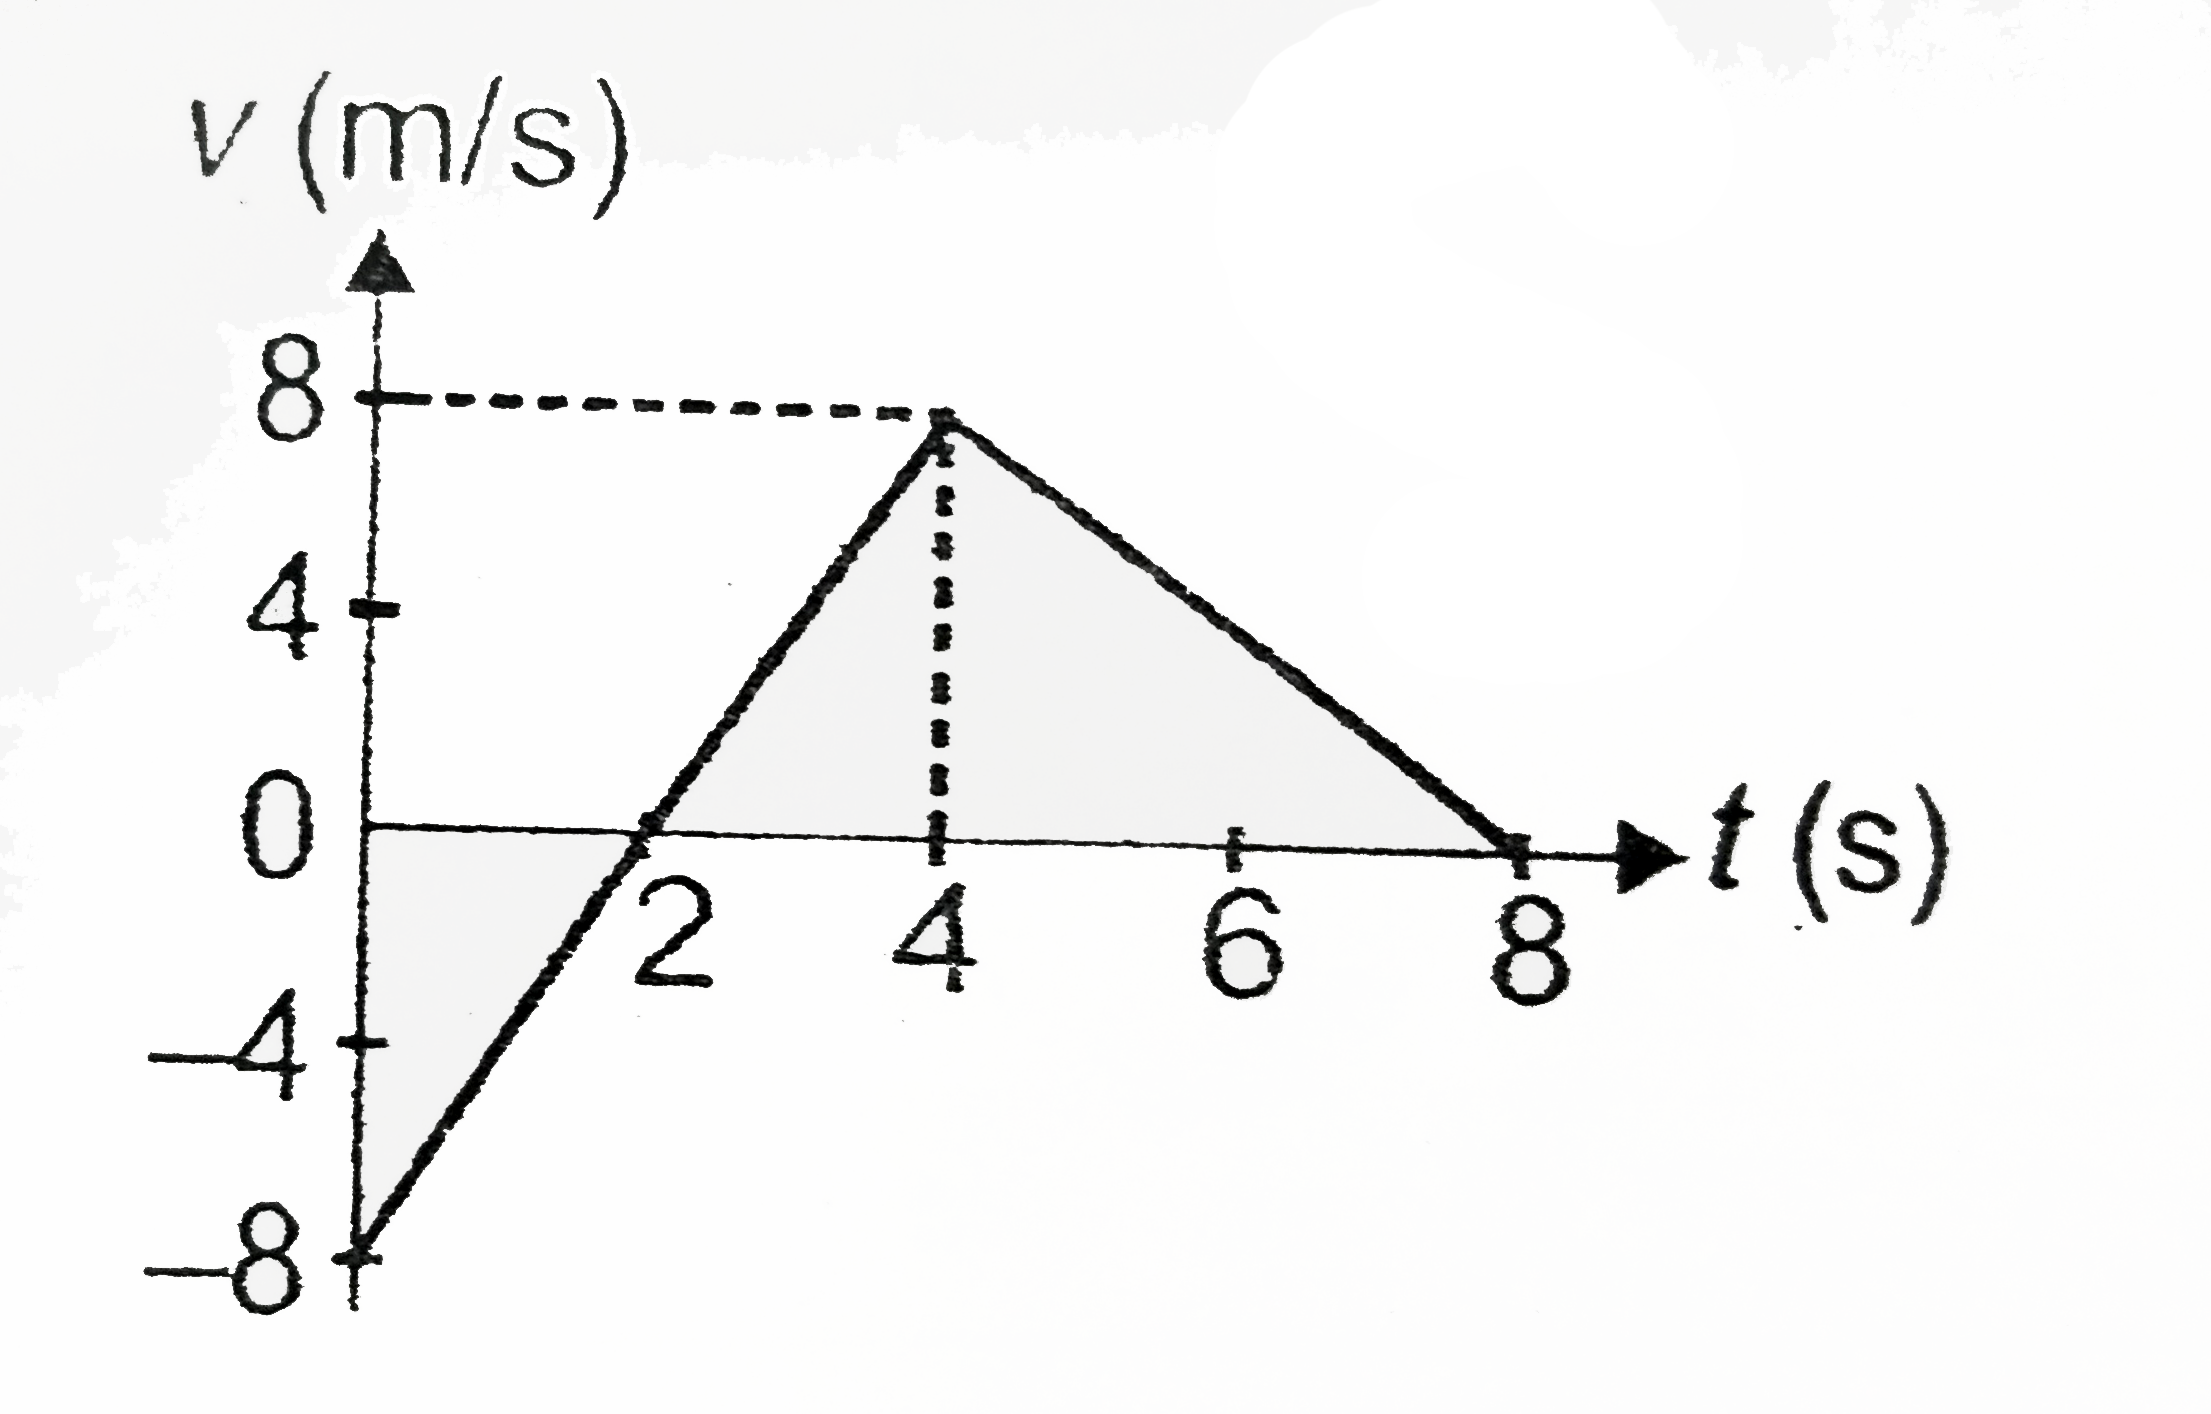
(a) Average velocity in the interval 0 to 8 s.
(b) Average speed in the interval 0 to 8 s.
(c) Average acceleration in the interval 0 to 4 s.
(d) Instantaneous acceleration at t = 2.5 s.
View Solution
Knowledge Check
From the veloicty time graph of a particle given in figure describe the motion of the particle qualitively int eh interval 0 to 4s. Find a. the distance travelled during first two seconds, b. during the time 2s to 4s, c. during the time 0 to 4s d. displacement during 0 to 4 s. e. acceleration at t=1/2 and f. acceleration at t=2s
 .A20m 20mB20m 30mC30m 20mD10m 20m
If the distance s travelled by a particle in time t is s=asint+bcos2t, then the acceleration at t=0 is
AaB−aC4bD−4b
The v-t graph for a particle moving along x-axis is shown in the figure, find

(a) Average velocity in the interval 0 to 8 s.
(b) Average speed in the interval 0 to 8 s.
(c) Average acceleration in the interval 0 to 4 s.
(d) Instantaneous acceleration at t = 2.5 s.
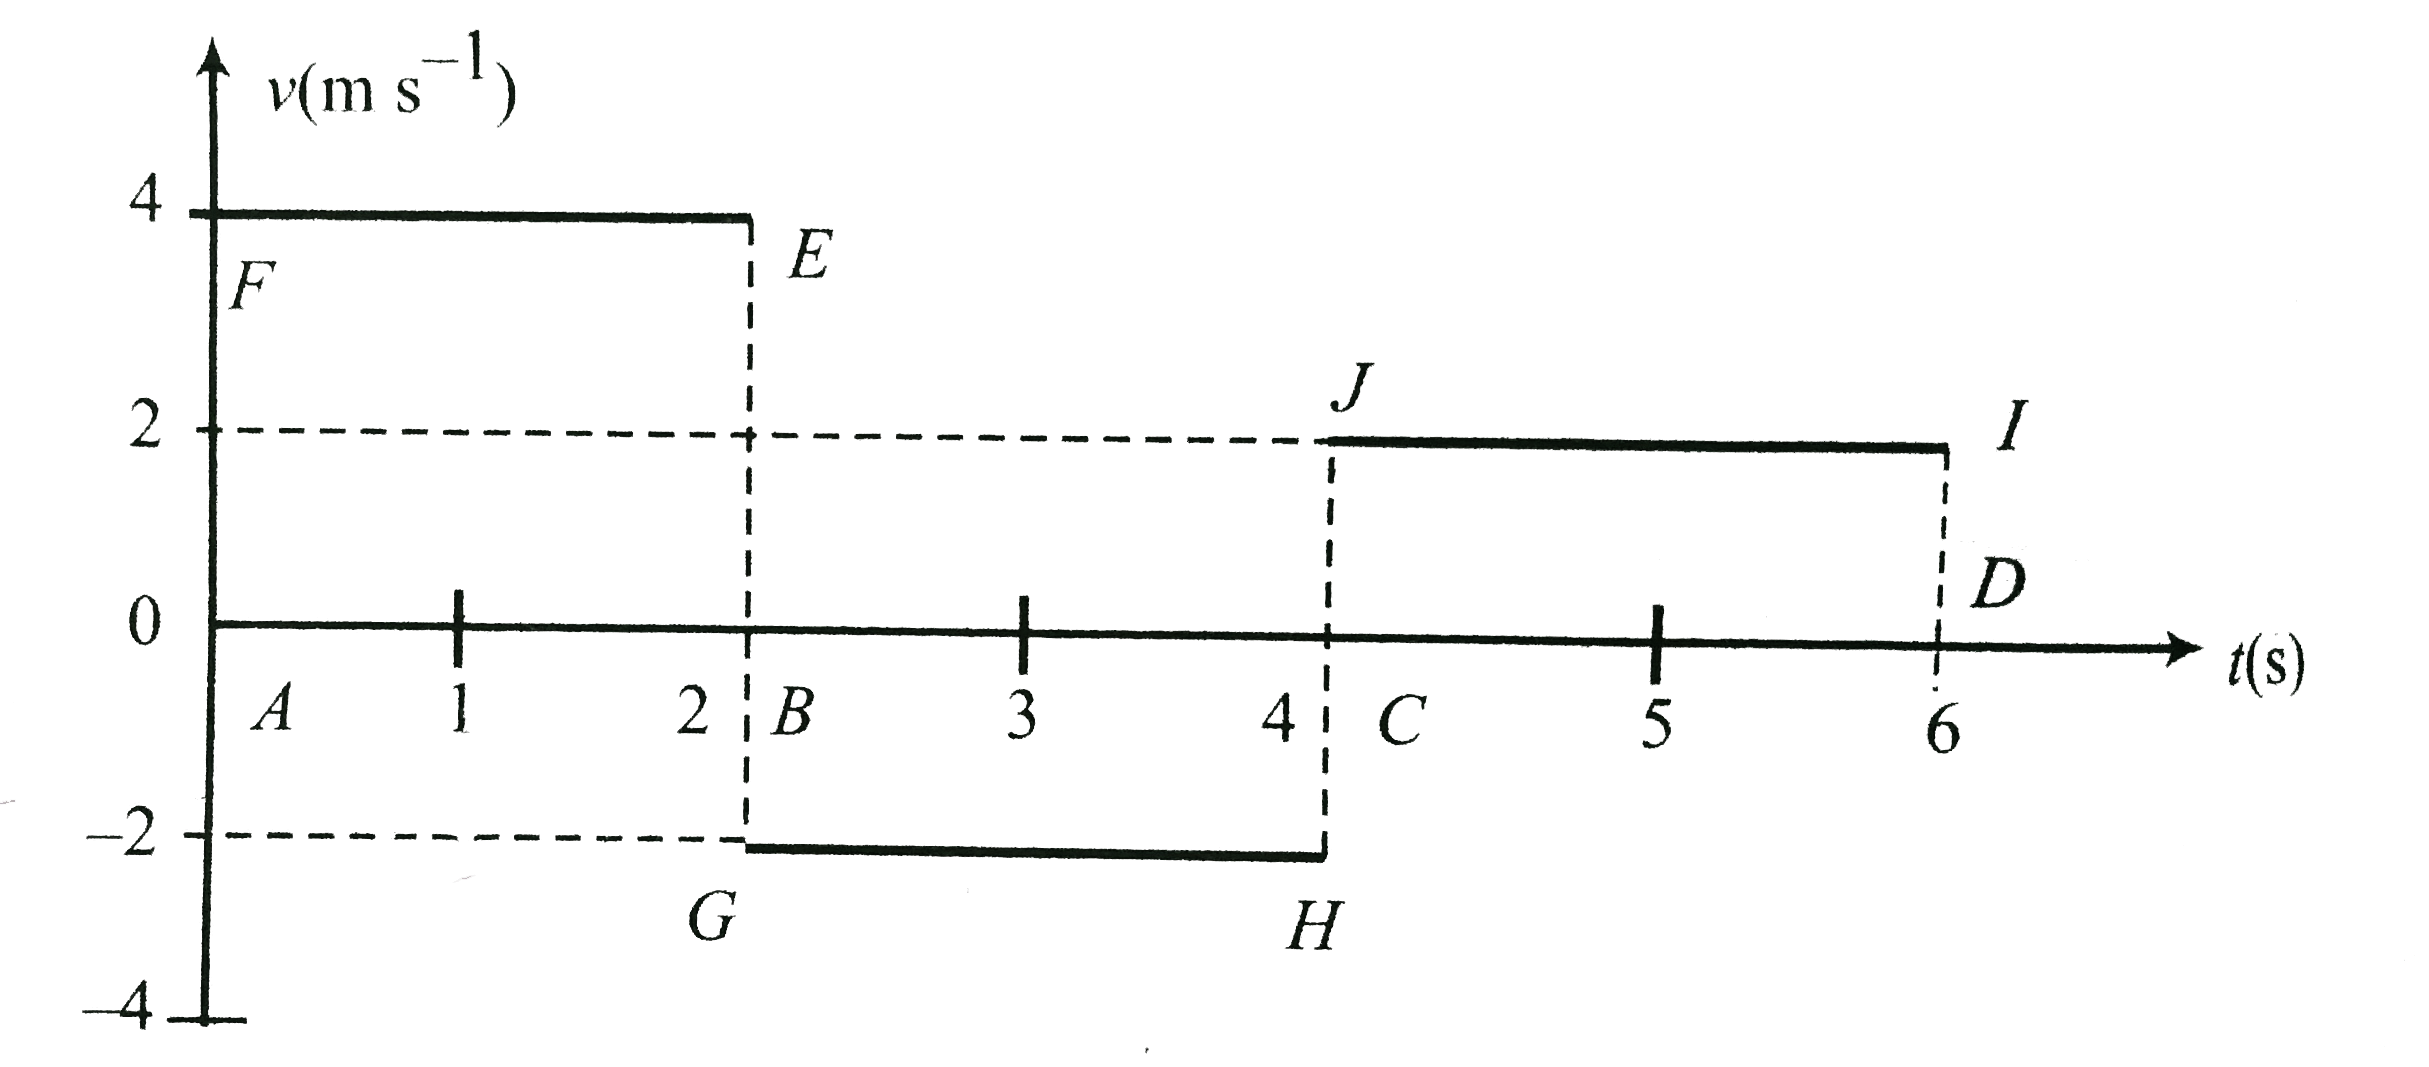
View SolutionThe velocity-time graph of a particle moving in a staight line is shown in the . Find the displacement and the distance trav elled by the particle in 6s.
 .
.
View SolutionThe velocity-time graph of a particle moving in a staight line is shown in the . Find the displacement and the distance trav elled by the particle in 6s.
 .
.
View SolutionThe velocity-time graph line motion is shown in Fing. 2 (b).7. Find (a) the distance travelled and (b) displacement, between 5and40s. (c ) Acceleration betwwn 15 to 25 seconds.
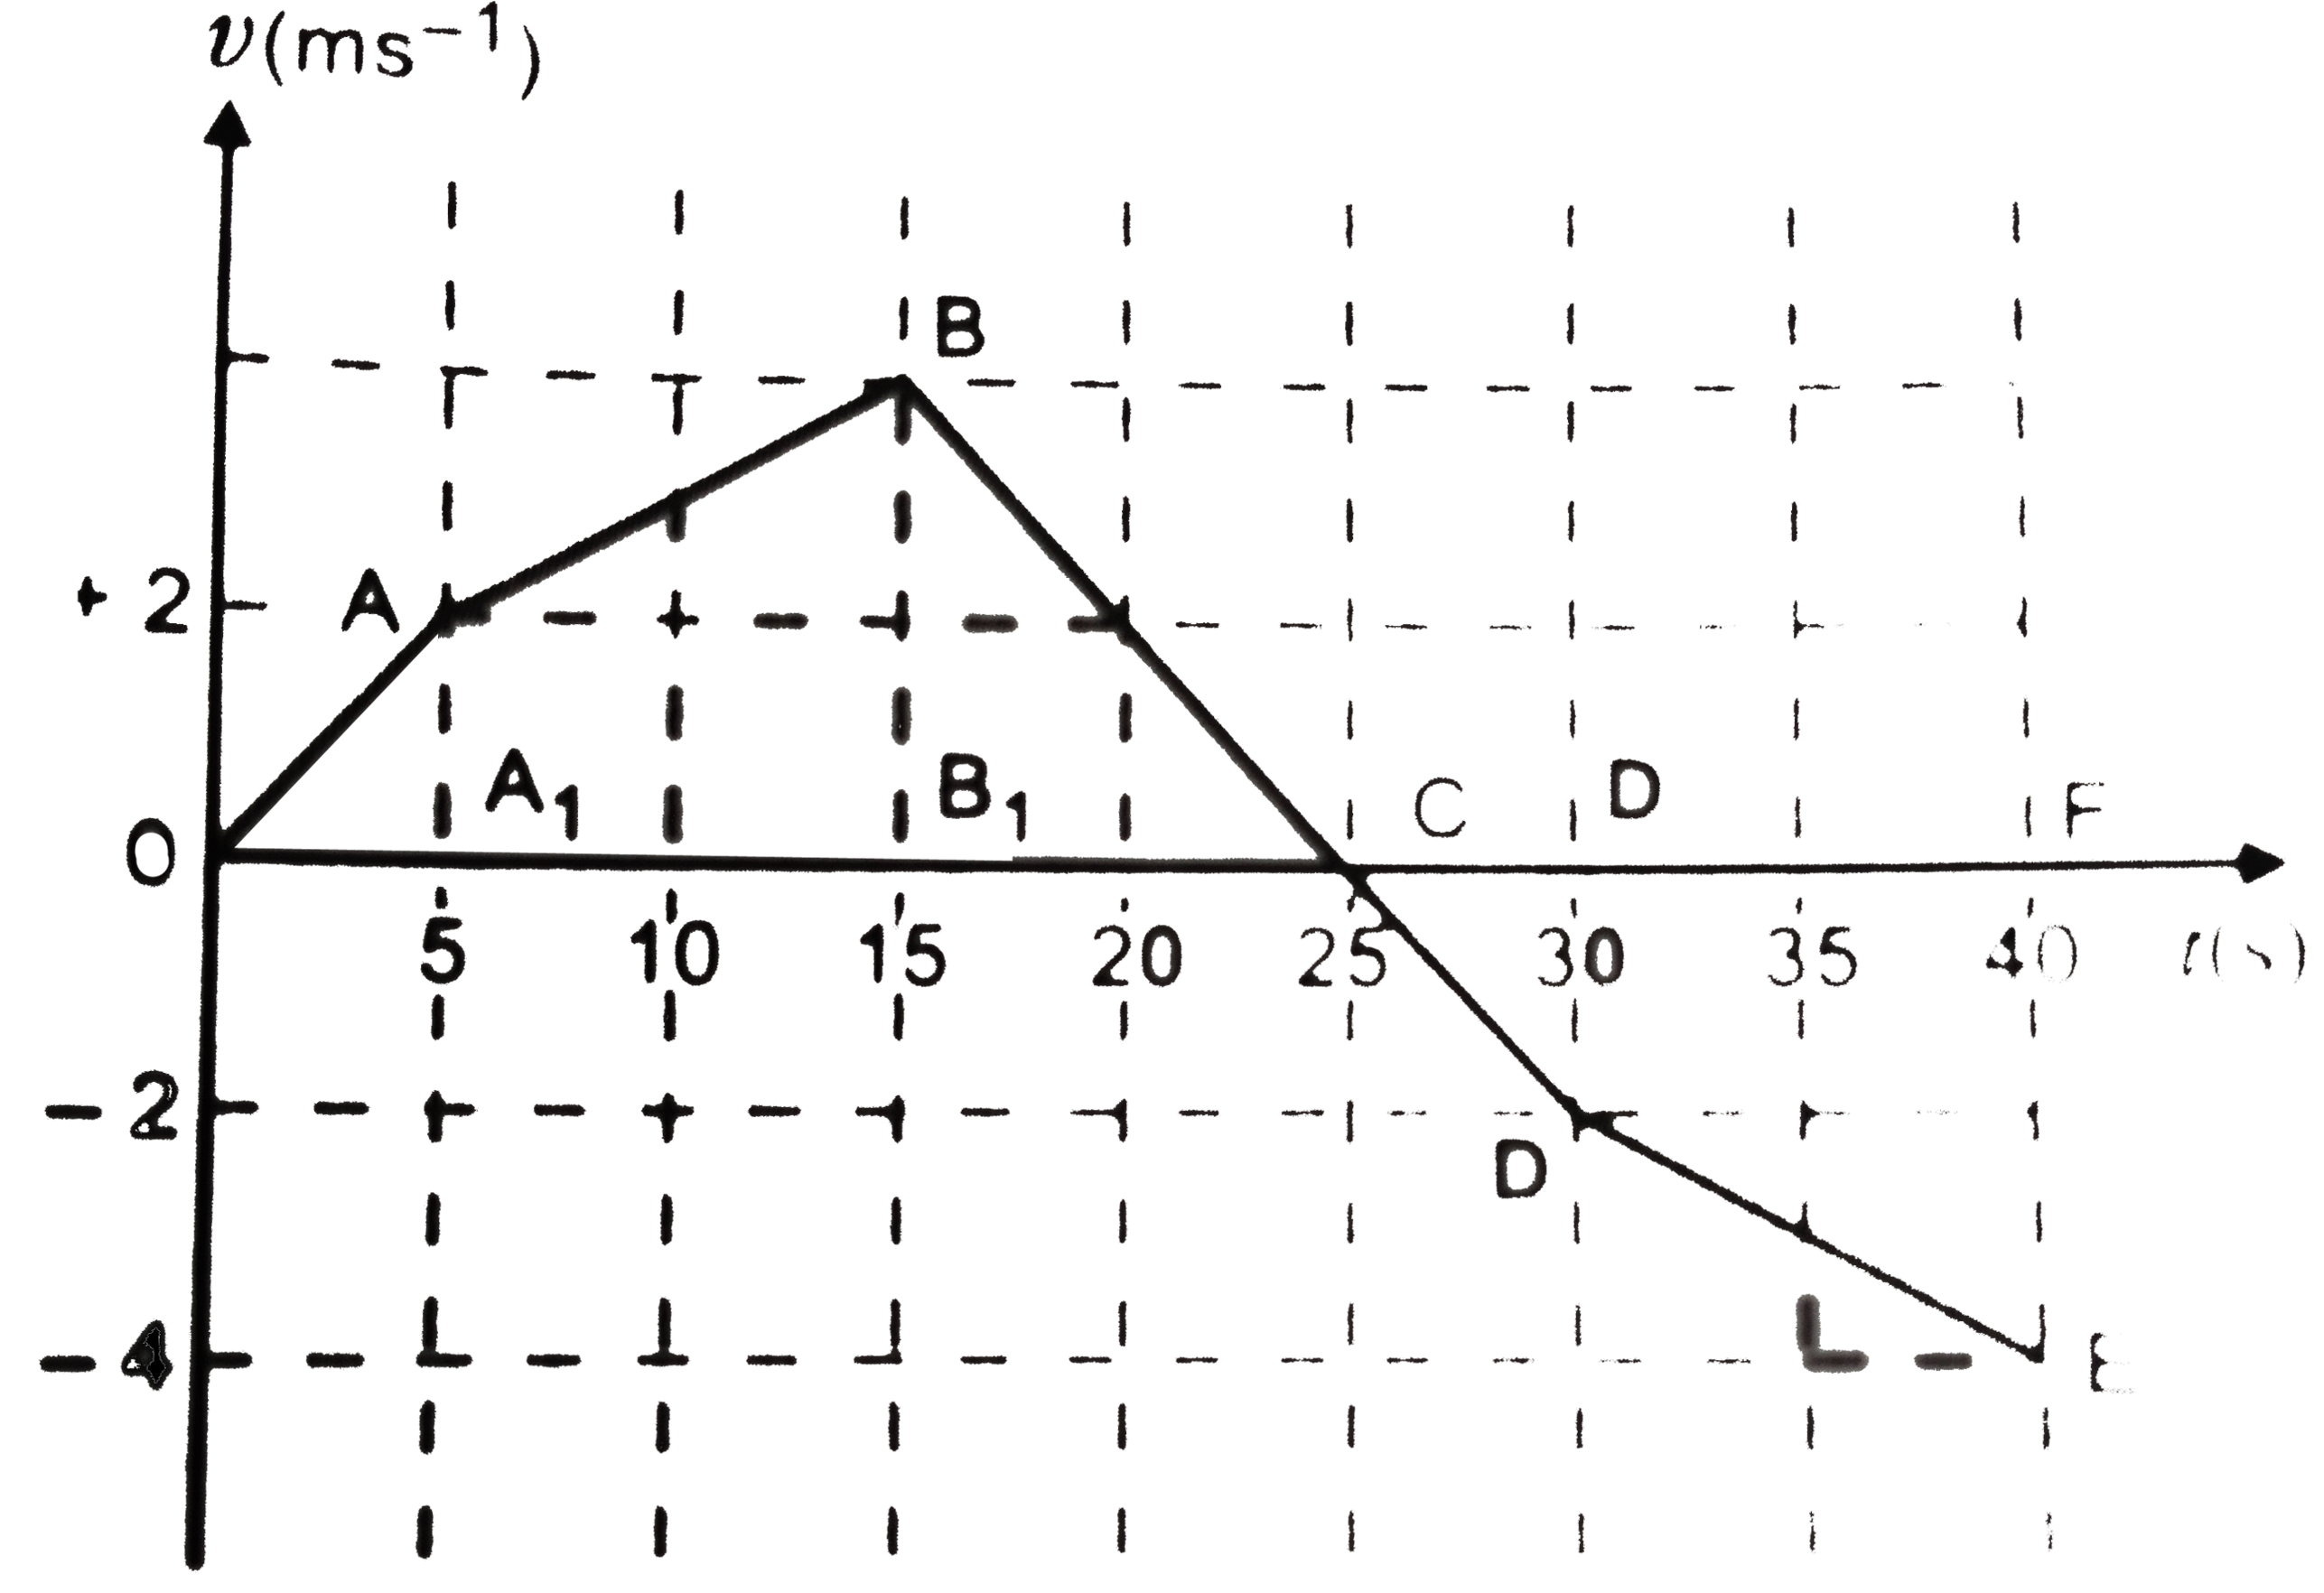
View SolutionThe velocity - time graph for linear motion of an object is as shown. Find
(a) The distance travelled and
(b) Displacement for the interval between 5 s and 40 s.
View SolutionThe velocity - time graph for linear motion of an object is as shown. Find
(a) The distance travelled and
(b) Displacement for the interval between 5 s and 40 s.

View Solution
