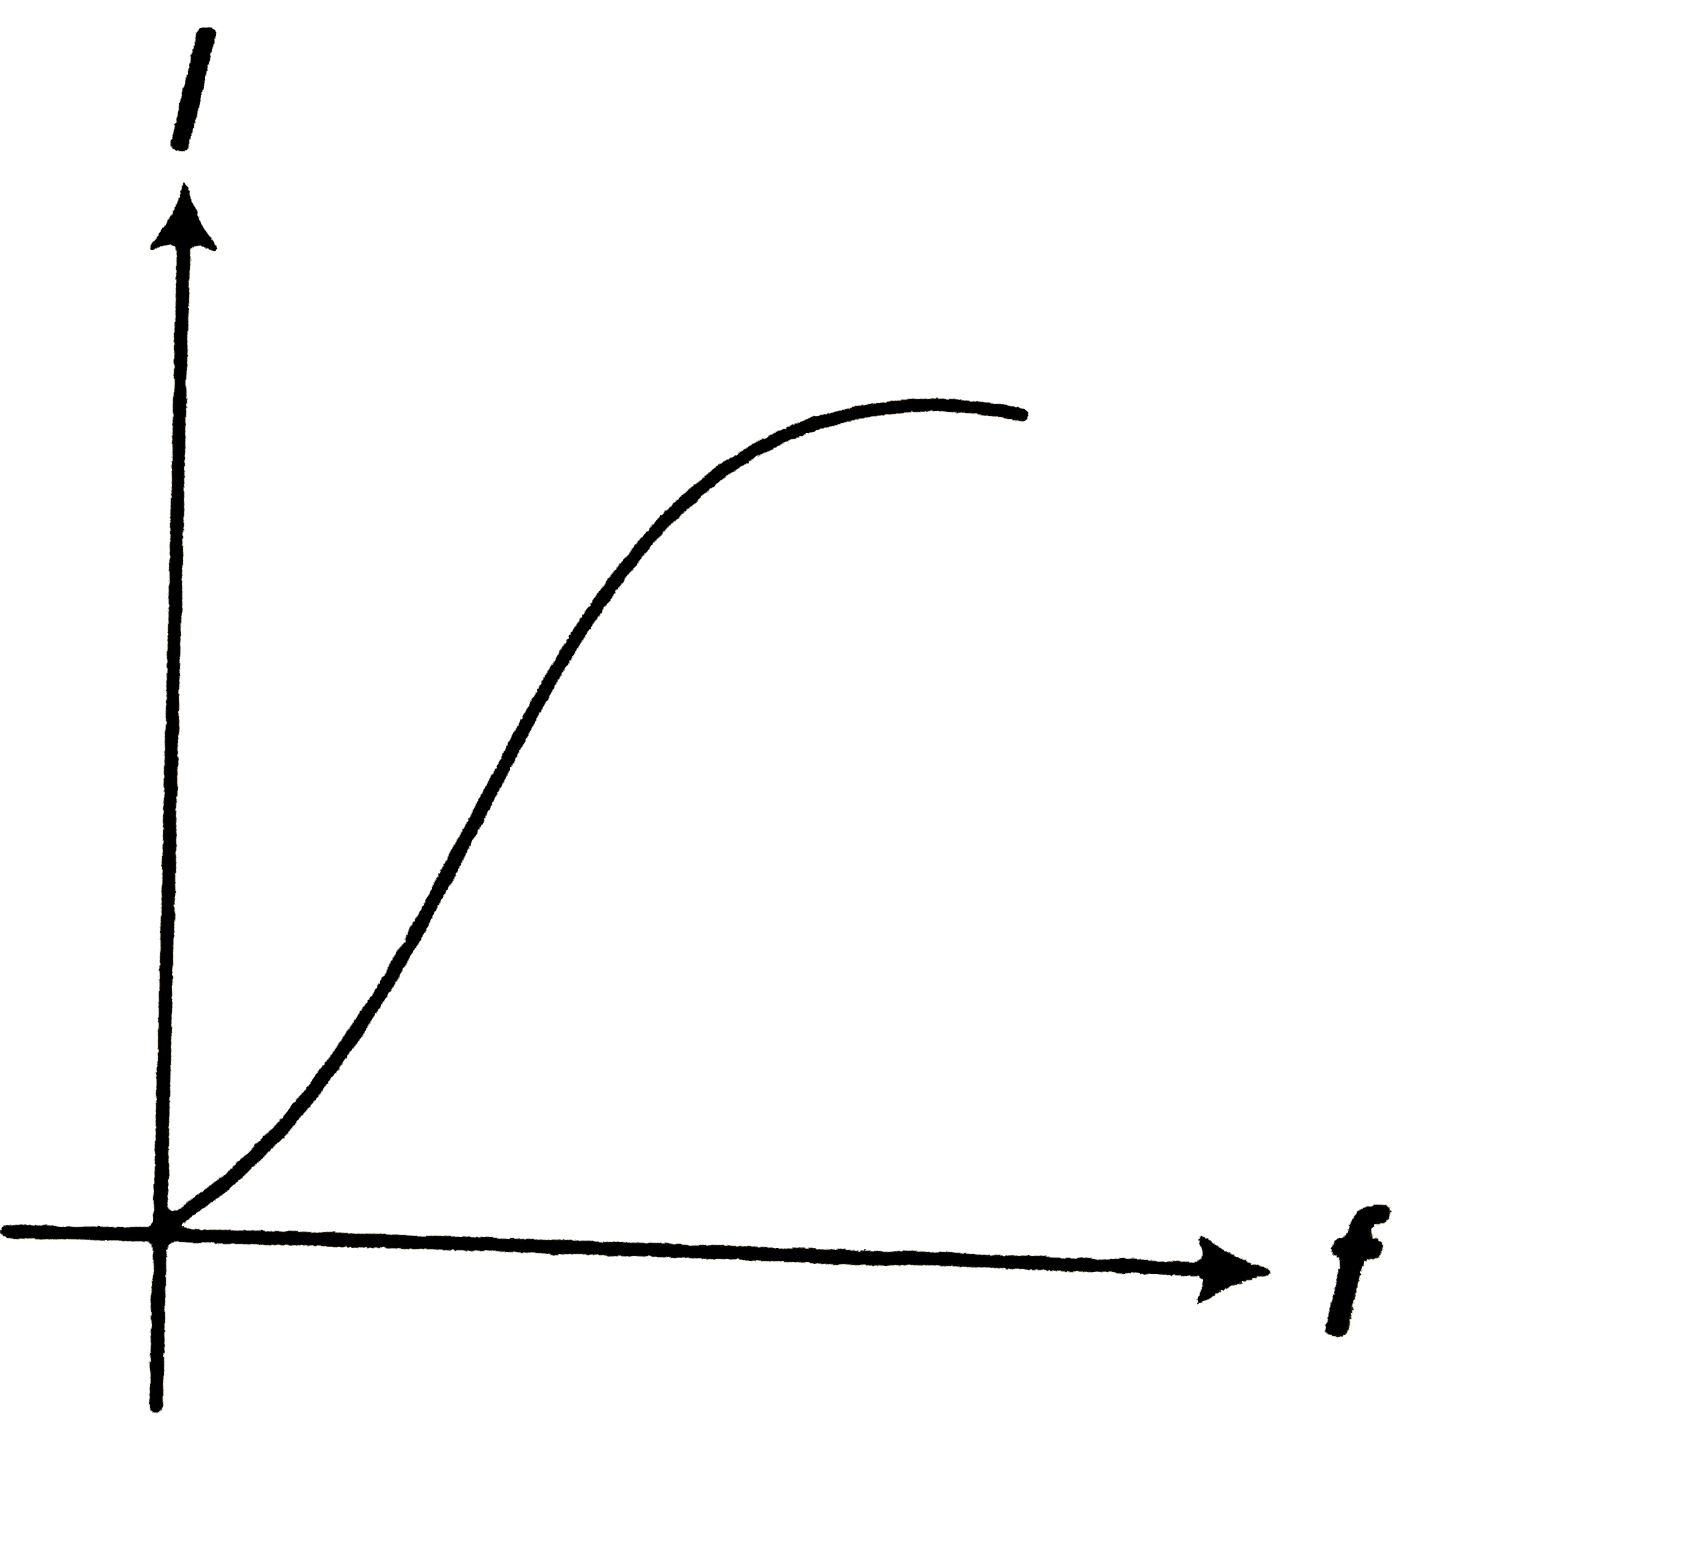
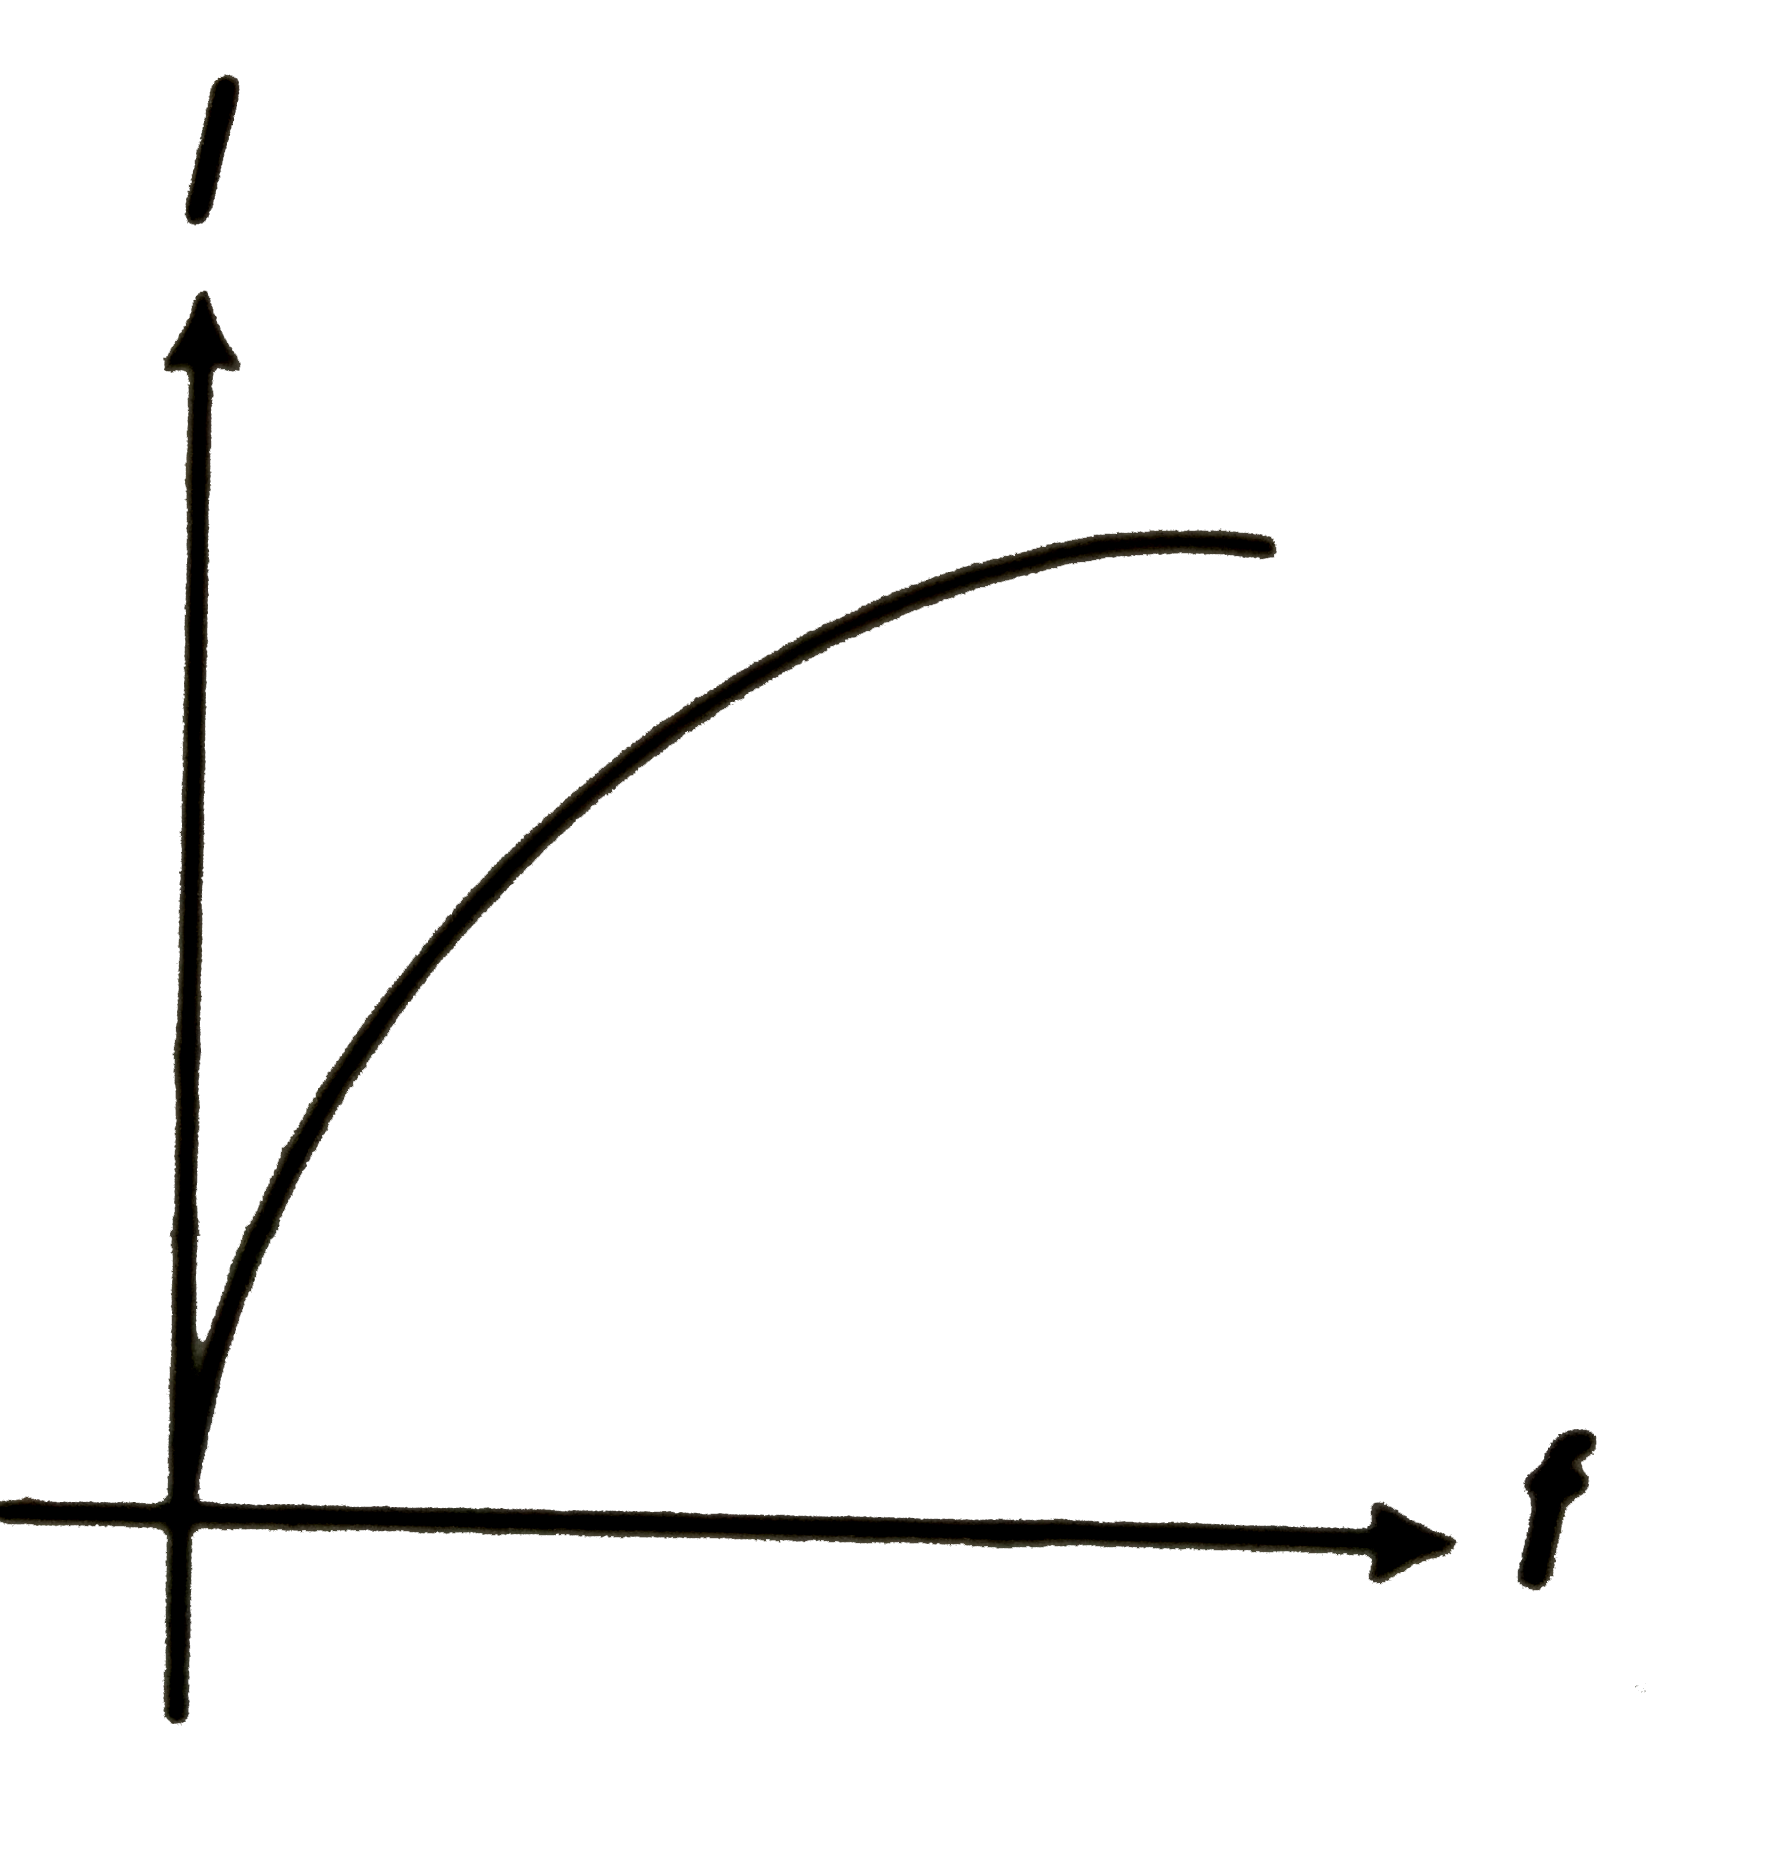
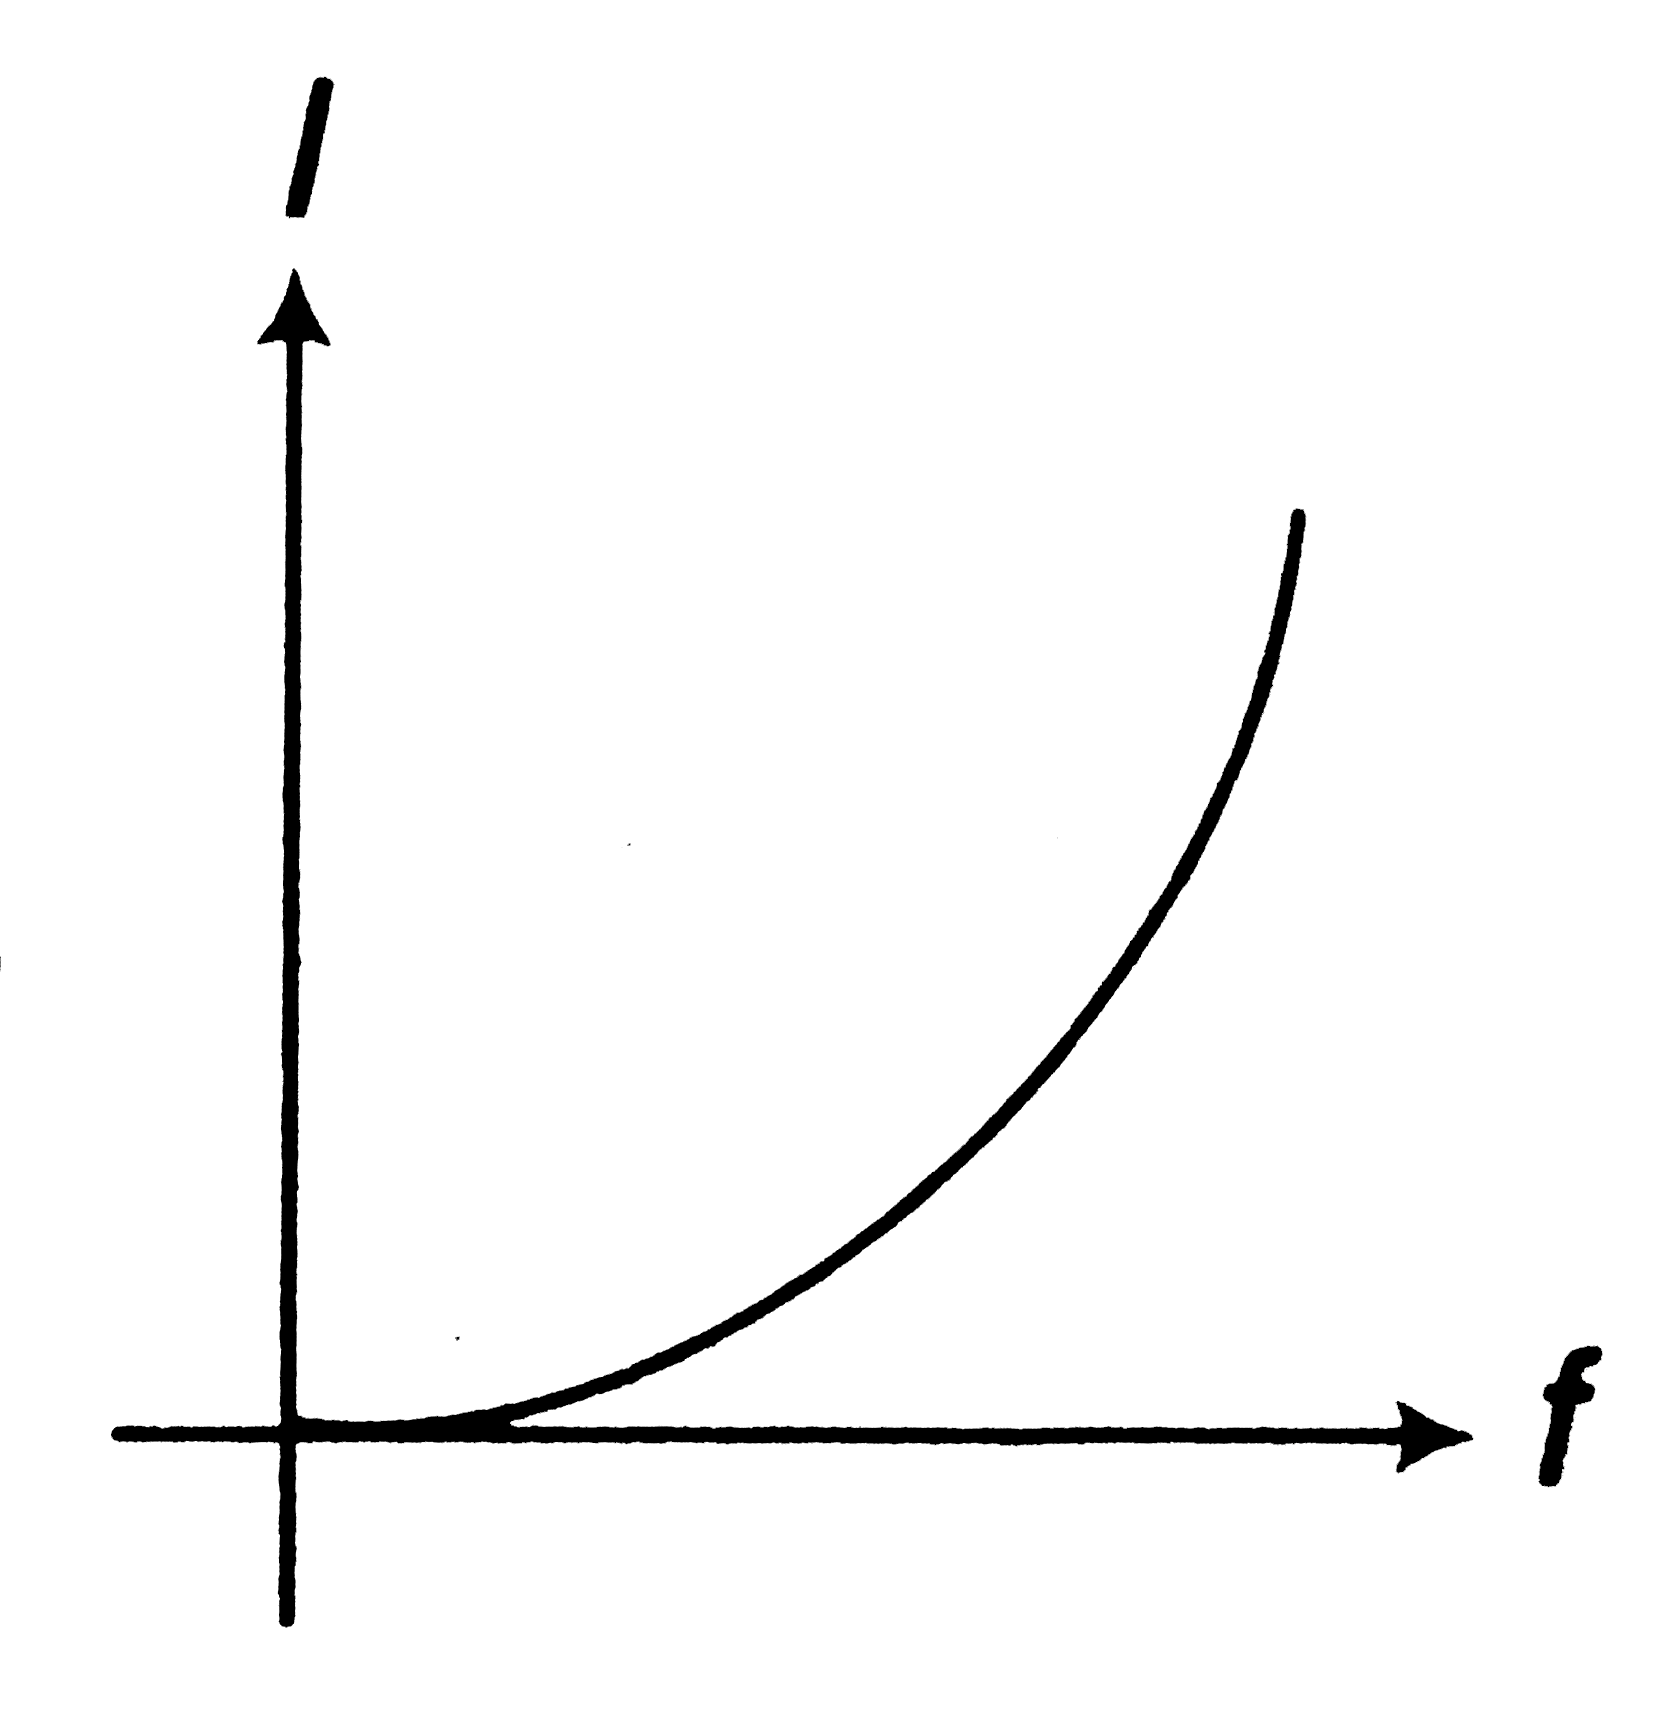
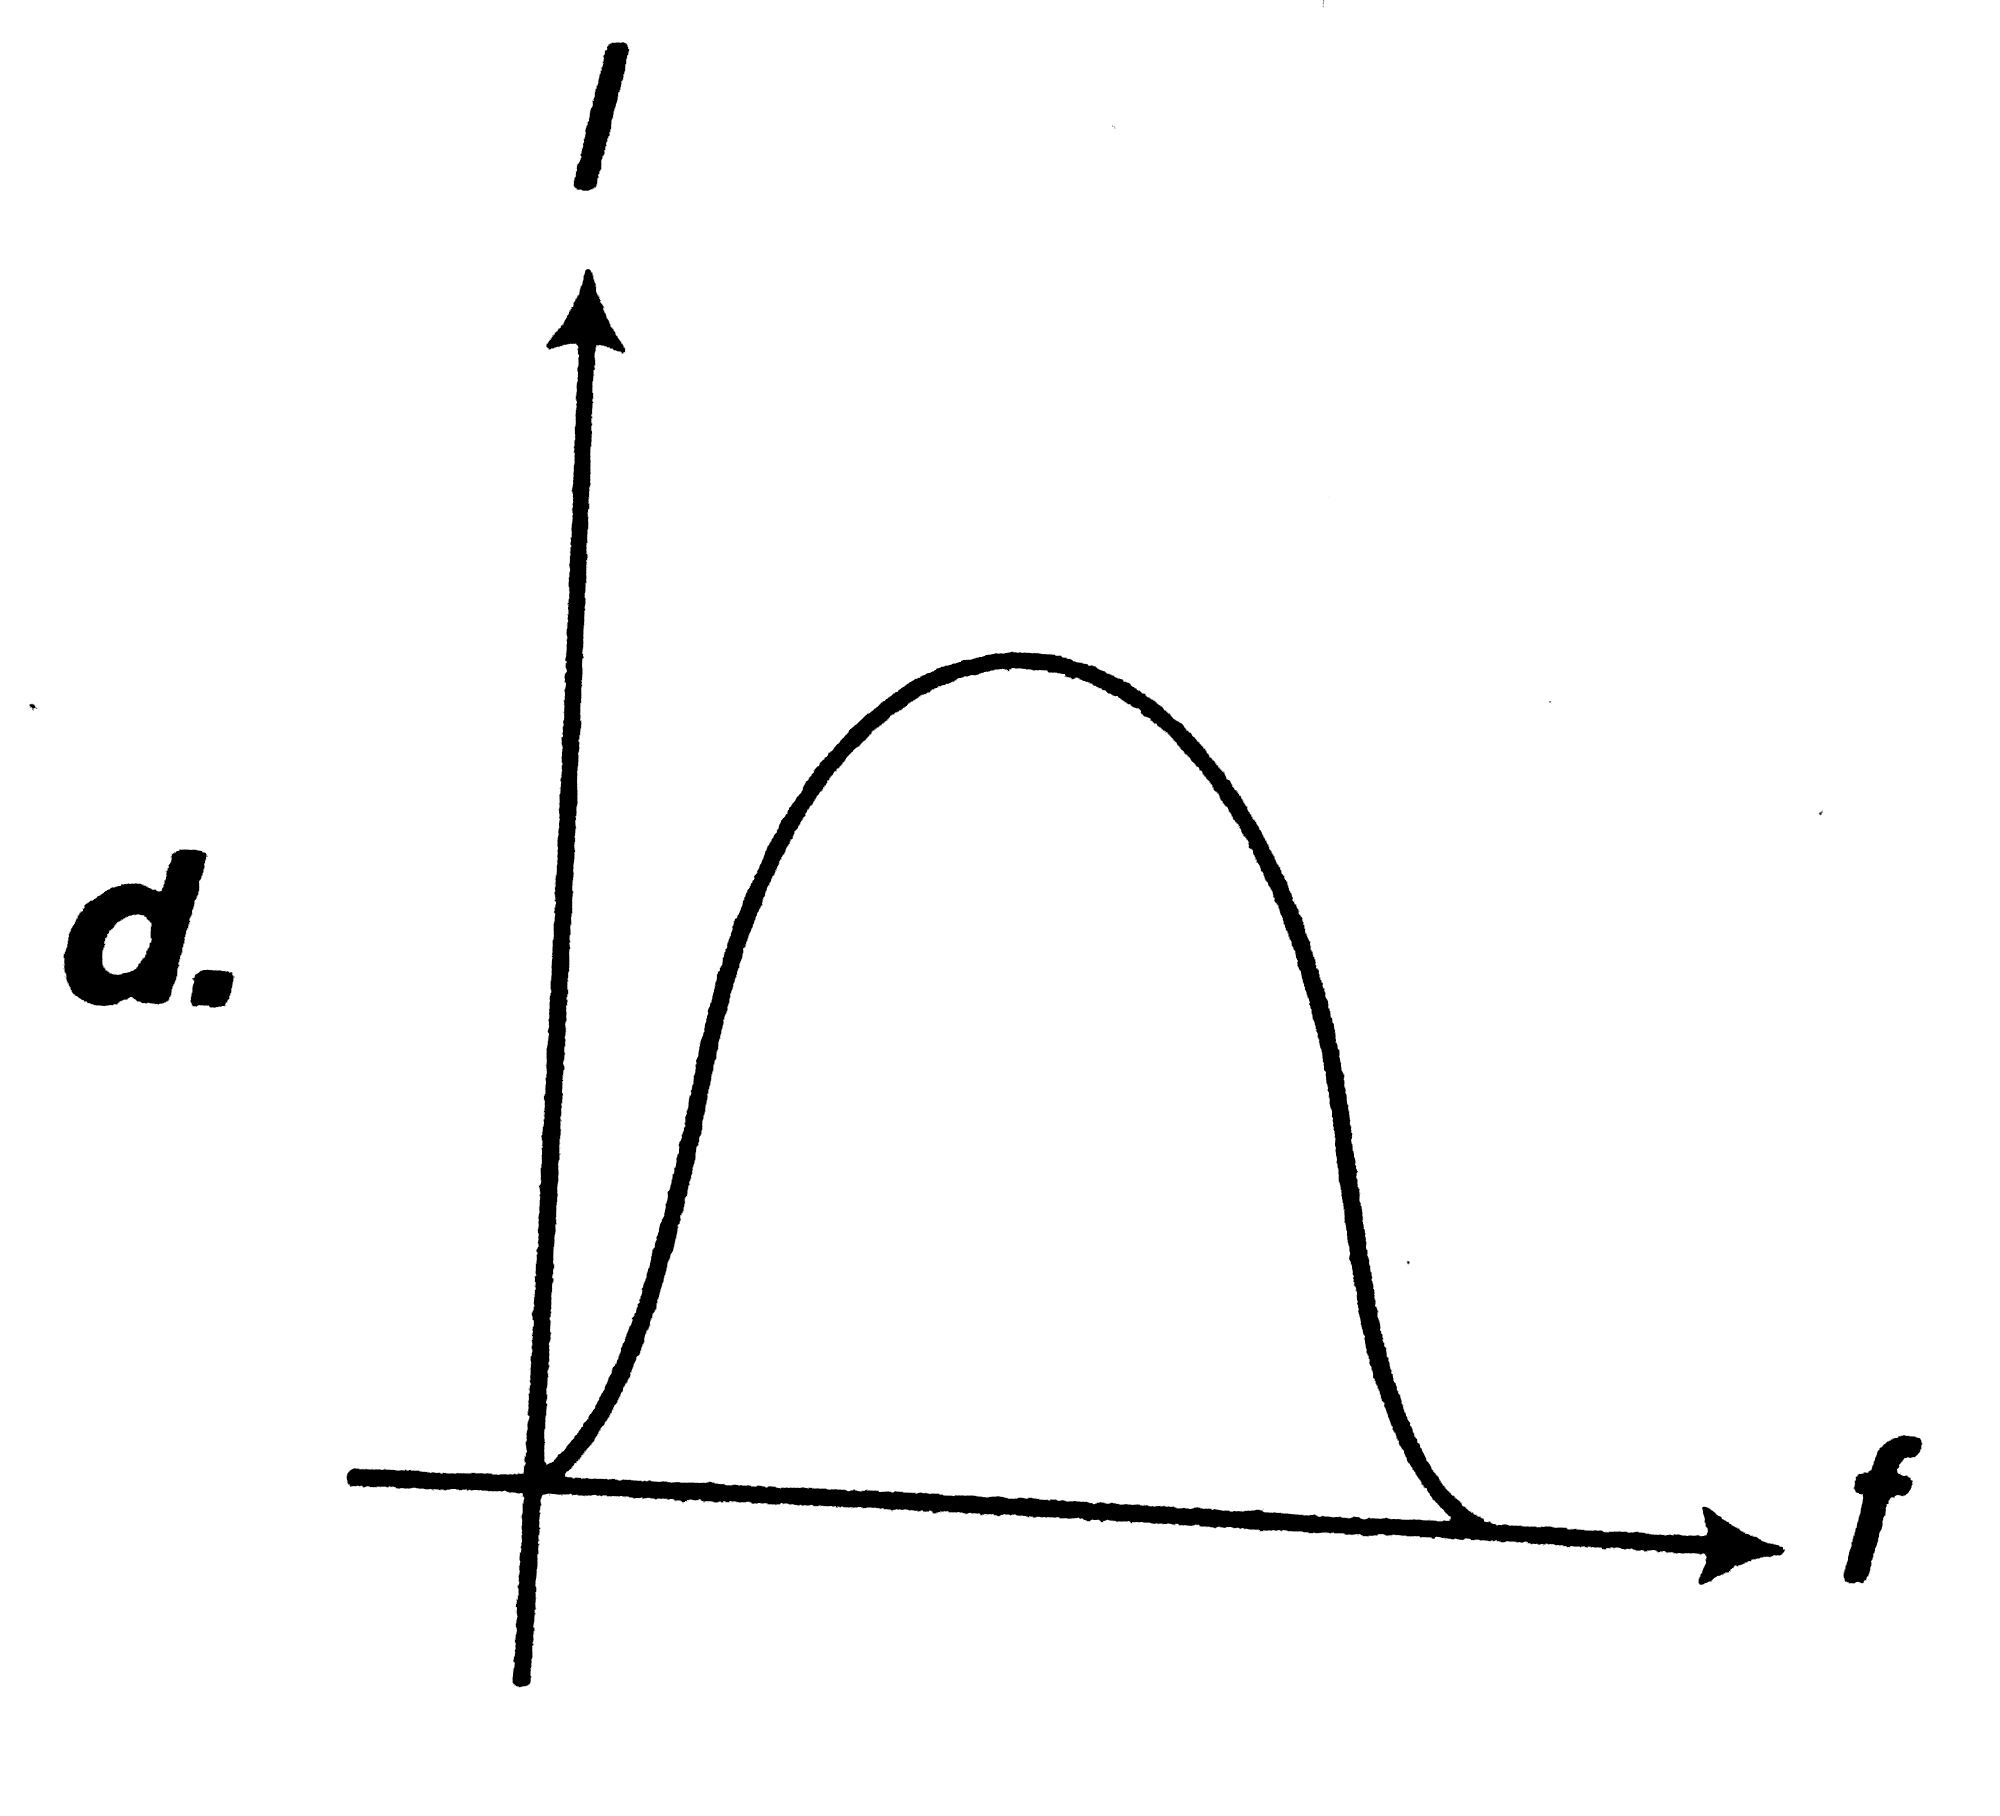
An AC source of variable frequency f is connected to an LCR series circuit. Which one of the graphs in figure represents the variation of current of current I in the circuit with frequecy f?
A

B

C

D

Video Solution
Text Solution
The correct Answer is:D
The current in an L-C-R circuit is given by
l=V[R2+(ωL−1ωC)2]1/2, where ω=2πf
thus, l increases with an increase in ω upto a value given by,ω=ωc i. At ω=ωc, we have
ωL=1ωC⇒ωc=1√LC
where l is maximum l is maximum. At ω>ωc l again starts decreasing with an increase in ω.
|
Updated on:21/07/2023
Topper's Solved these Questions
- BOOK - MHTCET PREVIOUS YEAR PAPERS AND PRACTICE PAPERSCHAPTER - ELECTROMAGNETIC INDUCTIONEXERCISE - Example 228videos
ELECTROMAGNETIC INDUCTION
- BOOK - MHTCET PREVIOUS YEAR PAPERS AND PRACTICE PAPERSCHAPTER - ELECTROMAGNETIC INDUCTIONEXERCISE - Example 301videos
ELECTROMAGNETIC INDUCTION
- BOOK - MHTCET PREVIOUS YEAR PAPERS AND PRACTICE PAPERSCHAPTER - ELECTROMAGNETIC INDUCTIONEXERCISE - MHT CET CONER34videos
ELECTROMAGNETIC INDUCTION
- BOOK - MHTCET PREVIOUS YEAR PAPERS AND PRACTICE PAPERSCHAPTER - ELASTICITY EXERCISE - MHT CET CORNER16videos
ELASTICITY
- BOOK - MHTCET PREVIOUS YEAR PAPERS AND PRACTICE PAPERSCHAPTER - ELECTRONS AND PROTONSEXERCISE - MHT CET CORNER19videos
ELECTRONS AND PROTONS
Similar Questions
Knowledge Check
- Question 1 - Select One
An a.c. source of variable angular frequency o is connected to an LCR series circuit. Which one of the following graphs correctly represents variation of impedance Zof a.c. circuit with angular frequency ω?
A B
B C
C D
D
- Question 2 - Select One
In an LCR series circuit the current is
Ain phase with applied emfBlags the applied voltageClead the applied voltageDmay lead or lag behind the applied voltage - Question 3 - Select One
A variable frequency alternating voltage of constant magnitude is applied across a capacitor. Which of the following graph shows the variation of current set up in the circuit with frequency v?
A B
B C
C D
D
In LCR series AC circuit, the current
View SolutionWhich of the following graphs represent the variation of current(I) with frequency (f) in an AC circuit containing a pure capacitor?
View SolutionWhich of the following curves represents the variation of impedance (Z) with frequency f in series LCR circuit?
View SolutionAt resonance the peak value of current in a series LCR circuit is
View SolutionIf a variable frequency ac source is connected to a capacitor then with decrease in frequency the displacement current will
View Solution

