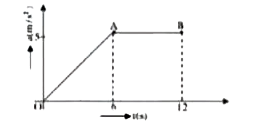
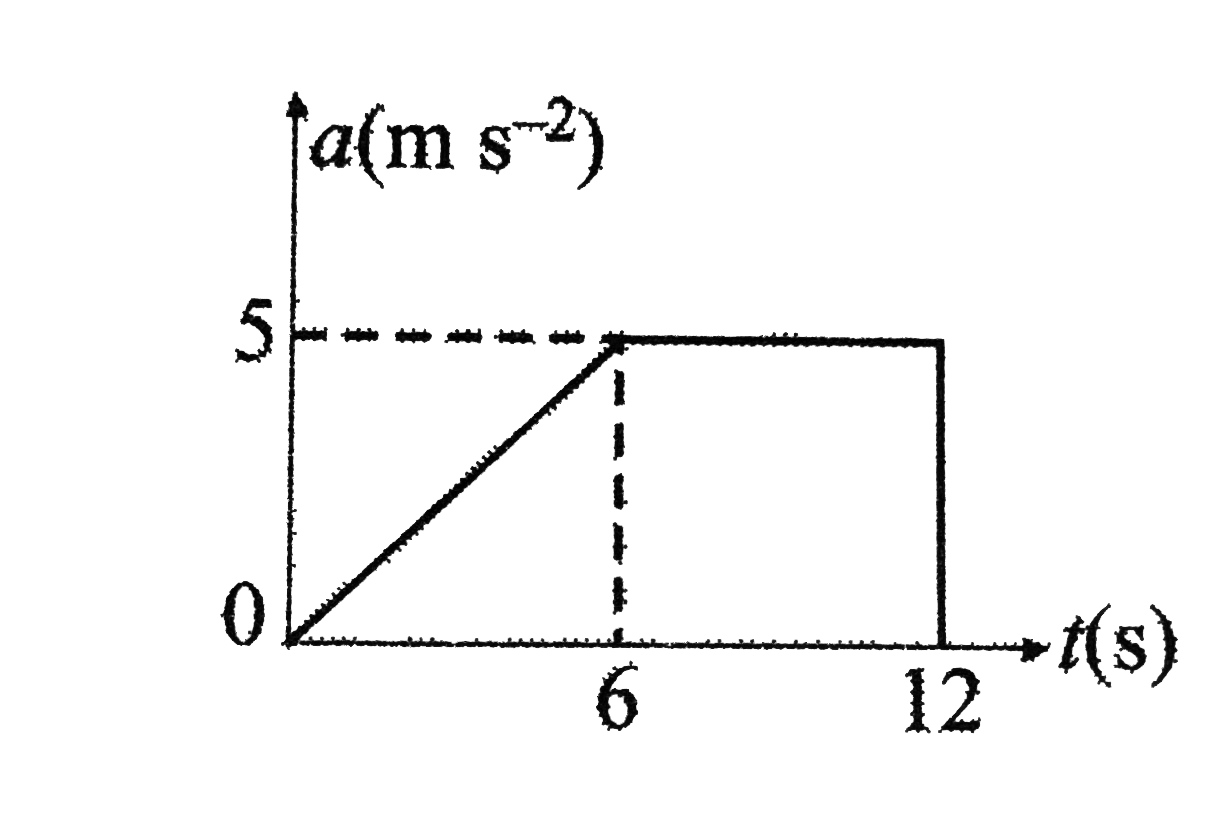
An experiment on the take off performance of an aeroplane shows that the acceleration vaies as shown in (figure) and that it takes 12s to take off from a rest position.
a. Write the acceleration vs. time, velocity vs. time and position vs. time relations for complete journey.
b. Plot velocity vs. time relation for the motion.
c. Find the distance along the run way covered by the aeroplane.
Text Solution
For time t=0 to 6s
We can write equation for this motion, it is y=mx type line where m is the slope of the line.
Here, a=(5−0)(6−0)⋅t⇒a=56t(ms−2) …(i)
(For0≤t<6s)
From 6s to 12s acceleration is constant, we can write equation for this motion, it is y=constant.
Hence a=5(ms−2) (For6≤t<12s)
For time t=0 to 6s
From Eq. (i) a=dvdt=56t⇒dv=56tdt
Integrating both sides, we get v∫0dv=56t∫0tdt
[v]v0=56[t22]t0 or (v−0)=512(t2−0) or v=512t2
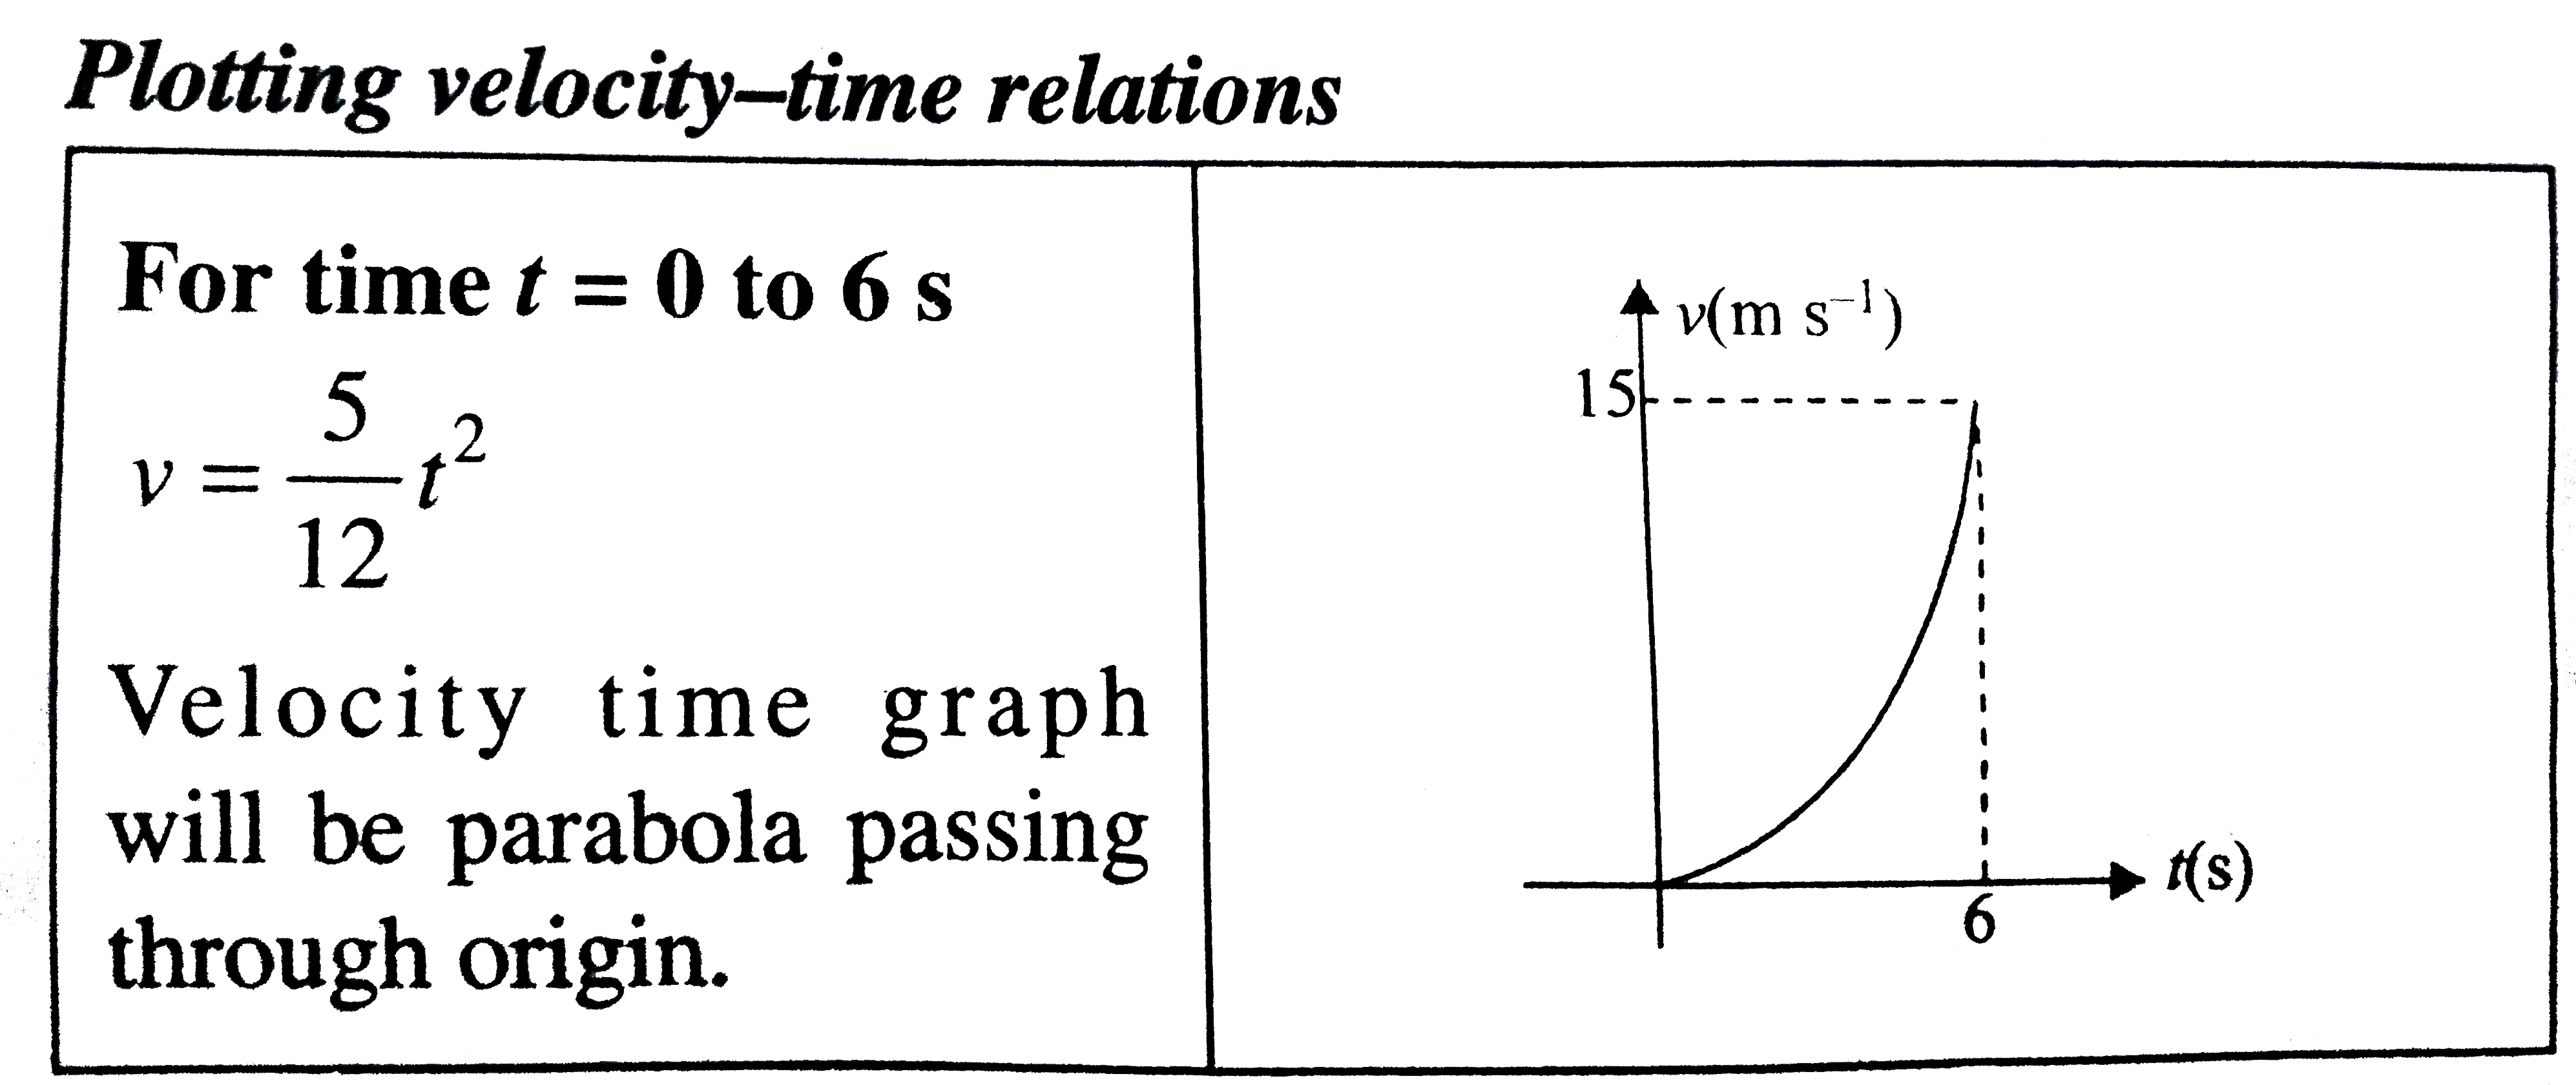
Here velocity at t=6s is vt=6s=512×62=15ms−1
For time t=0 to 6s
The acceleration is constant.
a=5(ms−2) or dvdt=5 or dv=5dt
Integrating both sides, v∫15dv=t∫65⋅dt
[v]v15=5[t]t6
v−15=5[t−6]
⇒v=5t−15
Velocity-time relation will be a straight line of type y=mx+c.
Plotting velocity-time relations
For time t=0 to 6s
v=512t2
Velocity time graph will be parabola passing through origin.
Position time relations
For time t=0 to 6s
As we know v=dxdt=512t2
Hence, 512t2=dxdt⇒dx=512∫t2dt
Integrating both sides, x∫0dx=512t∫0t2dt
(x−0)=512[t33]t0⇒x=536t3
Position or the distance travelled from 0 to 6s
x(t=6sec)=536×(6)3=30m
For time t=6s to 12s
v=5t−15⇒dxdt=5t−5
or dx=(5t−15)dt
Integrating both sides
x∫30dx=t∫6(5t−15)dt
[x]x30=5t∫6tdt−15t∫6dt
(x−30)=5[t22]t6−15[t]t6
x−30=52[t2−62]−15[t−6]
x=52t2−15t+30
At t=12s,
x(t=12s)=52(12)2−15×12+30=210m
|
Topper's Solved these Questions
- BASIC MATHEMATICSBOOK - CENGAGE PHYSICSCHAPTER - BASIC MATHEMATICSEXERCISE - Exercise 2.1
2 Videos
- BASIC MATHEMATICSBOOK - CENGAGE PHYSICSCHAPTER - BASIC MATHEMATICSEXERCISE - Exercise 2.2
3 Videos
- BASIC MATHEMATICSBOOK - CENGAGE PHYSICSCHAPTER - BASIC MATHEMATICSEXERCISE - Exercise 2.6
20 Videos
- ARCHIVES 2 VOLUME 6BOOK - CENGAGE PHYSICSCHAPTER - ARCHIVES 2 VOLUME 6EXERCISE - Integer
4 Videos
- CALORIMETRYBOOK - CENGAGE PHYSICSCHAPTER - CALORIMETRYEXERCISE - Solved Example
13 Videos
Similar Questions
Knowledge Check
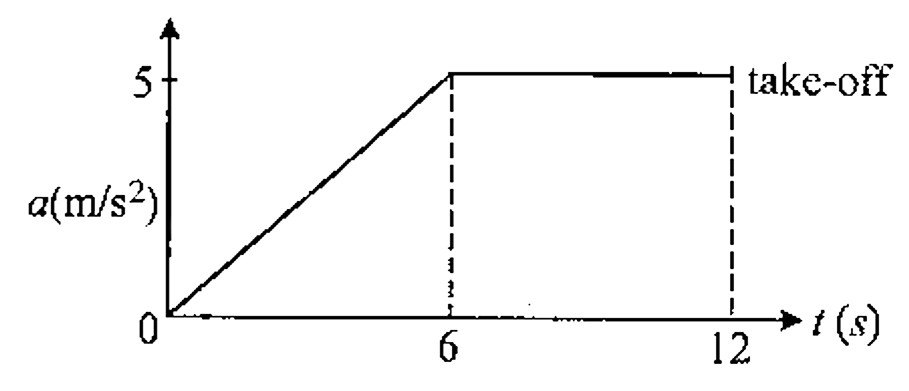
An experiment on the take-off performance of an aeroplane shows that the acceleration varies as shown in the figure-l. 133, and that it takes 12s to take off from a rest position. The distance along the run way covered by the aeroplane is :
 A210 mB2100 mC21000 mD1200 m
The slope in the plot of ln[R] vs. time gives in first order reaction
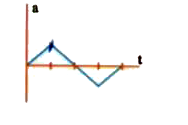
A+kB+k2.303C−kD−k2.303Which of the following v Vs t graph are correct representation for the acceleration Vs time graph shown below
 A
A B
B C
C D
D
Speed vs Velocity
View SolutionSpeed vs Velocity
View SolutionAn aeroplane runs for some distance on the run way before taking off. Why?
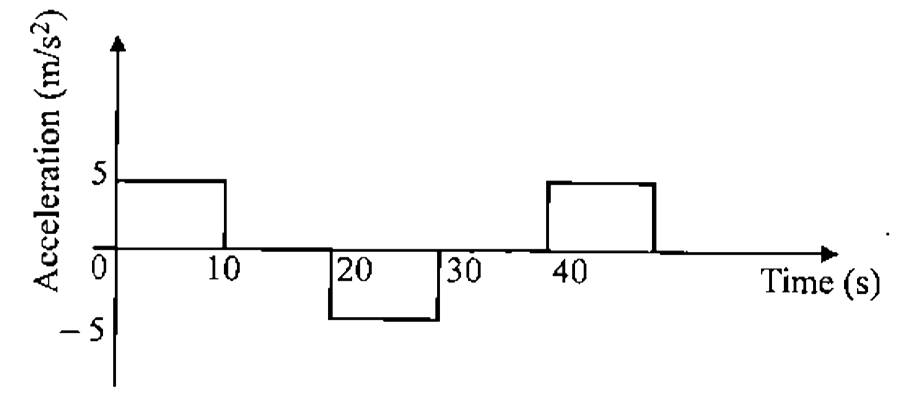
View SolutionThe acceleration vs time of a particle moving along +x direction is shown in figure-1.23. If starts at t=0, from rest, Draw the position -time graph for the motion.
View SolutionFor a zero order reaction, the plot of concentration, vs time is linear with
View Solution

